System and method for efficiently visualizing and comparing communication network system performance

a communication network and performance analysis technology, applied in the field of system and method for efficiently visualizing and comparing communication network system performance, can solve the problems of reducing the cost of in-building and microcellular wireless communication devices, not reporting a comprehensive method for visualizing and analyzing wireless system performance, and not achieving the effect of facilitating the display of predicted performance results and comparisons

Inactive Publication Date: 2005-02-24
EXTREME NETWORKS INC
View PDF99 Cites 72 Cited by
  • Summary
  • Abstract
  • Description
  • Claims
  • Application Information

AI Technical Summary

Benefits of technology

[0020] It is therefore an object of the present invention to facilitate the display of predicted performance result

Problems solved by technology

As communication systems proliferate, radio frequency (RF) coverage within and around buildings, and radio signal penetration into and out of buildings, has become a critical design issue for communications engineers who must design and deploy cellular telephone systems, paging systems, or new wireless technologies such as personal communication systems (PCS), wireless local area networks (WLAN), and local multi-point distribution systems (LMDS).
The costs of in-building and microcellular wireless communication devices are diminishing while the workload for wireless system design engineers and technicians to deploy such systems is increasing sharply.
While most of the above papers describe a comparison of measured versus predicted RF signal coverage and present tabular or two dimensional (2-D) methods for representing and displaying predicted data, they do not report a comprehensive method for visualizing and analyzing wireless system performance.
The “Radio Propagation” and “Site-Specific” papers make reference to 3-D modeling, but do not offer novel display methods or graphical techniques to enable a user to visualize signal coverage or interference in 3-D.
Furthermore, there do not exist effective methods that allow a wireless communications technician or designer to rapidly display predicted performance values, or to compare, through visualization, differences in predicted performance values between alternate network design concepts within a particular specified environment.
However, the implementation of such models are generally very crude, and rely on cumbersome spreadsheets, or inefficient operating platforms in research laboratories with little support and little visualization capability.
Thus, maximizing the performance of a wireless system may involve the complex analysis of multiple, potentially unrelated factors.
Such displays, although useful, are limited by their two-dimensional nature in conveying all nua

Method used


Image

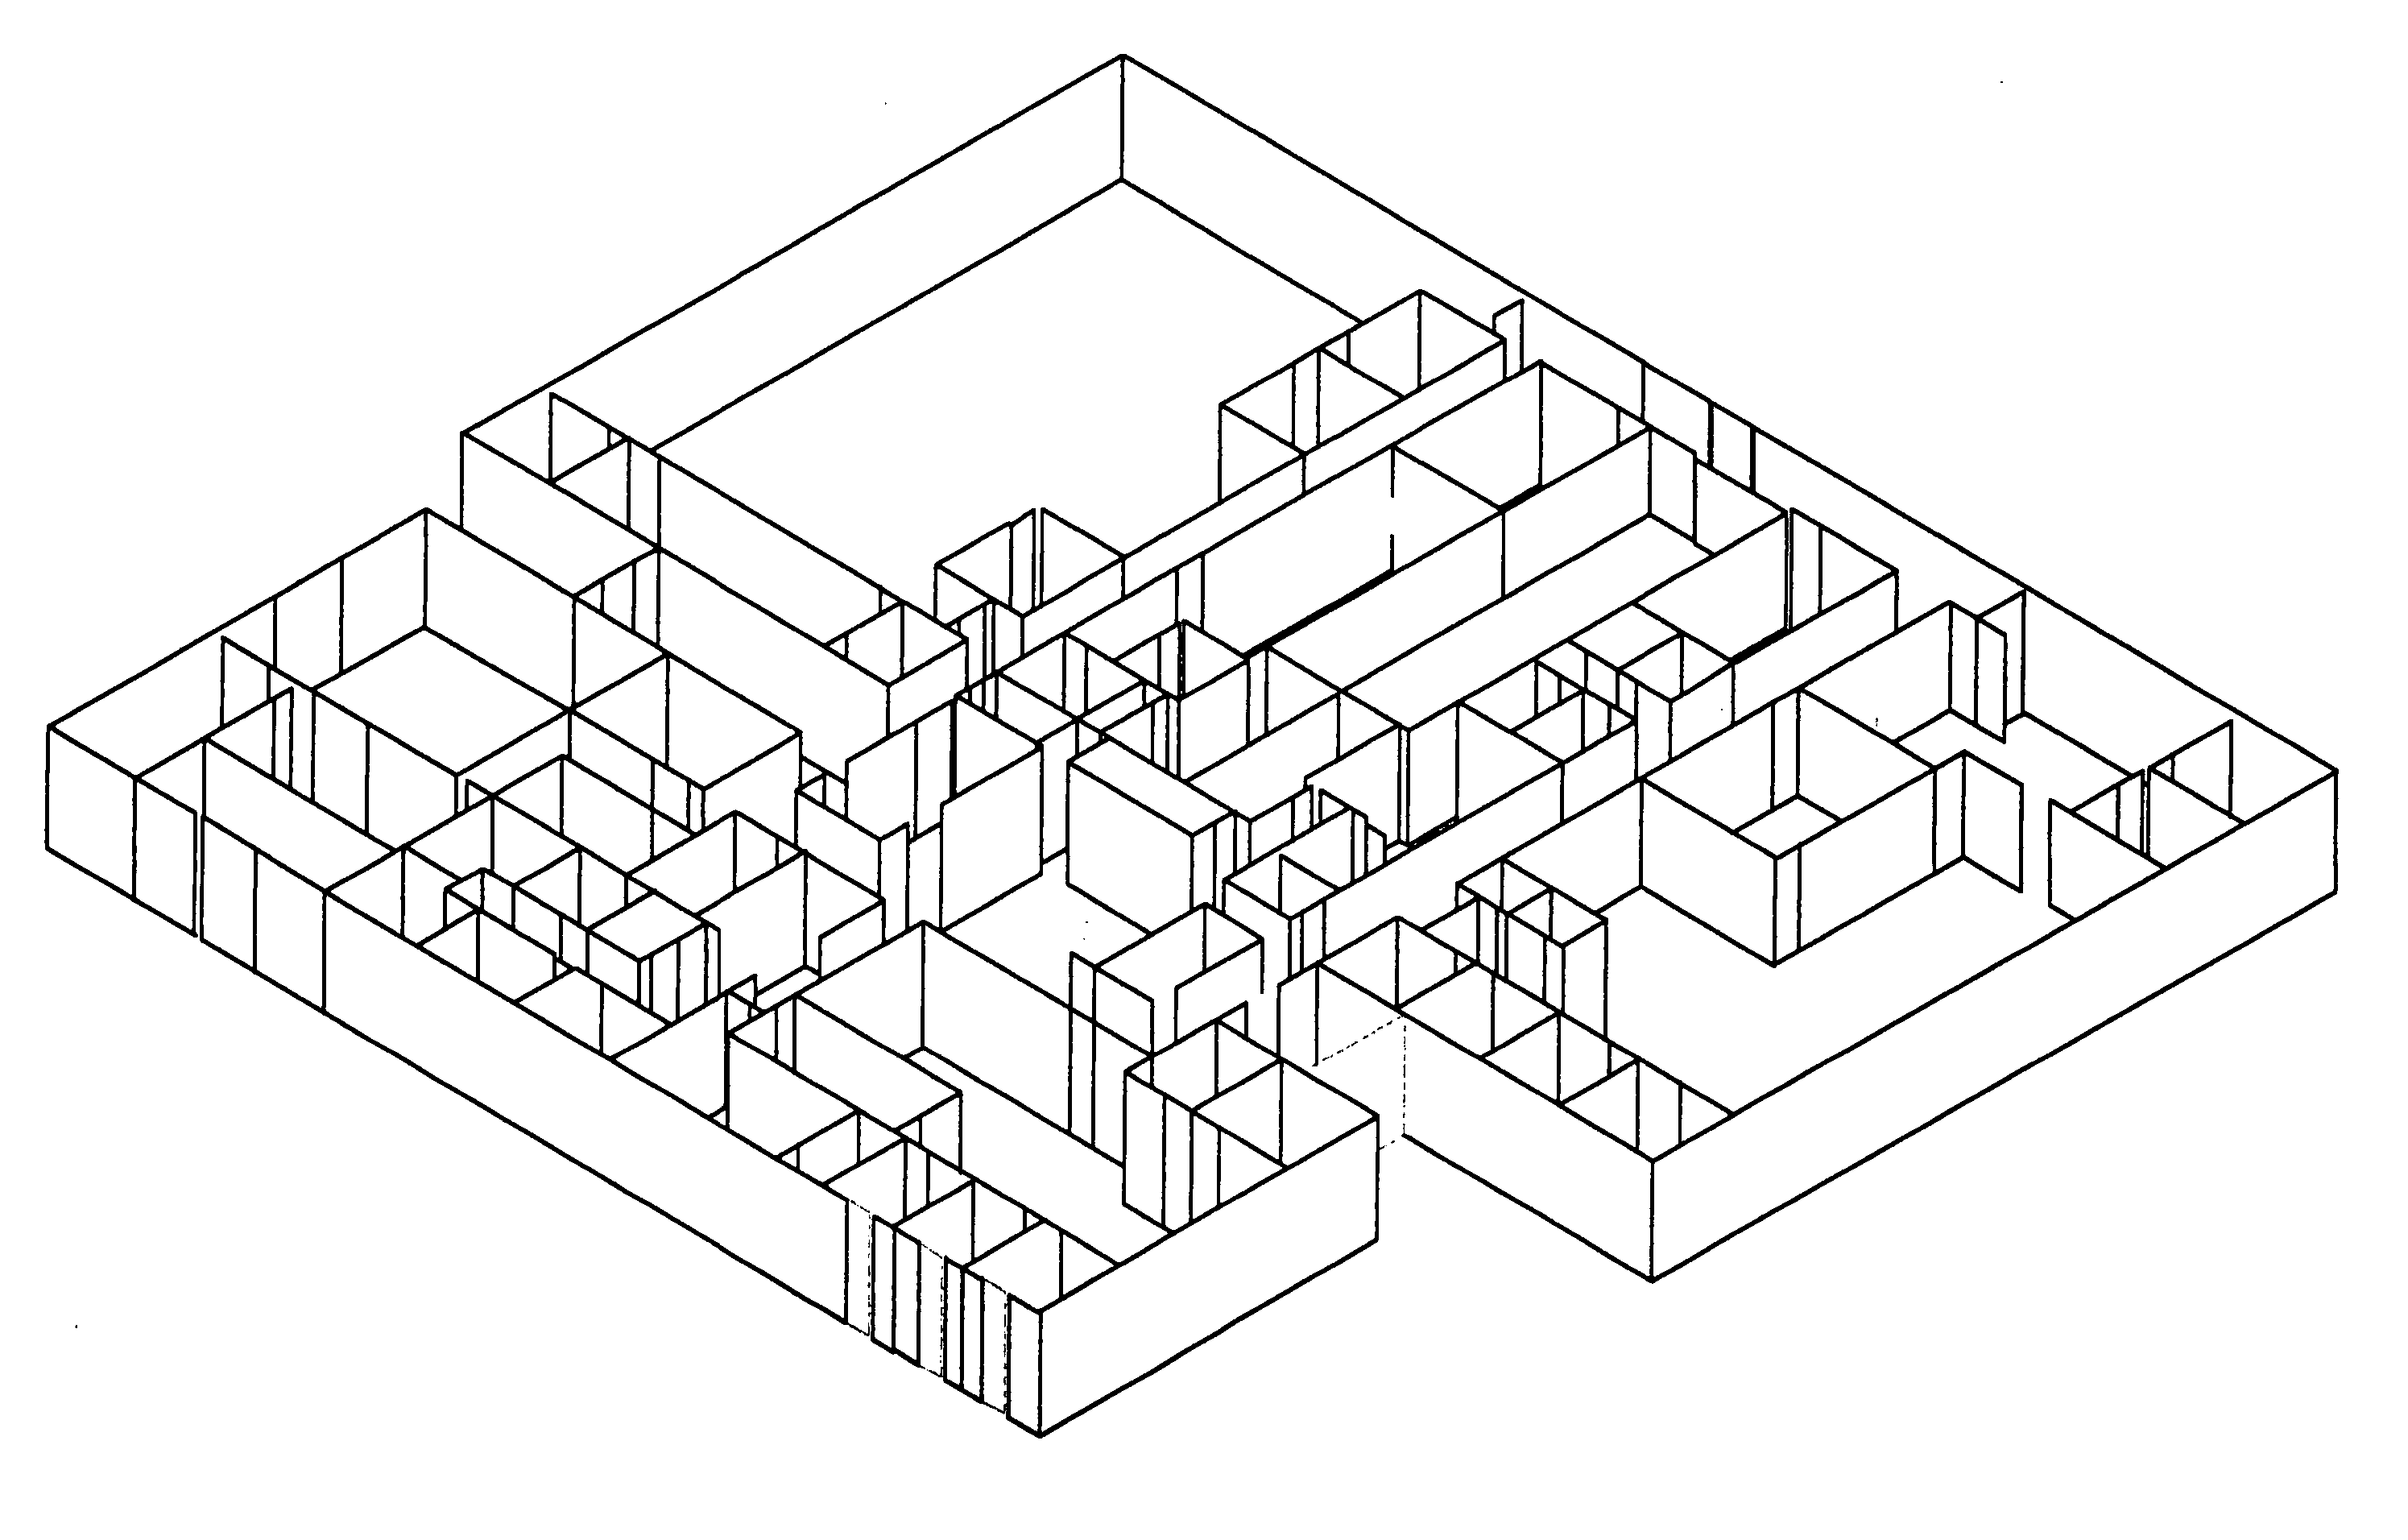
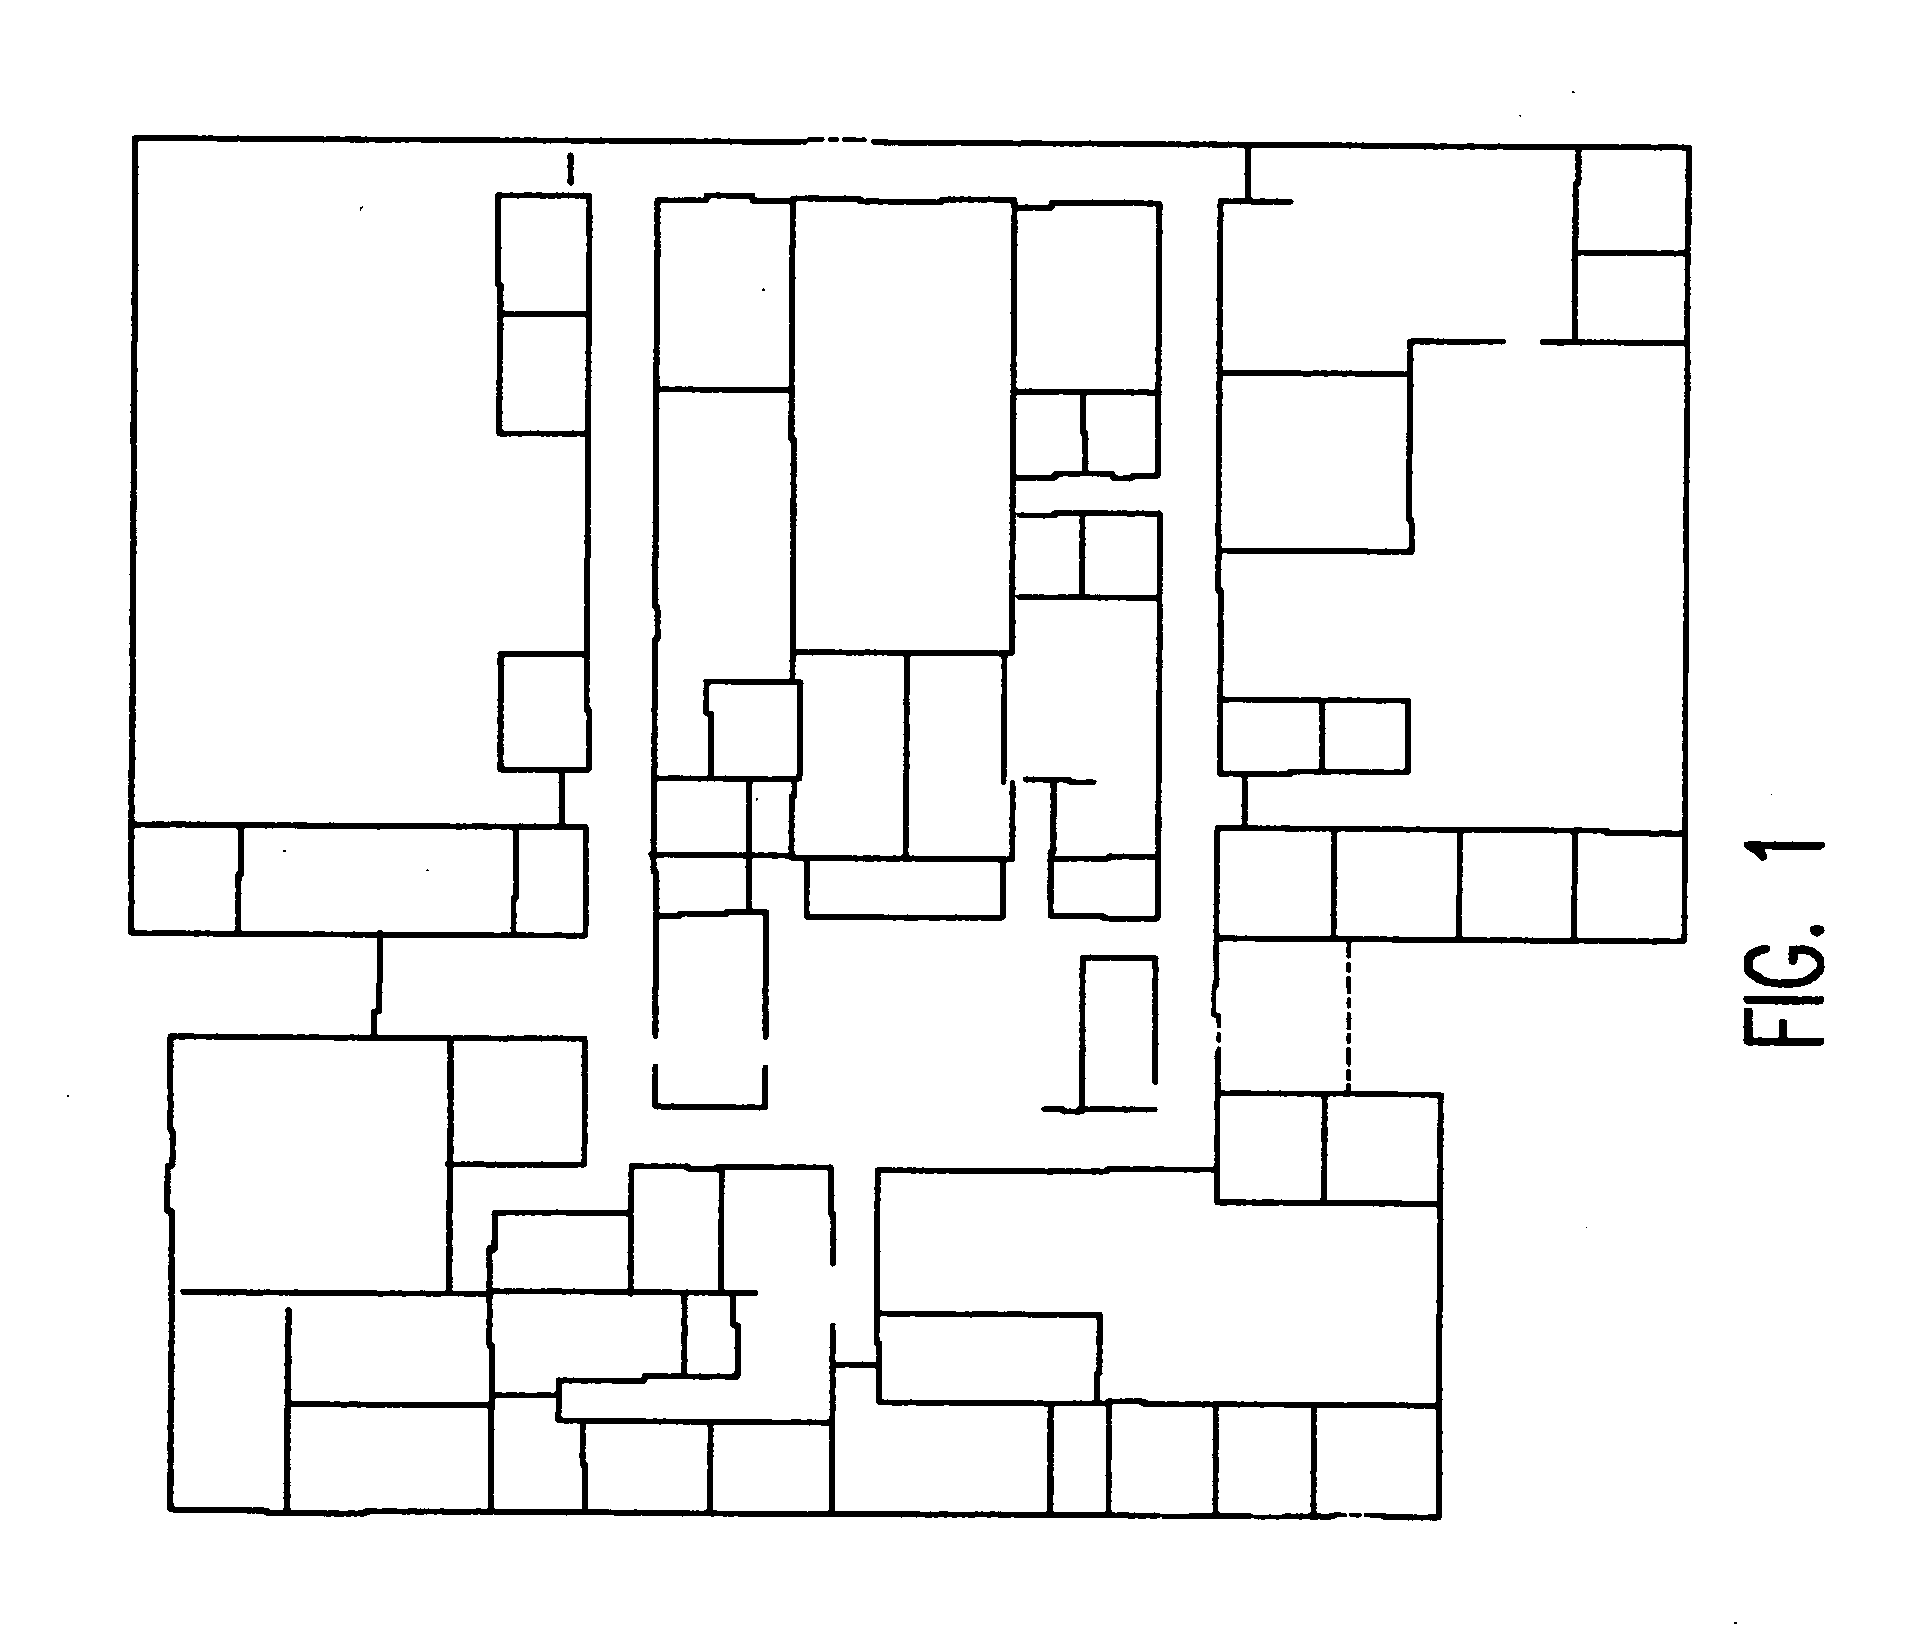
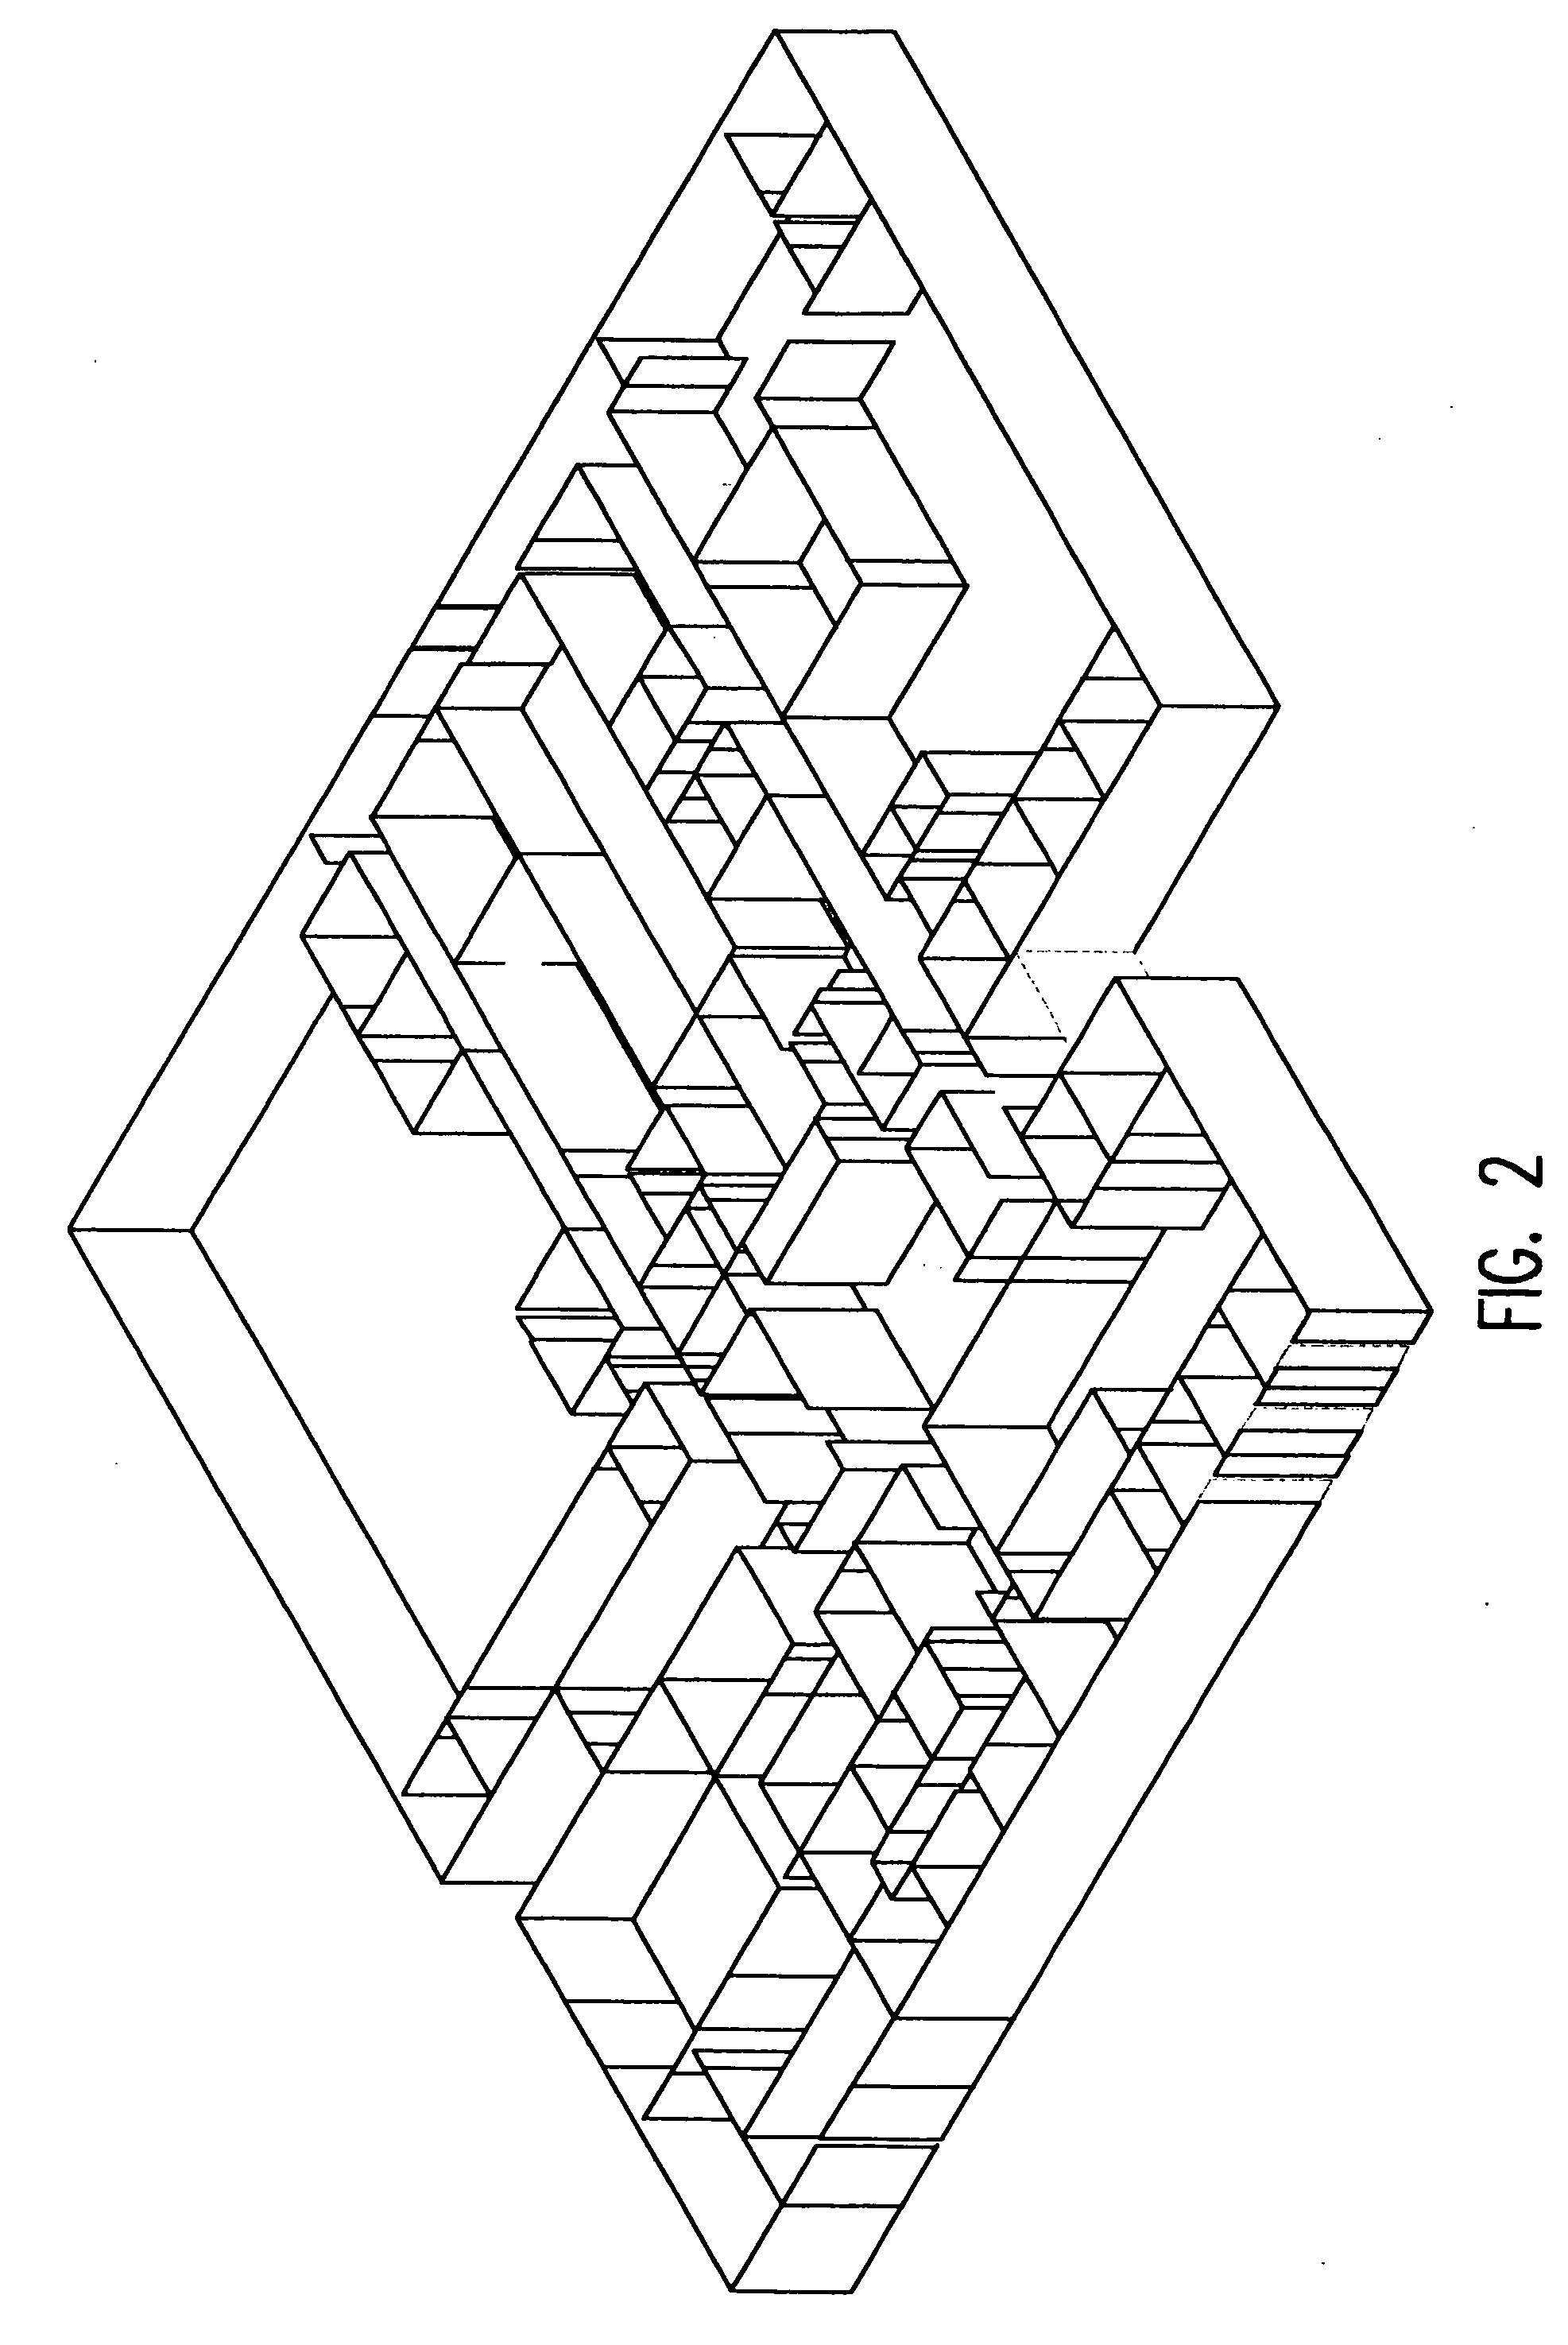
  • System and method for efficiently visualizing and comparing communication network system performance
  • System and method for efficiently visualizing and comparing communication network system performance
  • System and method for efficiently visualizing and comparing communication network system performance

Examples


Embodiment Construction

[0069] Using the present method, it is now possible to assess the performance of a communication system to a much higher level of precision than previously possible. The present method is a significant advance over the prior art in the display of predicted performance of communication systems. The design of communication systems is often a very complex and arduous task, with a considerable amount of effort required to simply analyze the results of system performance.

[0070] In the prior art, only a single performance prediction result could be analyzed at once. That is, having designed a communications system, there was no direct way to quickly visualize and compare advantages between having a hardware component in one communications network layout or another. In the present invention, a system is described where two or more predictions may be compared to analyze advantages or disadvantages between designs, models, or other factors.

[0071] The present invention also allows for a mea...


PUM


Abstract

A method for visualizing and efficiently making comparisons of communication system performance utilizing predicted performance, measured performance, or other performance data sets is described. A system permits visualizing the comparisons of system performance data in three-dimensions using fluctuating elevation, shape, and/or color within a three-dimensional computer drawing database consisting of one or more multi-level buildings, terrain, flora, and additional static and dynamic obstacles (e.g., automobiles, people, filing cabinets, etc.). The method enables a design engineer to visually compare the performance of wireless communication systems as a three-dimensional region of fluctuating elevation, color, or other aesthetic characteristics with fully selectable display parameters, overlaid with the three-dimensional site-specific computer model for which the design was carried out.

Description

CROSS-REFERENCE TO RELATED APPLICATIONS [0001] This application is related to the co-pending U.S. patent application Ser. No. 09 / 352,679 filed Jul. 14, 1999; Ser. No. 09 / 318,840 filed May 26, 1999; Ser. No. 09 / 318,841 filed May 26, 1999; Ser. No. 09 / 221,985 filed Dec. 29, 1998, and Ser. No. 09 / 318,842 filed May 26, 1999; and is also related to the concurrently filed applications having U.S. Ser. No. ______, entitled “Method and System for Designing and Deploying a Communications Network which Considers Frequency Dependent Effects”; and Ser. No. ______, entitled “Method and System for Designing a Communications Network which Considers Component Attributes” and Ser. No. ______, entitled “Method and System for Designing a Communications Network which Allows the Simultaneous Selection of Multiple Components”, all of which are assigned to a common assignee, and the subject matter of these applications is incorporated herein by reference.BACKGROUND OF THE INVENTION [0002] 1. Field of the ...

Claims


Application Information

Patent Timeline
IPC IPC(8): G06T19/00G06F17/50H04B17/00H04L12/24H04L12/56H04W16/18H04W16/20
CPCH04L41/22H04L41/5032H04B17/3913H04B17/23H04W16/20G06F30/00
Inventor RAPPAPORT, THEODORESKIDMORE, ROGERGOLD, BRIAN
Owner EXTREME NETWORKS INC
Why Eureka
Try Eureka