Nonlinear modeling of gene networks from time series gene expression data

a gene expression and time series technology, applied in computing models, probabilistic networks, instruments, etc., can solve the problems of many genes, difficult to understand the cause and effect relationships of genes in such studies, and independent regulation

Inactive Publication Date: 2005-03-10
GNI CO LTD
View PDF3 Cites 10 Cited by
  • Summary
  • Abstract
  • Description
  • Claims
  • Application Information

AI Technical Summary

Problems solved by technology

However, in biological organisms genes rarely are independently regulated by any such intervention, in that many genes can be affected by a particular intervention.
Because a large number of different genes may be so affected, understanding the cause and effect relationships between genes in such studies is very difficult.
Thus, much effort is being expended to develop methods for determining cause and effect relationships between genes, which genes are central to a biological phenomenon, and which genes' expression(s) are peripheral to the biological process under study.
Although such peripheral gene's expression maybe useful as a marker of a biological or pathoph

Method used


Image

  • Nonlinear modeling of gene networks from time series gene expression data
  • Nonlinear modeling of gene networks from time series gene expression data
  • Nonlinear modeling of gene networks from time series gene expression data

Examples


example 1

Bayesian Network and Nonparametric Regression

Suppose that we have an n×p microarray gene expression data matrix X, where n and p are the numbers of microarrays and genes, respectively. Usually, the number of genes p is much larger than the number of microarrays, n. In the estimation of a gene network based on the Bayesian network, a gene is considered as a random variable. When we model a gene network by using statistical models described by the density or probability function, the statistical model should include p random variables. However, we have only n samples and n is usually much smaller than p. In such case, the inference of the model is quite difficult or impossible, because the model has many parameters and the number of samples is not enough for estimating the parameters. The Bayesian network model has been advocated in such modeling.

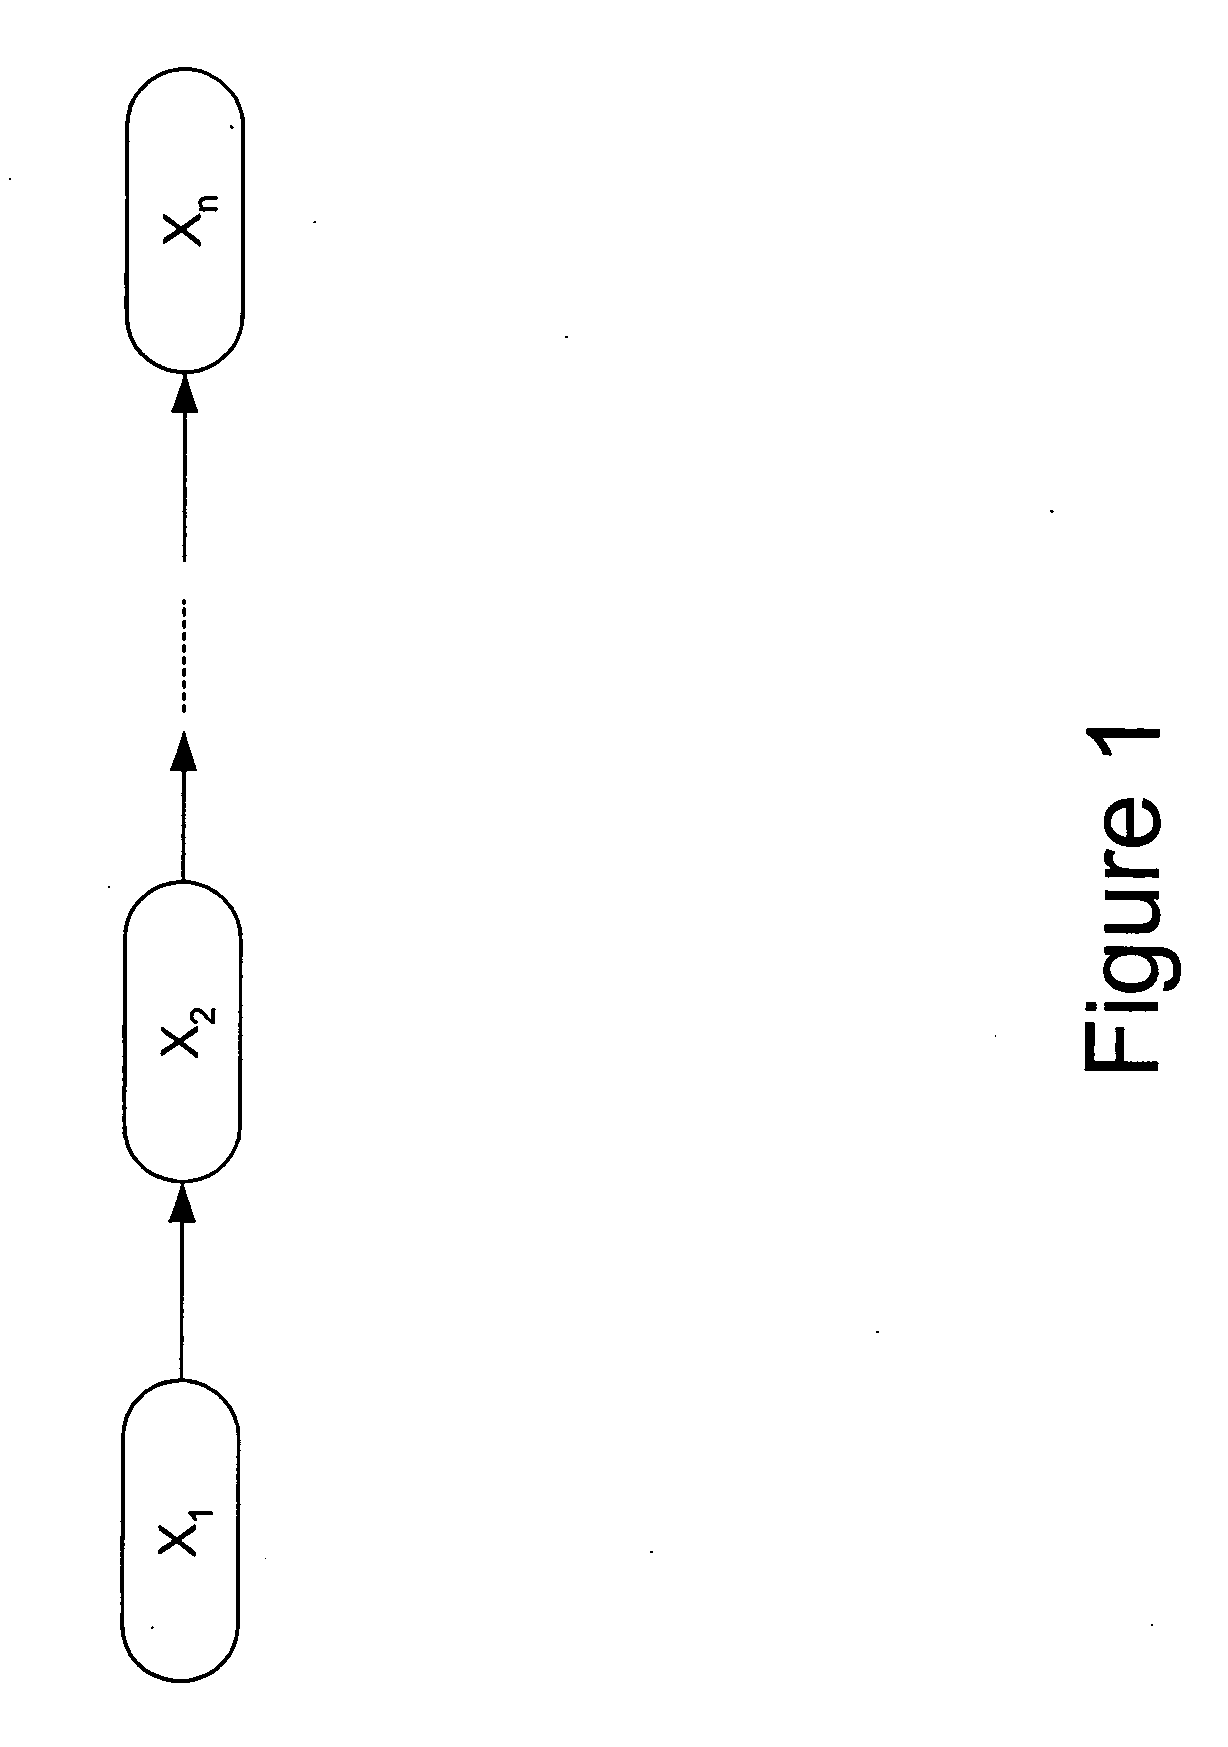
In the context of the dynamic Bayesian network, we consider the time series data and the ith column vector xi of X corresponds to the st...

example 2

Derivation of a Criterion for Selecting a Network

The dynamic Bayesian network and nonparametric regression model introduced in the previous section can be constructed when we fic the network structure and estimated by a suitable procedure. However, the gene network is generally unknown and we should estimate an optimal network based on the data. This problem can be viewed as a statistical model selection problem (see e.g., Akaike [1]; Konishi and Kitagawa [17]; Burnham and Anderson [4]; Konishi [16]). We solve this problem from the Bayesian statistical approach and derive a criterion for evaluating the goodness of the dynamic Bayesian network and nonparametric regression model.

Let π(θG|λ) be a prior distribution on the parameter θG in the dynamic Bayesian network and nonparametric regression model and let log π(θG|λ)=O(n). The marginal likelihood can be represented as

∫f(x11, . . . , xnp; θG)π(θG|λ)dθG.

Thus, when the data is given, the posterior probability of the network G is...

example 3

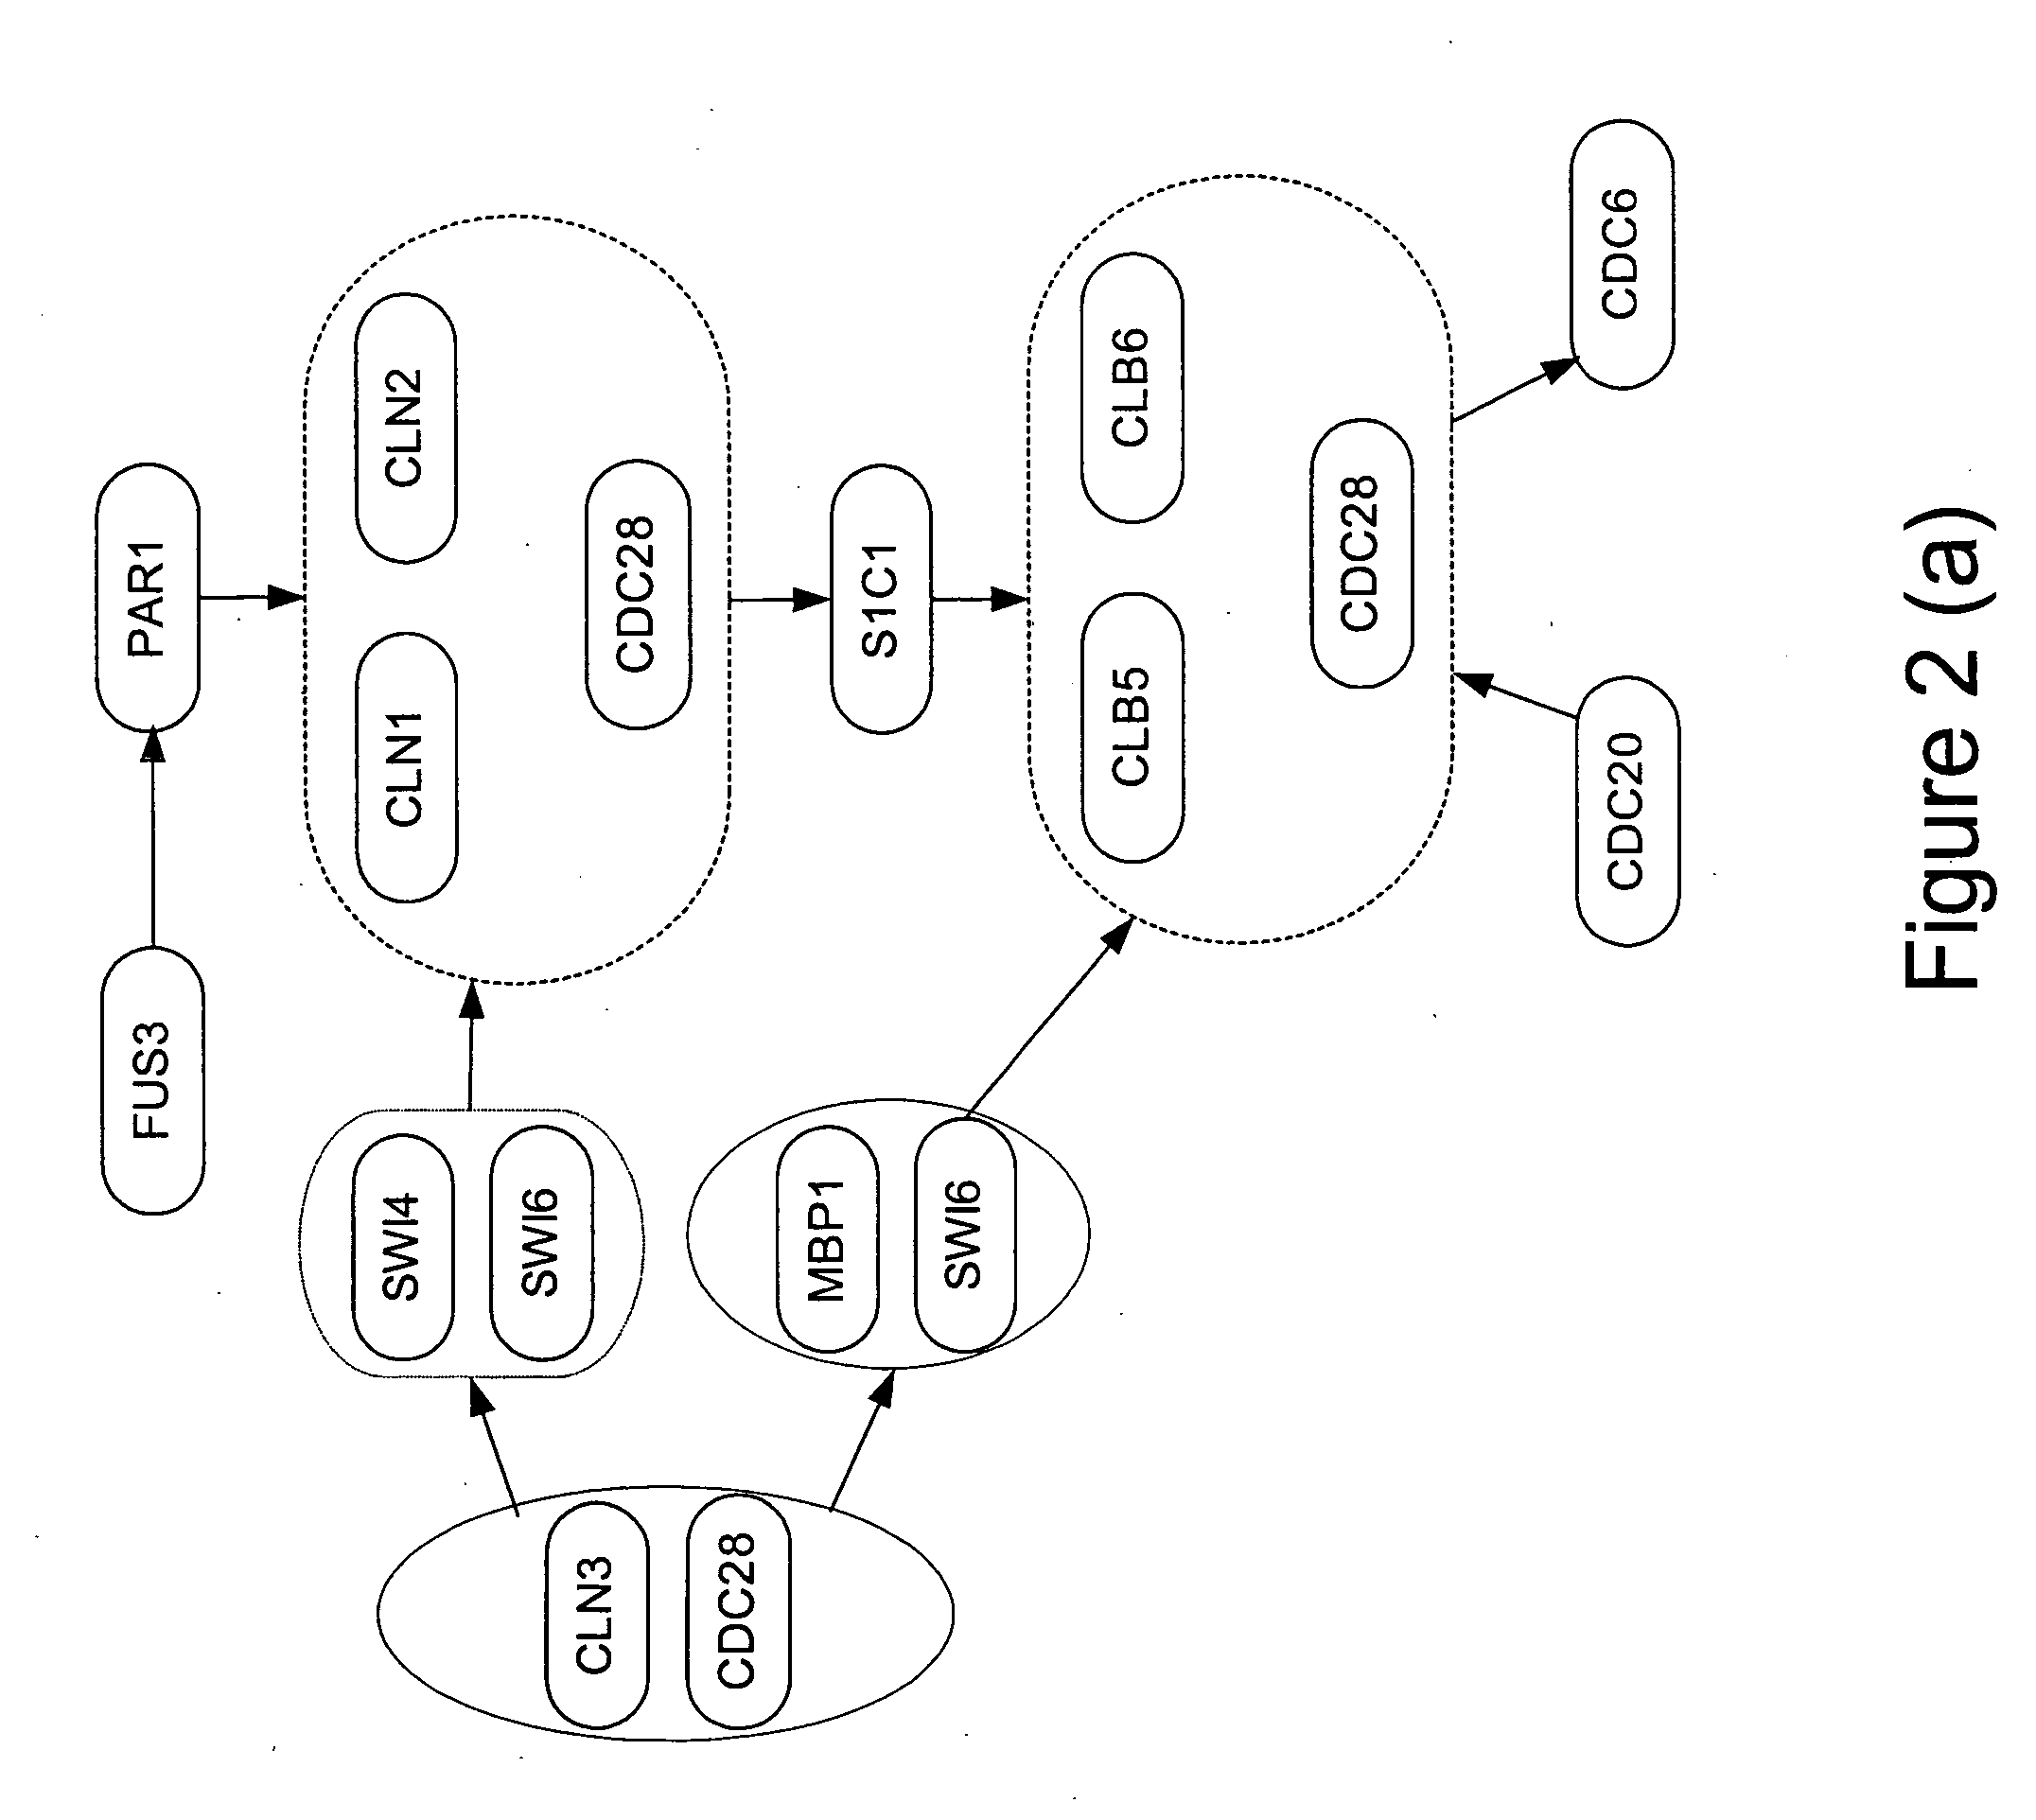
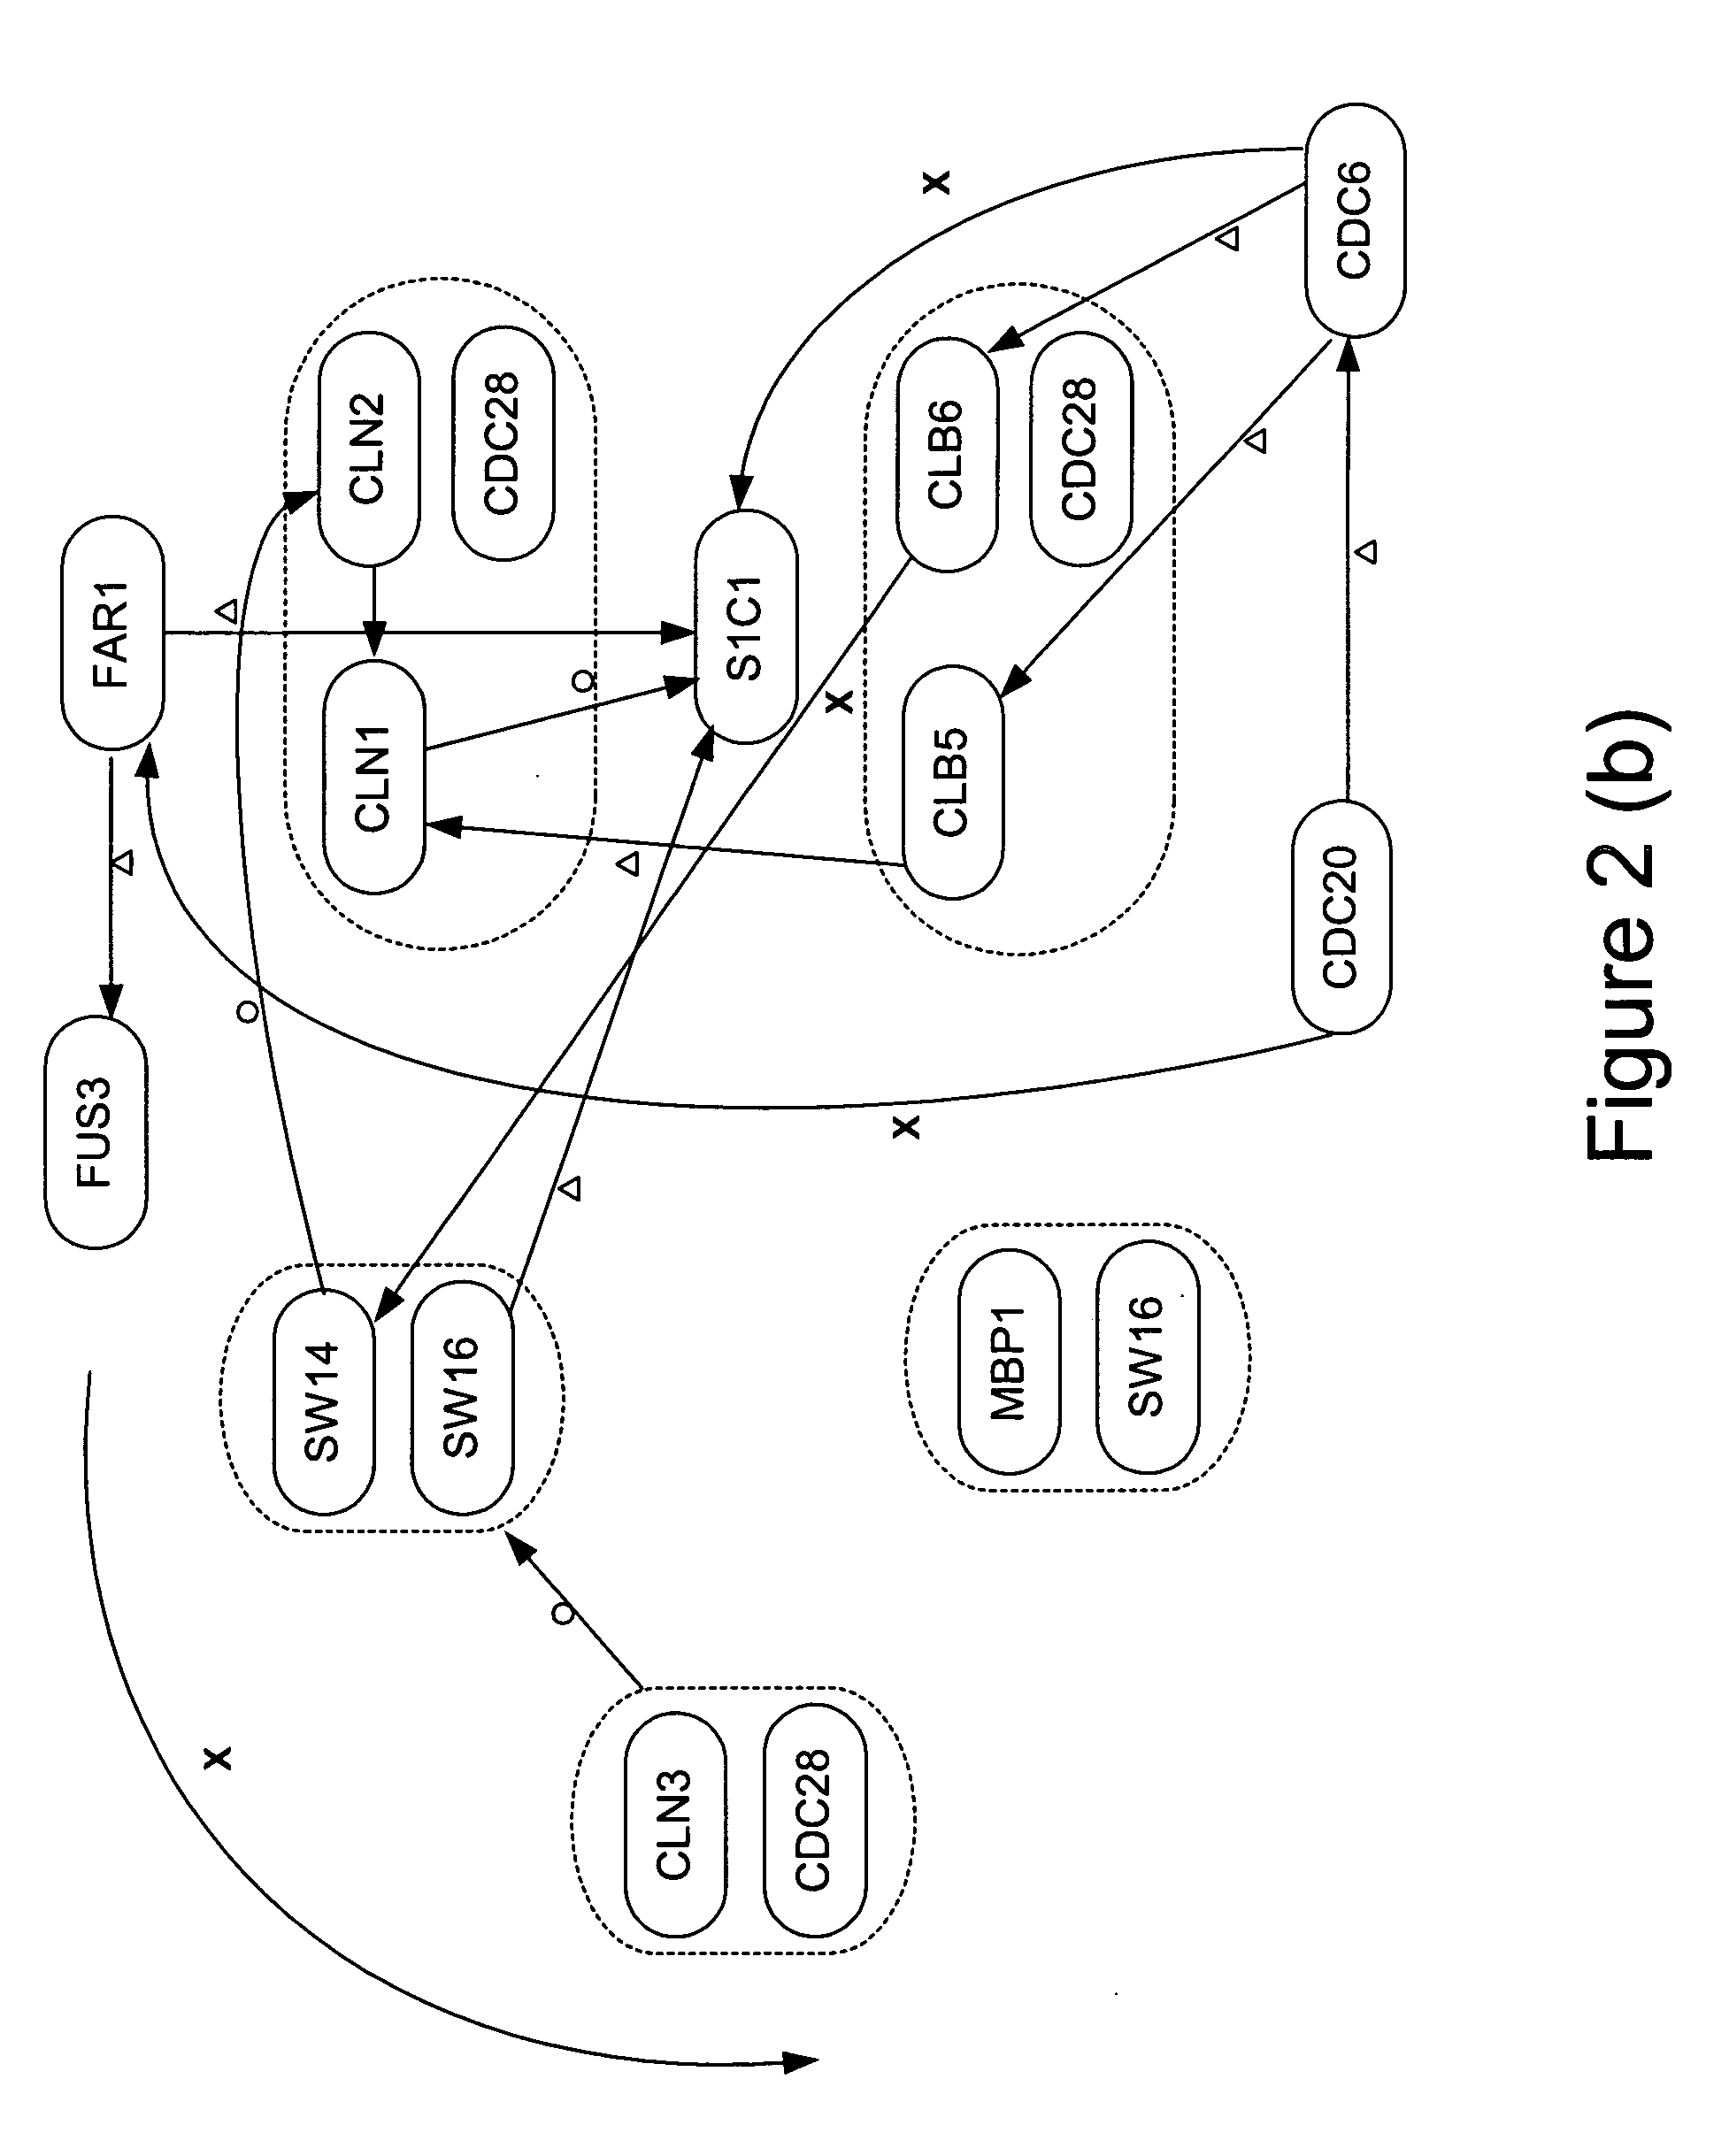
Estimation of a Gene Network

In this section, we show a concrete strategy for estimating a gene network from cDNA microarray time series gene expression data.

3.1 Nonparametric Regression

We use the basis function approach for constructing the smooth function mjk(•) described in Section 2. In this paper we use B-splines (de Boor [7]) as the basis functions. De Boor's algorithm (de Boor [7], Chapter 10, p.130 (3)) is a useful method for computing B-splines of any degree. We use 20 B-splines with equidistance knots (see also, Dierckx [10]; Eiler and Marx [11] for the details of B-spline).

3.2 Prior Distribution on the Parameter in the Model

For the prior distribution on the parameter θG, suppose that the parameter vectors θj are independent one another, the prior distribution can then be decomposed as π(θG|λ)=Πj=1pπj(θj|λj). Suppose that the prior distribution πj(θj|λj) is factorized as πj(θj|λj)=Πl<1qjπjk(γjk|λjk), where λjk are hyper parameters. We use a singular Mjk variate...


PUM


Abstract

Embodiments of this invention include application of new inferential methods to analysis of complex biological information, including gene networks. In some embodiments, time course data obtained simultaneously for a number of genes in an organism. New methods include modifications of Bayesian inferential methods and application of those methods to determining cause and effect relationships between expressed genes, and in some embodiments, for determining upstream effectors of regulated genes. Additional modifications of Bayesian methods include use of time course data to infer causal relationships between expressed genes. Other embodiments include the use of bootstrapping methods and determination of edge effects to more accurately provide network information between expressed genes. Information about gene networks can be stored in a memory device and can be transmitted to an output device, or can be transmitted to remote location.

Description

FIELD OF THE INVENTION This invention relates to the use of Bayesian models with nonparametric regression to infer network relationships between genes from time series studies of gene expression. In particular, the invention relates to methods involving minimizing a criterion, BNRCdynamic to infer optimal network relationships. BACKGROUND One of the most important aspects of current research and development in the life sciences, medicine, drug discovery and development and pharmaceutical industries is the need to develop methods and devices for interpreting large amounts of raw data and drawing conclusions based on such data. Bioinformatics has contributed substantially to the understanding of systems biology and promises to produce even greater understanding of the complex relationships between components of living systems. In particular, with the advent of new methods for rapidly detecting expressed genes and for quantifying expression of genes, bioinformatics can be used to pre...

Claims


Application Information

Patent Timeline
IPC IPC(8): G01N33/48G01N33/50G06F19/00G06N5/04G06N7/00G16B5/20G16B25/10G16B40/00
CPCG06F19/12G06N7/005G06F19/24G06F19/20G16B5/00G16B25/00G16B40/00G16B5/20G16B25/10G06N7/01
Inventor MIYANO, SATORUIMOTO, SEIYAKIM, SUN YONG
Owner GNI CO LTD
Why Eureka
Try Eureka