
Method of detecting and monitoring fabric congestion

a data storage network and fabric congestion technology, applied in the field of automatic methods and systems for monitoring and managing data storage networks, can solve the problems of backpressure congestion, major disruptions to user operations in data storage networks, fabric congestion, etc., and achieve the effect of effectively separating congestion points

Inactive Publication Date: 2005-05-19
MCDATA CORP
View PDF17 Cites 388 Cited by
  • Summary
  • Abstract
  • Description
  • Claims
  • Application Information

AI Technical Summary

Benefits of technology

[0018] Some observers have asserted that increasing the BB_Credit limit to a higher value (for example, 60 in the illustrated switch architecture) would help alleviate the problem, but unfortunately, it only delays the onset of the condition somewhat. The difference between 16 and 60 is 44, and at 10 ms per full-length frame at 2 Gbps or 20 ms per full-length frame at 1 Gbps, the problem would arise 440 ms later or 880 ms later, respectively. However, the switch would then hold each frame for a longer period of time increasing the chances that more frames would be timed out in this scenario. As can be seen in FC switch architecture, flow control is based on link credits and frames are not normally discarded. As a result, if TX BB_Credits are unavailable to transmit on a link, data backs up in receive ports. Further, since this backing up of data cannot be acknowledged to the remote sending port with an R_RDY, data rapidly backs up in many remote sending ports that do not recognize the congestion problems and the cycle continues to be repeated, which increases the congestion.
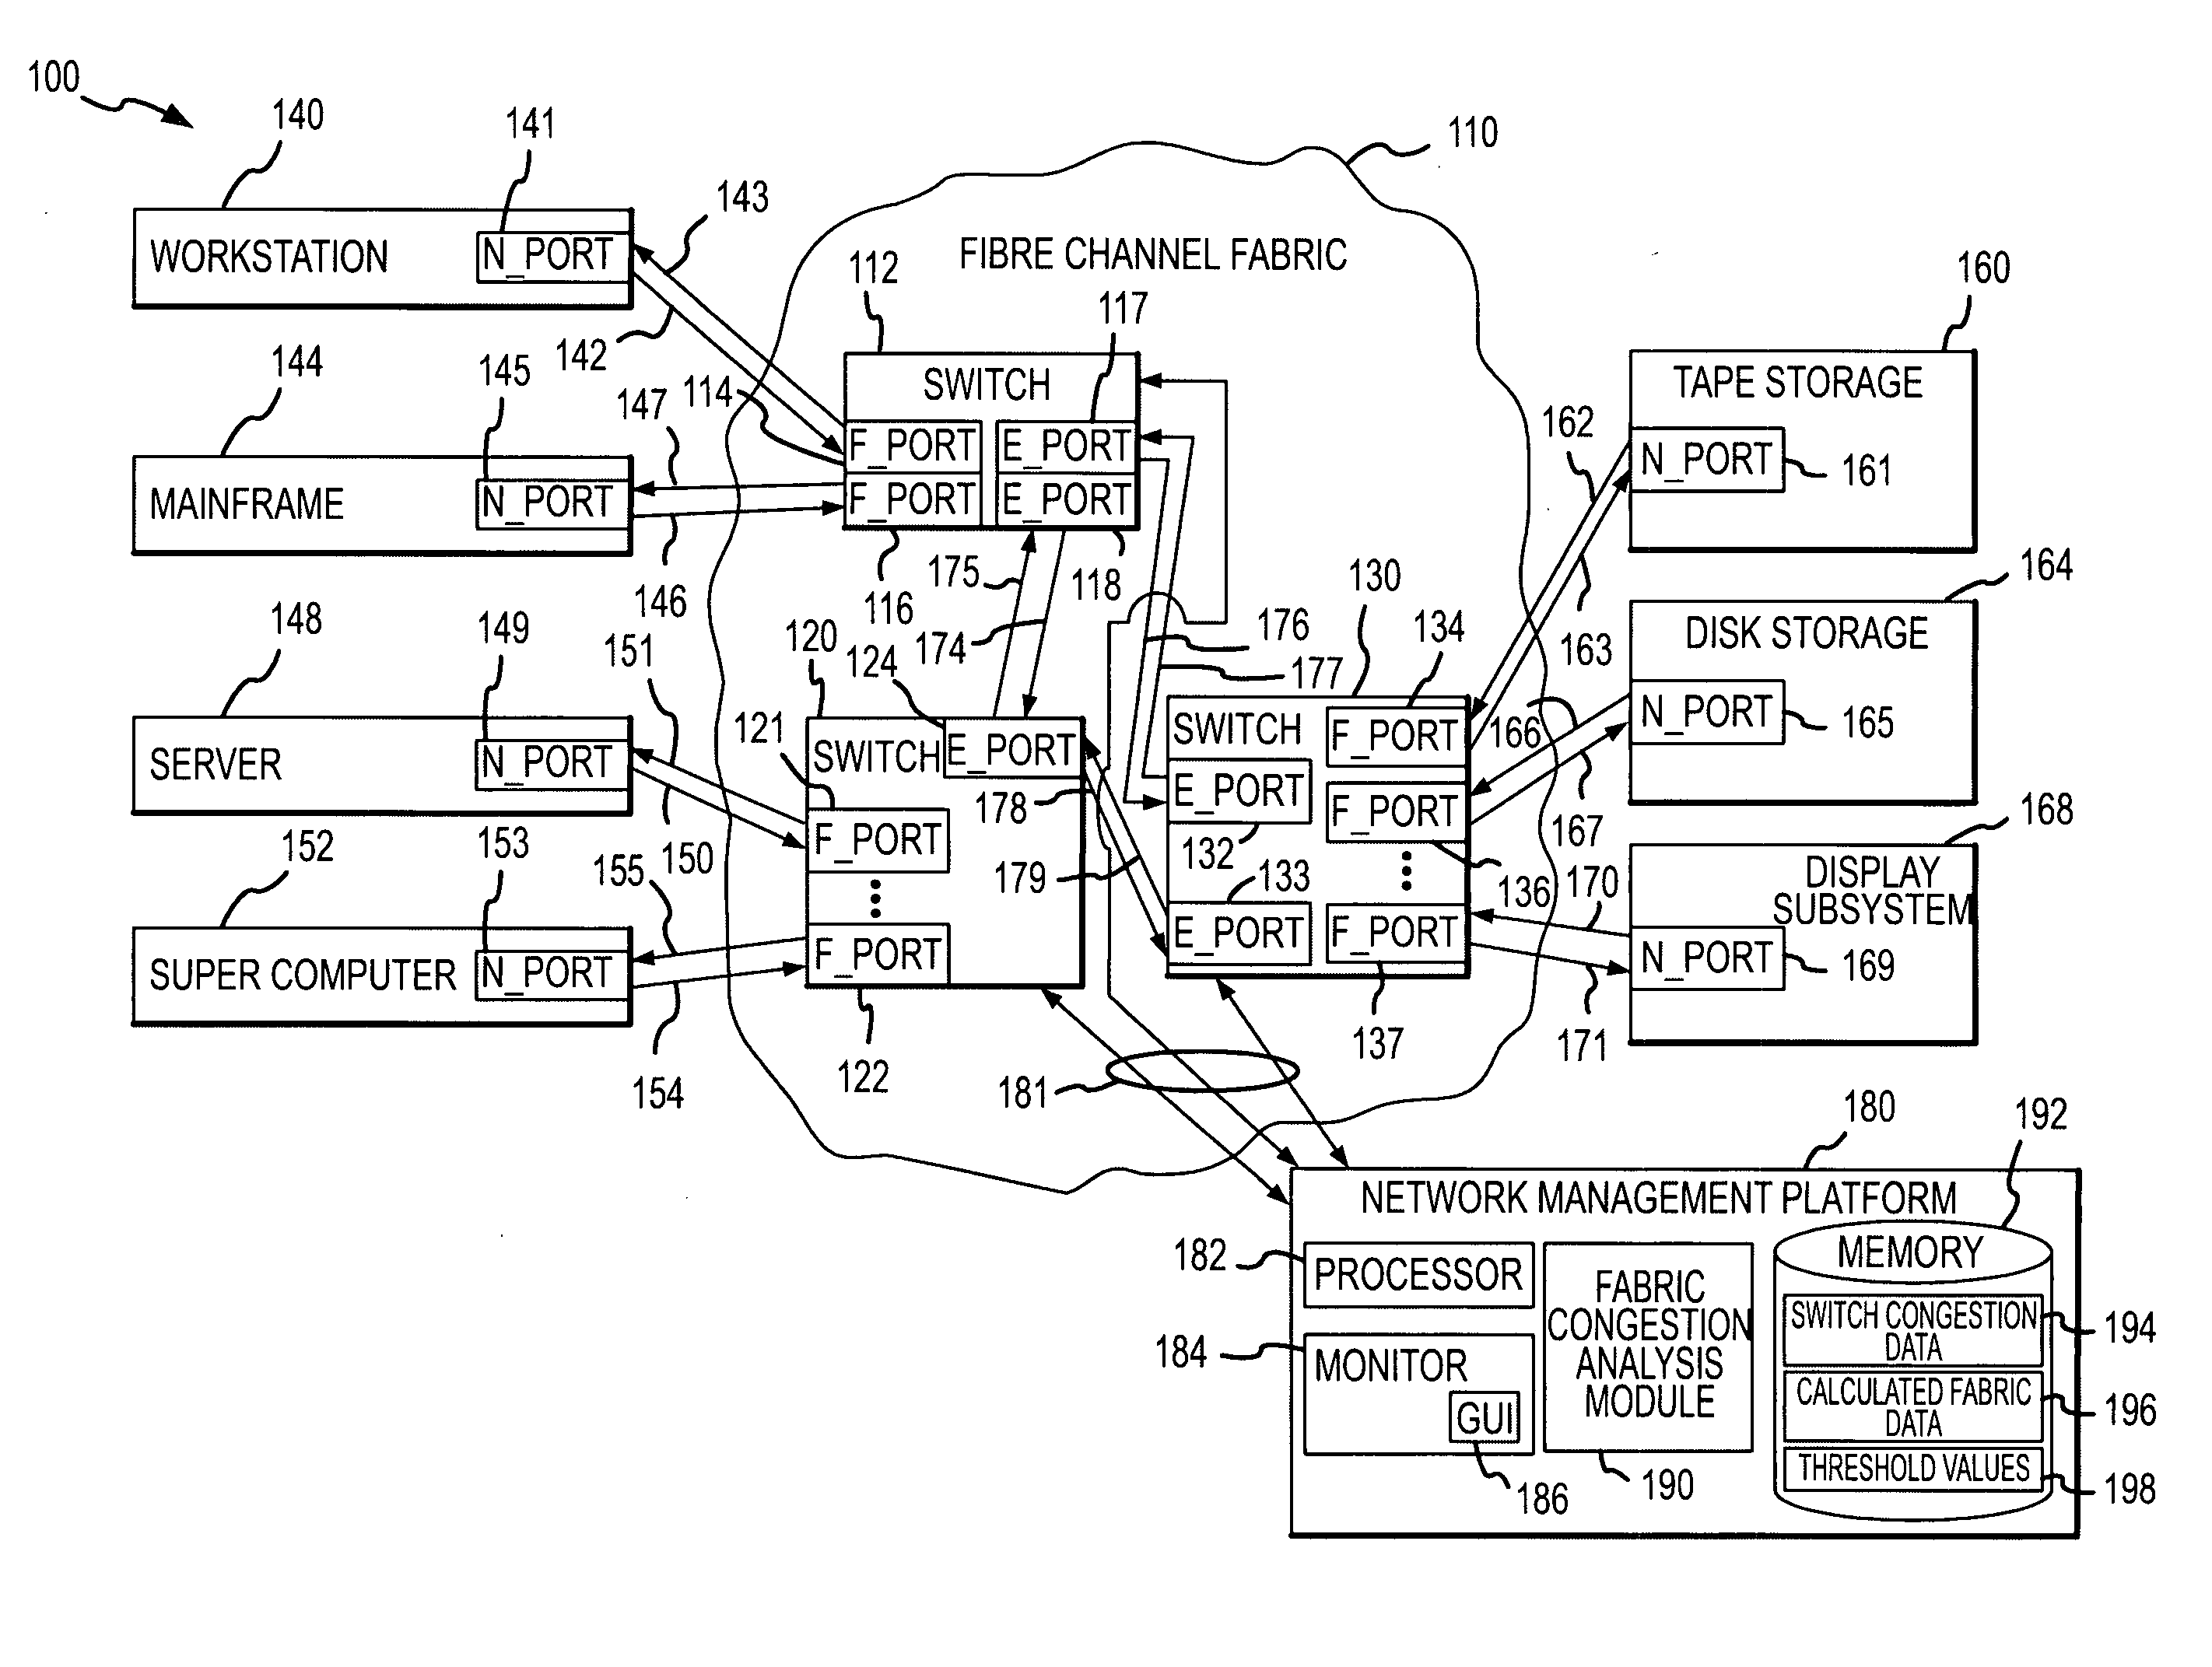
[0020] At the fabric level, a fabric congestion analysis module may also be provided on a network management platform, such as a server or other network device linked to the switches in the fabric or network. The fabric module and / or other platform devices act to store and maintain a central repository of port-specific congestion management status and data received from switches in the fabric. The fabric module also functions to calculate changes or a delta in the congestion status or states of the ports, links, and devices in the fabric over a monitoring or detection period. In this manner, the fabric module is able to determine and report a fabric centric congestion view by extrapolating and / or processing the port-specific history and data and other fabric information, e.g., active zone set data members, routing information across switch back planes (e.g., intra-switch) and between switches (e.g., inter-switch), and the like, to effectively isolate congestion points and likely sources of congestion in the fabric and / or network. In some embodiments, the fabric module further acts to monitor fabric congestion status over time, to generate a congestion display for the fabric to visually report congestion points, congestion levels, and congestion types (or to otherwise provide user notification of fabric congestion), and / or to manage congestion in the fabric such as by issuing commands to one or more of the fabric switches to control traffic flow in the fabric.

Problems solved by technology

Fabric congestion is one of the major sources of disruption to user operations in data storage networks.
Briefly, a resource limited congestion node is a point within the fabric or at the edge of the fabric that cannot keep up with maximum line rate processing for an extended period of time due to insufficient resource allocation at the node.
Backpressure congestion is a form of second stage congestion often occurring when a link can no longer be used to send frames as a result of being attached to a “slow draining device” or because there is another congested link, port, or device downstream of the link, port, or device.
A link that spends significant time with 0 TX or RX BB_Credit is likely experiencing congestion.
In resource-limited congestion, the RX Port slowly processes the RX Buffers and returns R_RDYs, causing the TX Port to spend significant time waiting for a free buffer resource, lowering overall throughput.
Additionally, each frame in the RX Port queue can spend significant time waiting for attention from the slow device.

Method used


Image

  • Method of detecting and monitoring fabric congestion
  • Method of detecting and monitoring fabric congestion
  • Method of detecting and monitoring fabric congestion

Examples


example 1

Congestion Statistics Calculations

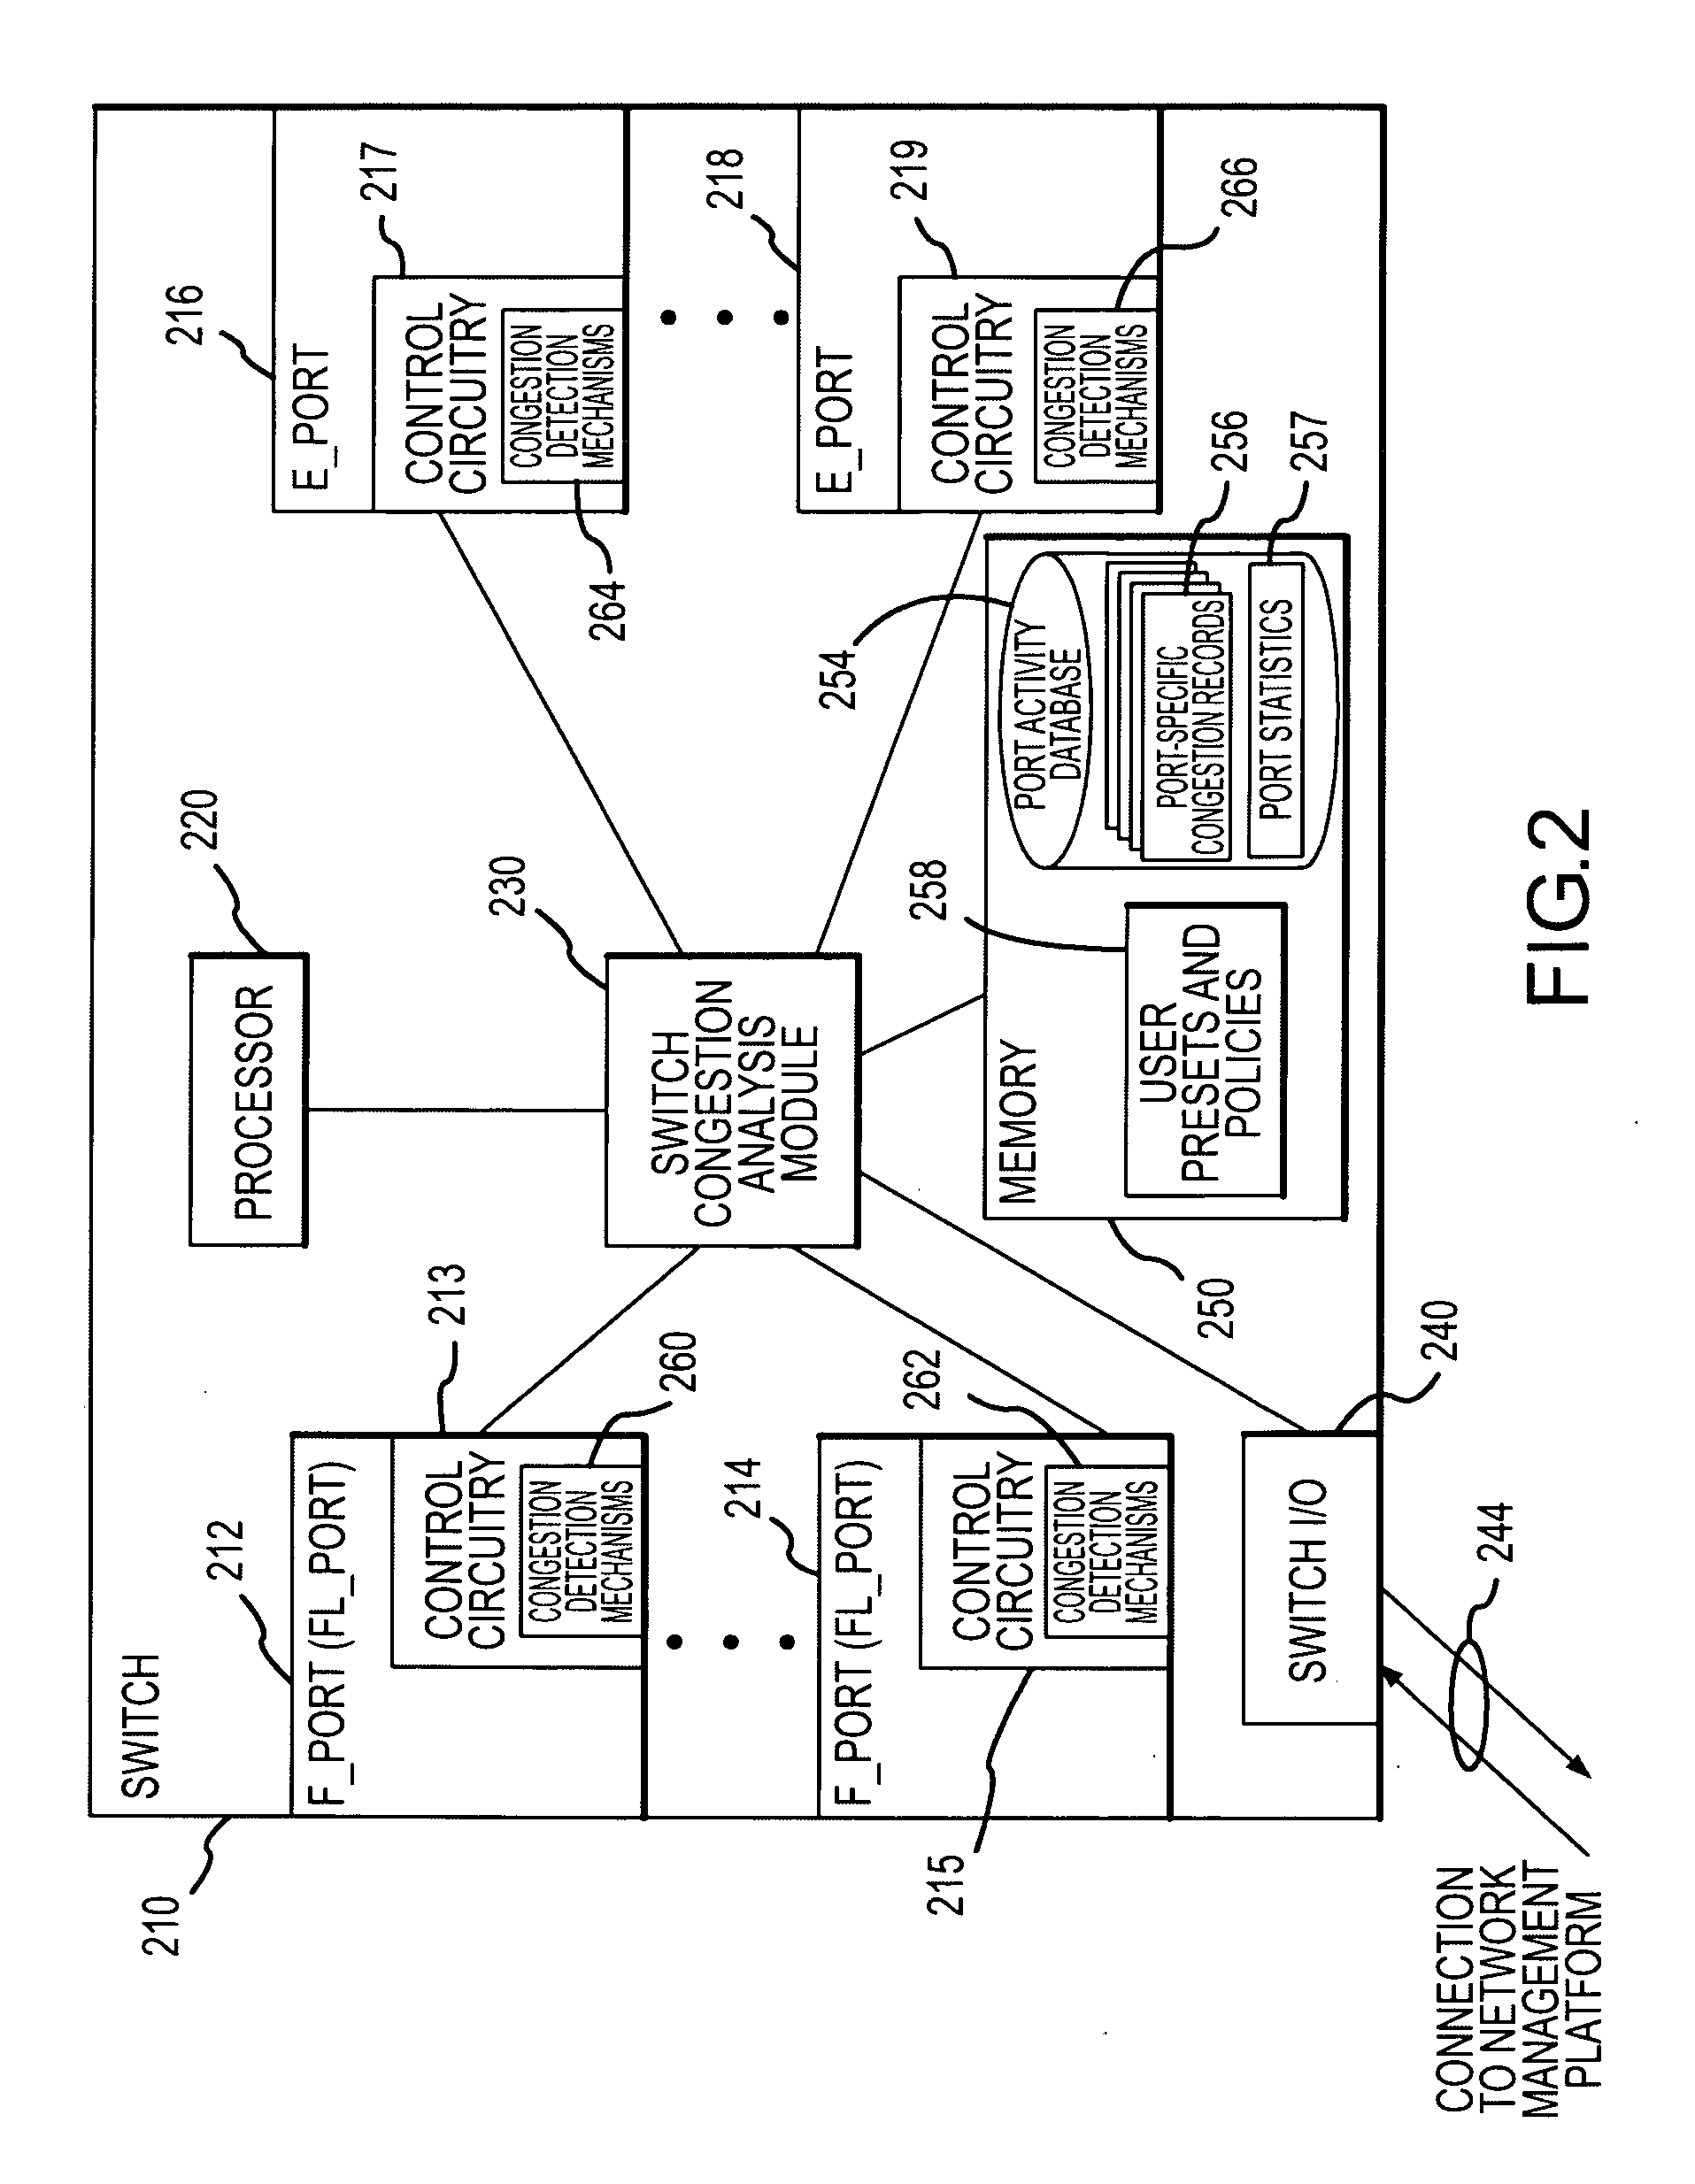
[0085] The congestion management statistics are calculated by the switch module 230 once every “congestion management period” (by default, once per second) for each active port in the switch. Every period, the switch module 230 examines a set of statistics per port to determine if that port is showing any signs of congestion. If the gathered statistics meet the qualifications used to define congestion behavior, then the associated congestion management statistic is incremented for that port. If RX backpressure congestion is being detected by a port during a congestion management period, a second pass of gathering data is performed to help isolate the likely causes of the congestion with respect to the local switch.

[0086] When the switch module 230 is invoked, it collects the following statistics from the congestion detection mechanisms in the port control circuitry: (1) RX utilization percentage of 21 percent; (2) TX utilization percentage of 88 p...

example 2

Congestion Management Counter Threshold Alerts

[0088] Congestion Threshold Alerts (CTAs) are used in some cases by the switch congestion analysis module 230 to provide notification to management access points when a statistical counter in the congestion management statistical set 256 in the PAD 254 on the switch has exceeded a user-configurable threshold 258 over a set duration of time. A CTA may be configured by a user with the following exemplary values: (1) Port List / Port Type set at “All F_Ports”; (2) CTA Counter set at “TX Over-subscribed Periods”; (3) Increment Value set at “40”; and (4) Interval Time set at “10 minutes”. Thus, if the TX Over-subscribed period counter is incremented in the PAD entry for any F_Port 40 times or more within any 10 minute period then user notification is sent by the module 230 to the associated management interfaces.

example 3

Fabric Management and Congestion Source Isolation

[0089] In order to accurately depict a congested fabric view, the fabric congestion analysis module 190 on the management platform 180 keeps an accurate count of the changes in congestion management statistics over a set period of time for each port on the fabric. The module 190 also provides one or more threshold levels for each configuration statistic across the interval history time. These levels may be binary (e.g., congested / uncongested) or may be tiered (e.g., high, medium, or light (or no) congestion). For illustration purposes, Table 6 presents a model of an illustrative congestion management statistic threshold level table that may reside in memory 192 at 196 or elsewhere that is accessible by the fabric module 190.

TABLE 6Congestion Threshold LimitsThreshold Level(for 5 minute period -300 congestion periods)Port's RelationshipStatistical CounterMediumHighto Congestion SourceActionRXOversubscribedPeriod100200Congestion Sour...


PUM


Abstract

A system for detecting, monitoring, reporting, and managing congestion in a fabric at the port and fabric levels. The system includes multi-port switches in the fabric with port controllers that collect port traffic statistics. A congestion analysis module in the switch periodically gathers port statistics and processes the statistics to identify backpressure congestion, resource limited congestion, and over-subscription congestion at the ports. A port activity database is maintained at the switch with an entry for each port and contains counters for the types of congestion. The counters for ports that are identified as congested are incremented to reflect the detected congestion. The system includes a management platform that periodically requests copies of the port congestion data from the switches in the fabric. The switch data is aggregated to determine fabric congestion including the congestion level and type for each port and congestion sources.

Description

BACKGROUND OF THE INVENTION [0001] 1. Field of the Invention [0002] The present invention relates generally to methods and systems for monitoring and managing data storage networks, and more particularly, to an automated method and system for identifying, reporting, and monitoring congestion in a data storage network, such as a Fibre Channel network or fabric, in a fabric-wide or network-wide manner. [0003] 2. Relevant Background [0004] For a growing number of companies, planning and managing data storage is critical to their day-to-day business. To perform their business and to serve customers requires ongoing access to data that is reliable and quick. Any downtime, or even delays in accessing data, can result in lost revenues and decreased productivity. Increasingly, these companies are utilizing data storage networks, such as storage area networks (SANs), to control data storage costs as these networks allow sharing of network components and infrastructure. [0005] Generally, a da...

Claims


Application Information

Patent Timeline
IPC IPC(8): G06FG06F3/00H04L12/24H04L12/26
CPCH04L12/2602H04L41/0853H04L41/0893H04L41/22H04L43/00H04L43/022H04L47/11H04L43/0876H04L43/0882H04L43/0894H04L43/16H04L47/10H04L43/045H04L41/0894
Inventor FLAUAUS, GARY R.HARRIS, BYRONJACQUOT, BYRON
Owner MCDATA CORP
Learn More