
In-flight control system stability margin assessment

a control system and stability margin technology, applied in the direction of vehicle position/course/altitude control, process and machine control, instruments, etc., can solve the problems of unnecessarily sensitive system, unnecessary waste of cost and manpower to develop the control system, and lack of rigorous theoretical underpinning

Inactive Publication Date: 2005-06-16
THE BOEING CO
View PDF14 Cites 6 Cited by
  • Summary
  • Abstract
  • Description
  • Claims
  • Application Information

AI Technical Summary

Benefits of technology

[0017]FIG. 5 is a graph in the complex plane showing an example of determining stability margins as a function of system sensitivity function peak in accordance with an embodiment of the present invention;
[0018]FIG. 6 is a block diagram for a system simulation using a commercially available system simulation program for in-flight sta...

Problems solved by technology

While being comforting by providing some information where there is a complete lack of data for prediction of stability margins, this approach lacks a rigorous theoretical underpinning and, consequently, can lead to one or another of the following in-flight situations: either an overly conservative prediction of stability margins or a poor prediction of insufficient stability margins.
In either case, the design cost and man power to develop the control system have been unnecessarily wasted, the attitude control system is bound to be sensitive to physical uncertainty, and control system stability margin and performance will most likely be poor.
In general, stability margins of spacecraft attitude control systems have not been assessed directly in flight due to the possibility of pushing the spacecraft into its instability regions with the attendant risk of driving the spacecraft into instability and not being able to recover control.
Actual missions of prior art spacecraft have experienced in-flight “surprises” or anomalies from time to time in terms of lacking control system stability.
When such an incident occurs, it can be a very disappointing and costly situation.
When the design and analysis work fail to predict control system stability due to lack of in-flight spacecraft dynamics knowledge, entry of the spacecraft into service is typically delayed and additional engineering resources are often spent solving the problem.

Method used


Image

  • In-flight control system stability margin assessment
  • In-flight control system stability margin assessment
  • In-flight control system stability margin assessment

Examples


example

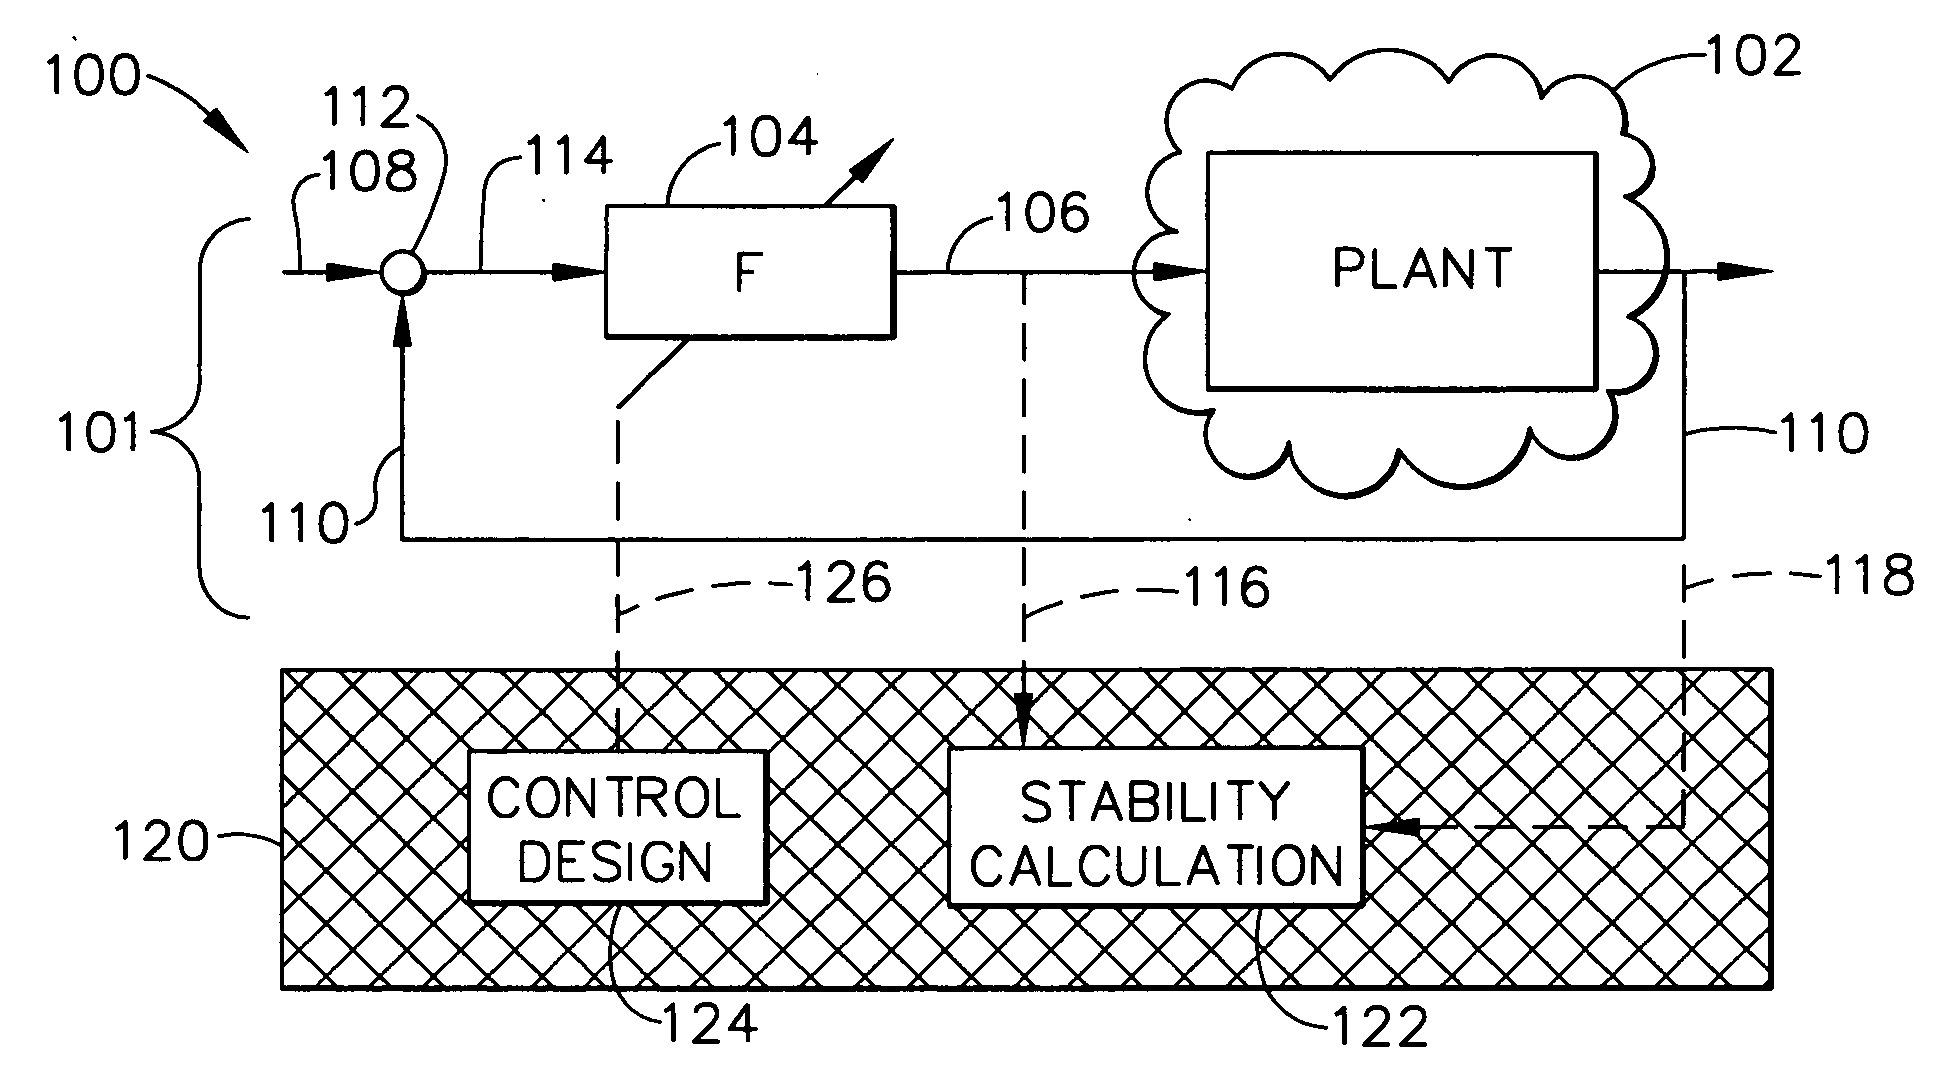
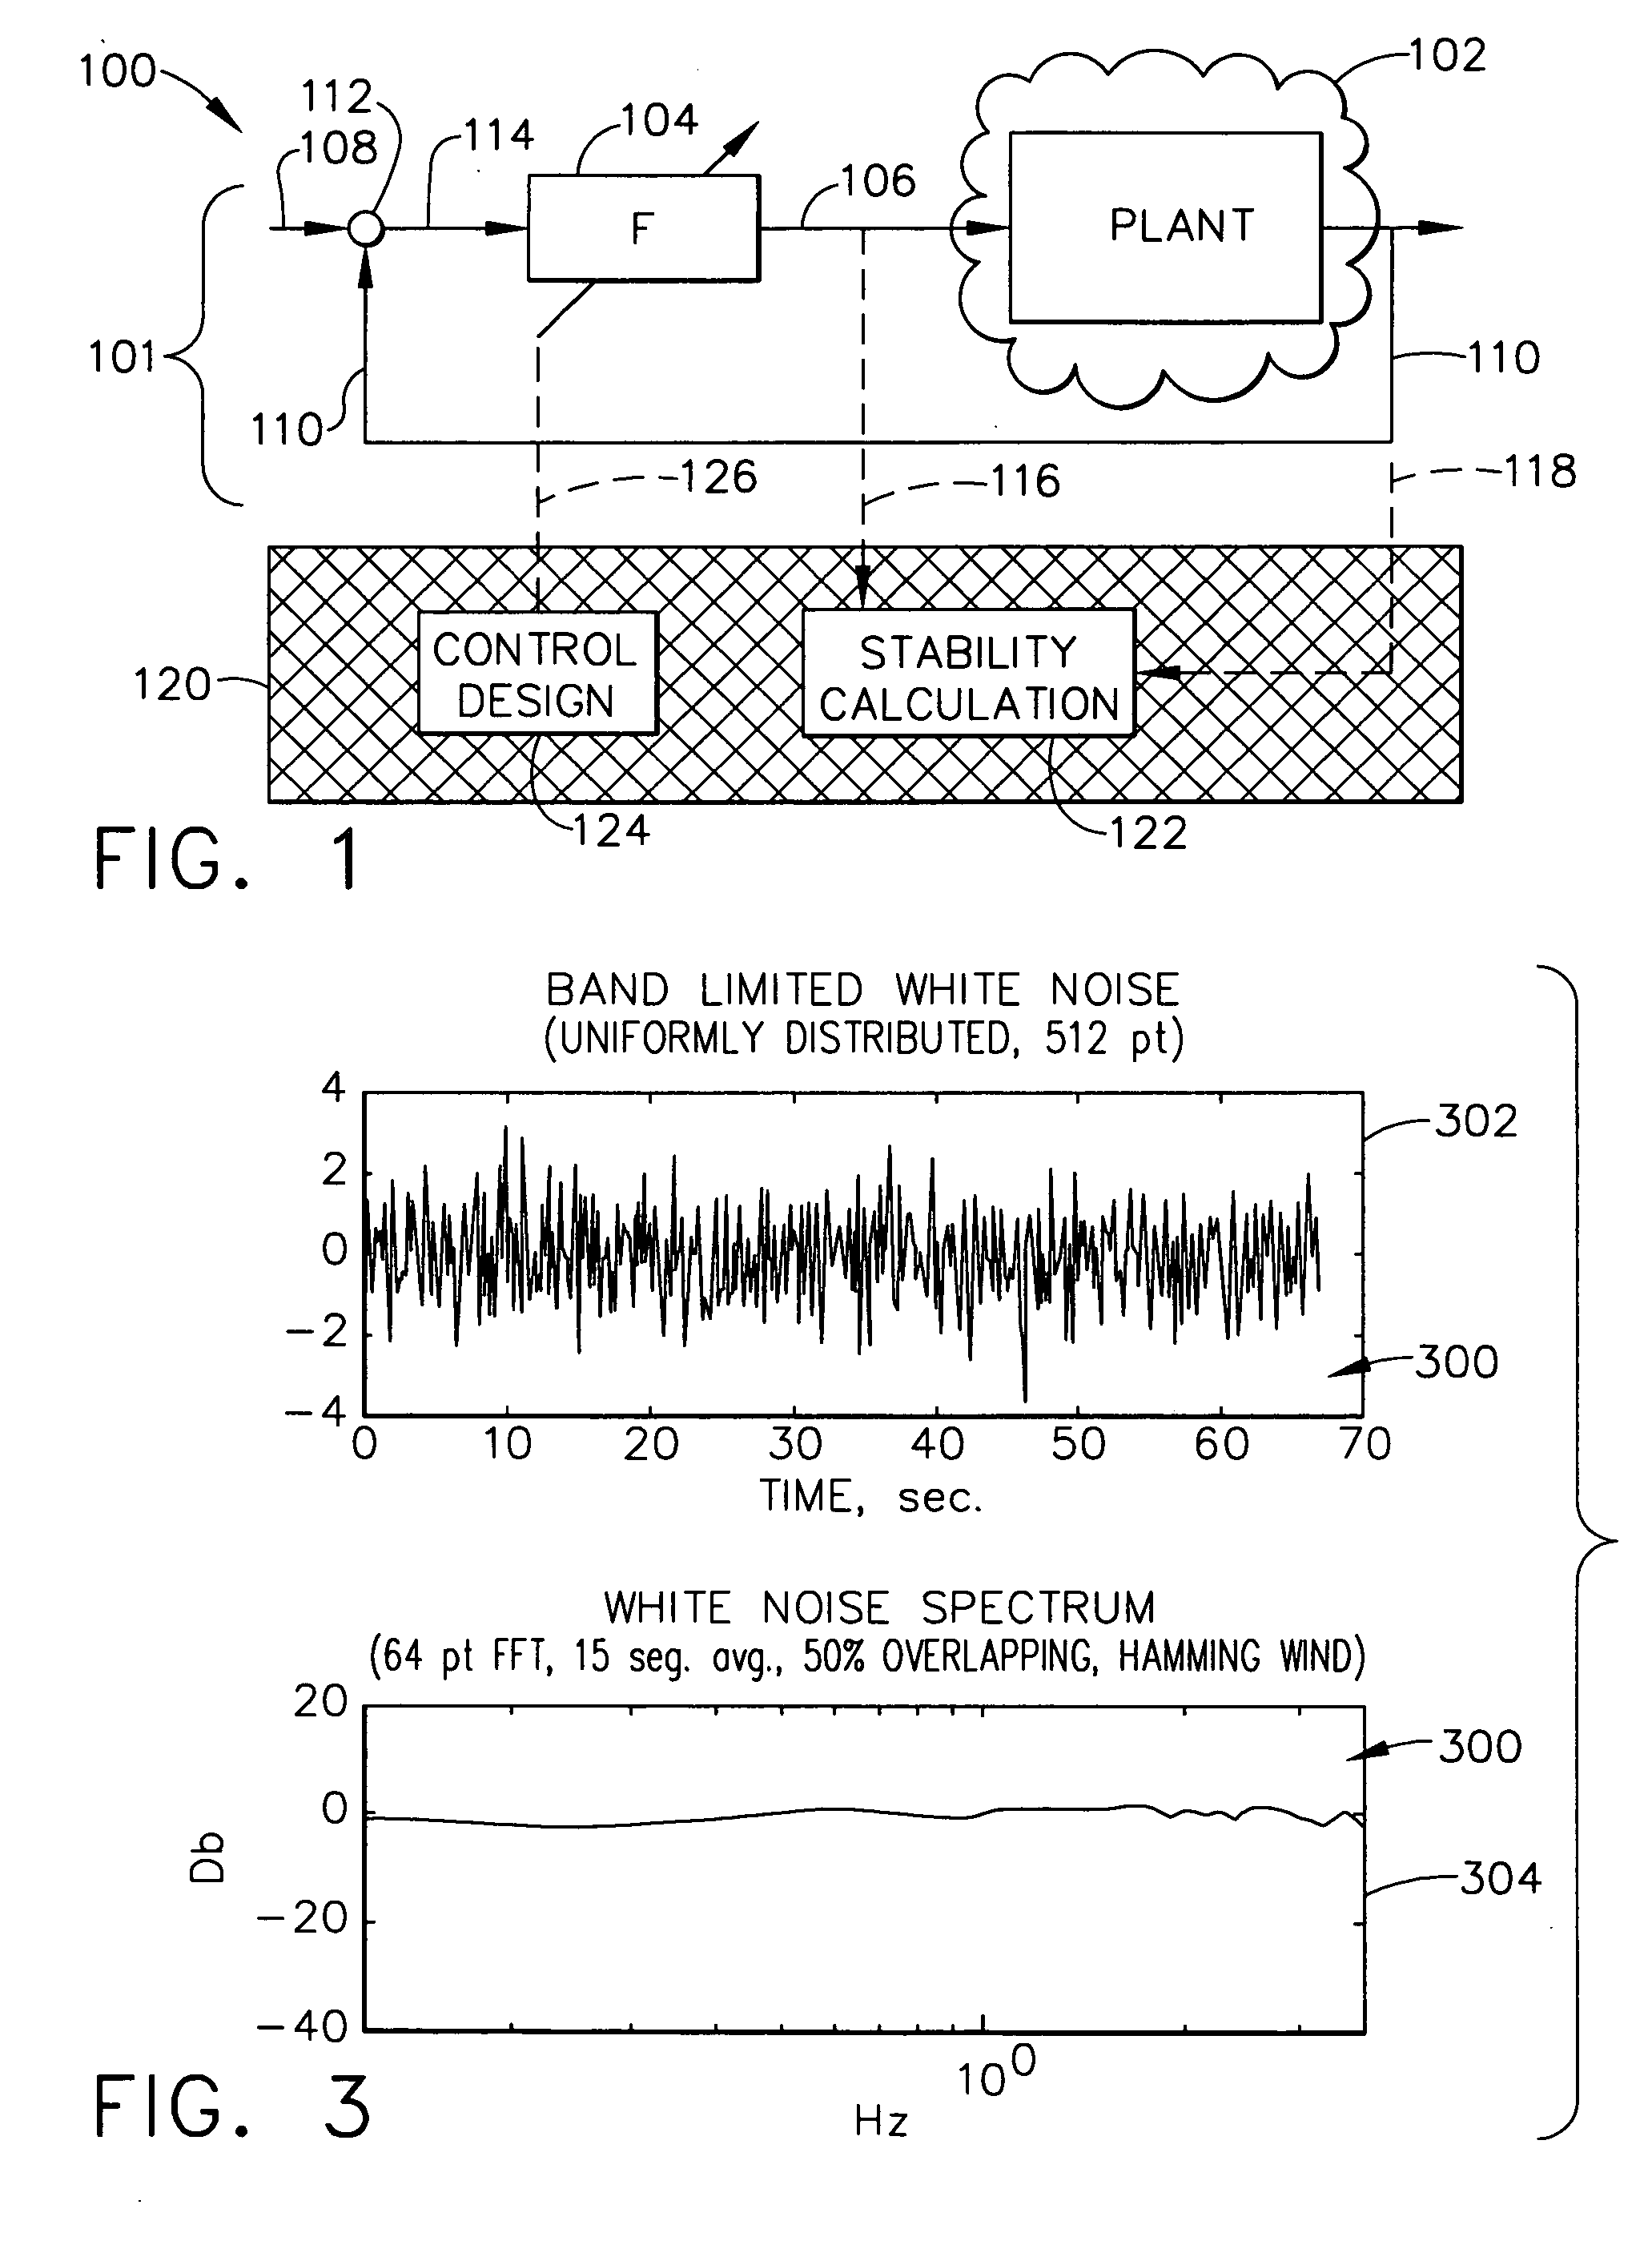
[0052] Referring now to FIGS. 6 and 7, IFSMA may be illustrated using an example of an analytical physical plant model. The approach of the illustrative example is to identify the sensitivity function S using the white noise excitation signals, compute the spectrum estimate of S and compare the spectrum estimate of S 720 to the system sensitivity function S 710 of the analytical model in the frequency domain.

[0053] A SIMULINK™ block diagram for system model 601, shown in FIG. 6, models a system with nominal control laws and plant dynamics. Thus, an analytical model can be used to provide the “exact” system sensitivity function S 710 shown in FIG. 7 of the analytical model of system model 601. The modeled system may be similar to an actual system such as system 101 shown in FIG. 1. Thus, system model 601 includes a controller 604, model of physical plant 602, reference signal 608, feedback signal 610, comparator 612, comparison signal 614, and control signals 606 modeling correspond...


PUM


Abstract

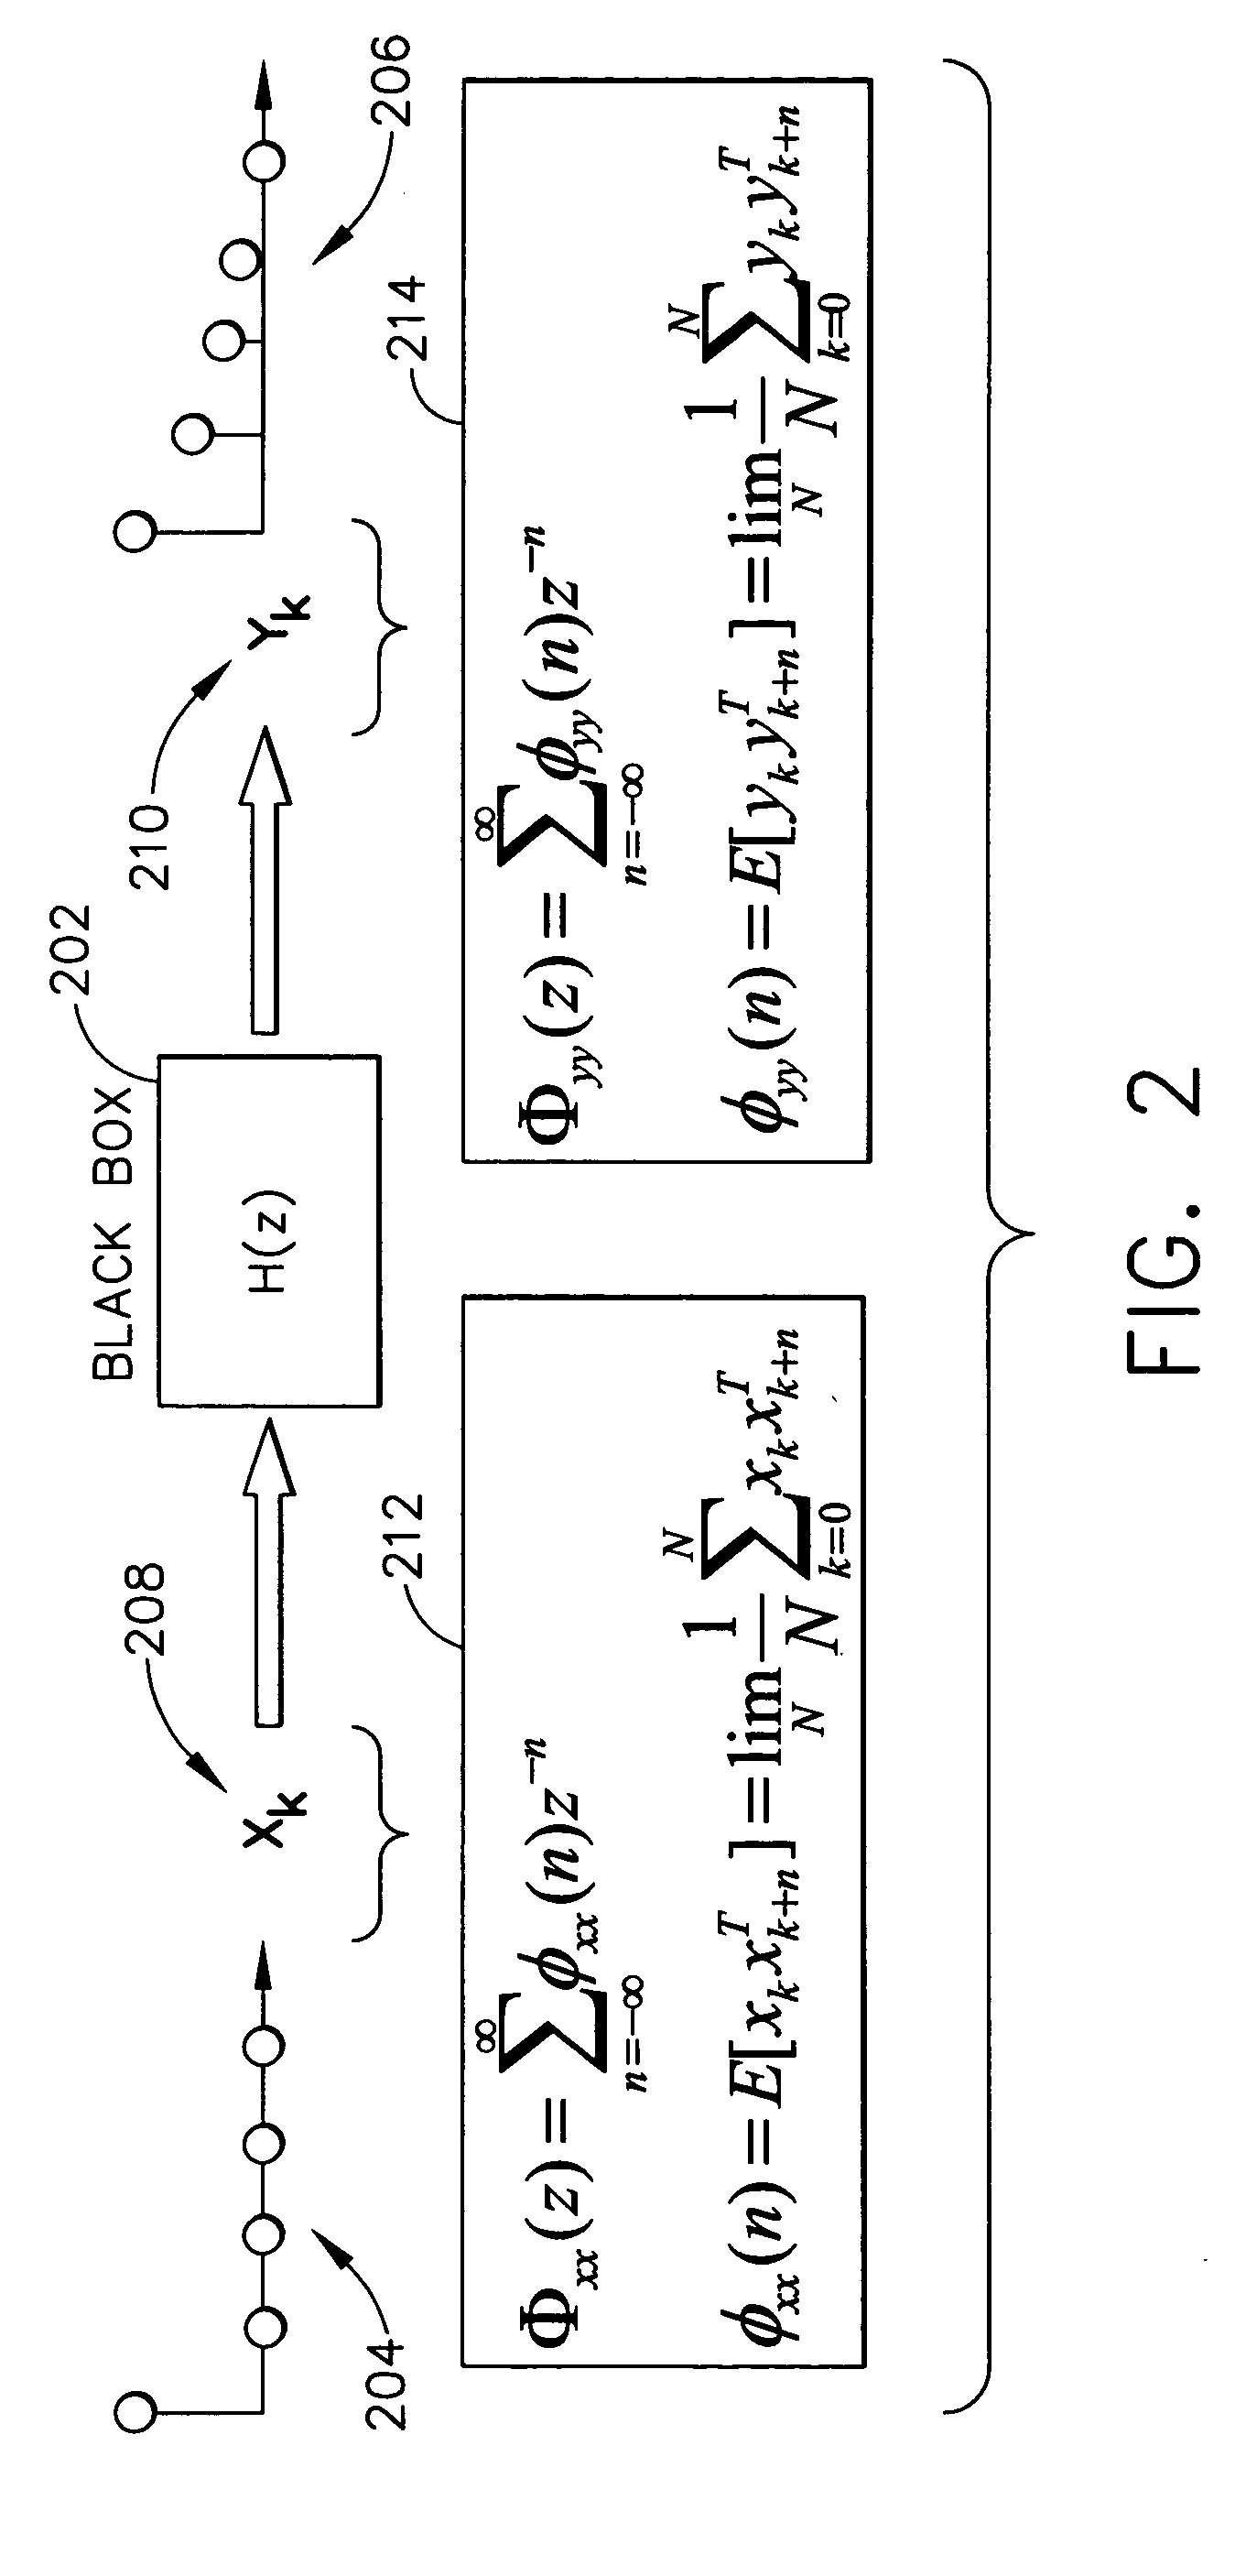
A method for in-flight stability margin assessment includes steps of: exciting a control system with a wide band spectrum excitation signal to produce in-flight data; storing the in-flight data in an on-board computer during operation of a spacecraft mission; downloading the in-flight data via telemetry during operation of the spacecraft mission; estimating a system sensitivity function by taking the ratio of an output power spectrum to an input power spectrum; and determining stability margins of the attitude control system from the system sensitivity function by determining a gain margin GM and a phase margin PM from the formulas: 11-amin<GM<11+aminPM>±sin-1⁡(amin2)where “amin” is the reciprocal of the peak of the system sensitivity function. The method optionally includes redesigning and providing a new control law to the control system if deemed necessary.

Description

BACKGROUND OF THE INVENTION [0001] The present invention generally relates to attitude control systems and, more particularly, to a method of assessing control system stability margins. [0002] A current approach to assessing control system stability margins is to provide a dynamic model of the control system as it applies, for example, to a spacecraft, or other vehicle whose physical motion, or attitude, is to be controlled and assume that dynamic model can vary, say, + / −25%, then check the stability margins accordingly in simulation—such as a computer simulation. While being comforting by providing some information where there is a complete lack of data for prediction of stability margins, this approach lacks a rigorous theoretical underpinning and, consequently, can lead to one or another of the following in-flight situations: either an overly conservative prediction of stability margins or a poor prediction of insufficient stability margins. In either case, the design cost and ma...

Claims


Application Information

Patent Timeline
IPC IPC(8): B64G1/24G05B5/01G06F7/00
CPCG05B5/01B64G1/24B64G1/244
Inventor CHIANG, RICHARD Y.
Owner THE BOEING CO
Learn More