Foot pressure and shear data visualization system

a data visualization and foot pressure technology, applied in the field of foot pressure and shear data visualization system, can solve the problems of inability to accurately predict the maximum shear stress, limited instrumentation, complicated combined effect, etc., and achieve the effect of facilitating commercialization

Inactive Publication Date: 2005-08-04
FOSTER MILLER TECH +1
View PDF31 Cites 47 Cited by
  • Summary
  • Abstract
  • Description
  • Claims
  • Application Information

AI Technical Summary

Benefits of technology

[0016] According to a preferred embodiment of the present invention, the above described needs are met and additional advantages provided, by a system, method and computer product which allow a clinician to see an accurate simultaneous representation of three-dimensional (3-D) pressure and shear patterns on an image of the plantar surface and identifies areas of concern. Adaptable to a variety of measurement systems, the present invention uses a deformed mesh technique to visualize horizontal shear and color mapping to visualize vertical pressure. Additional cues, such as scaled, directed arrows, are available as an option to enhance the visualization.
[0020] The present invention also contemplates analysis, identification and visualization of areas of maximum shear and pressure, and patterns of shear representing bunching, stretching and twisting of skin on the plantar surface that may create a high risk of ulceration. The present invention computes bunching, stretching and twisting indices and identifies the locations where these indices are at a maximum both at a single instant in time and over an entire data set. In this way, sensor data can be automatically scanned and regions and times of interest highlighted for further inspection. Availability of the present invention, in combination with new pressure / shear hardware measurement systems, will greatly improve the diagnosis, prevention and treatment of foot ulcers in diabetic patients.
[0022] The system architecture of the present invention will handle pressure and shear data from a variety of sensor systems and convert these to a unified internal data representation to support analysis and visualization. This unified data model will accommodate variations in spatial and temporal frequency between sensor systems. Since the key capabilities are imbedded in a central software engine, the architecture can be implemented either as a turn-key system or as an add-on for integration with software systems from other vendors. This modular design facilitates commercialization.

Problems solved by technology

However, current opinion is divided as to the principal mechanical factors leading to ulcer formation; repetitive loads, shear and pressure all are cited as potentially detrimental.
Unfortunately, the studies that are focused on the nature of shear forces under the feet have been limited by instrumentation that could detect shear forces in only one direction, (e.g., medio-lateral).
This limitation inevitably results in an underestimation of maximum shear stress, since this quantity is a vector-addition of medio-lateral and anterior-posterior components.
From a biomechanical viewpoint, skin stresses are certainly dictated by both pressure and shear, although the combined effect is likely to be more complicated that a simple vector addition of these stresses would suggest.
Incorporation of shear measurement capability into commercial measurement systems, which typically consists of a matrix of more than 2,000 pressure sensors, will further increase their complexity.
Existing software to display and quantify pressure does not meet the needs of researchers and clinicians who want to understand the role of both shear and pressure.

Method used


Image

  • Foot pressure and shear data visualization system
  • Foot pressure and shear data visualization system
  • Foot pressure and shear data visualization system

Examples


Embodiment Construction

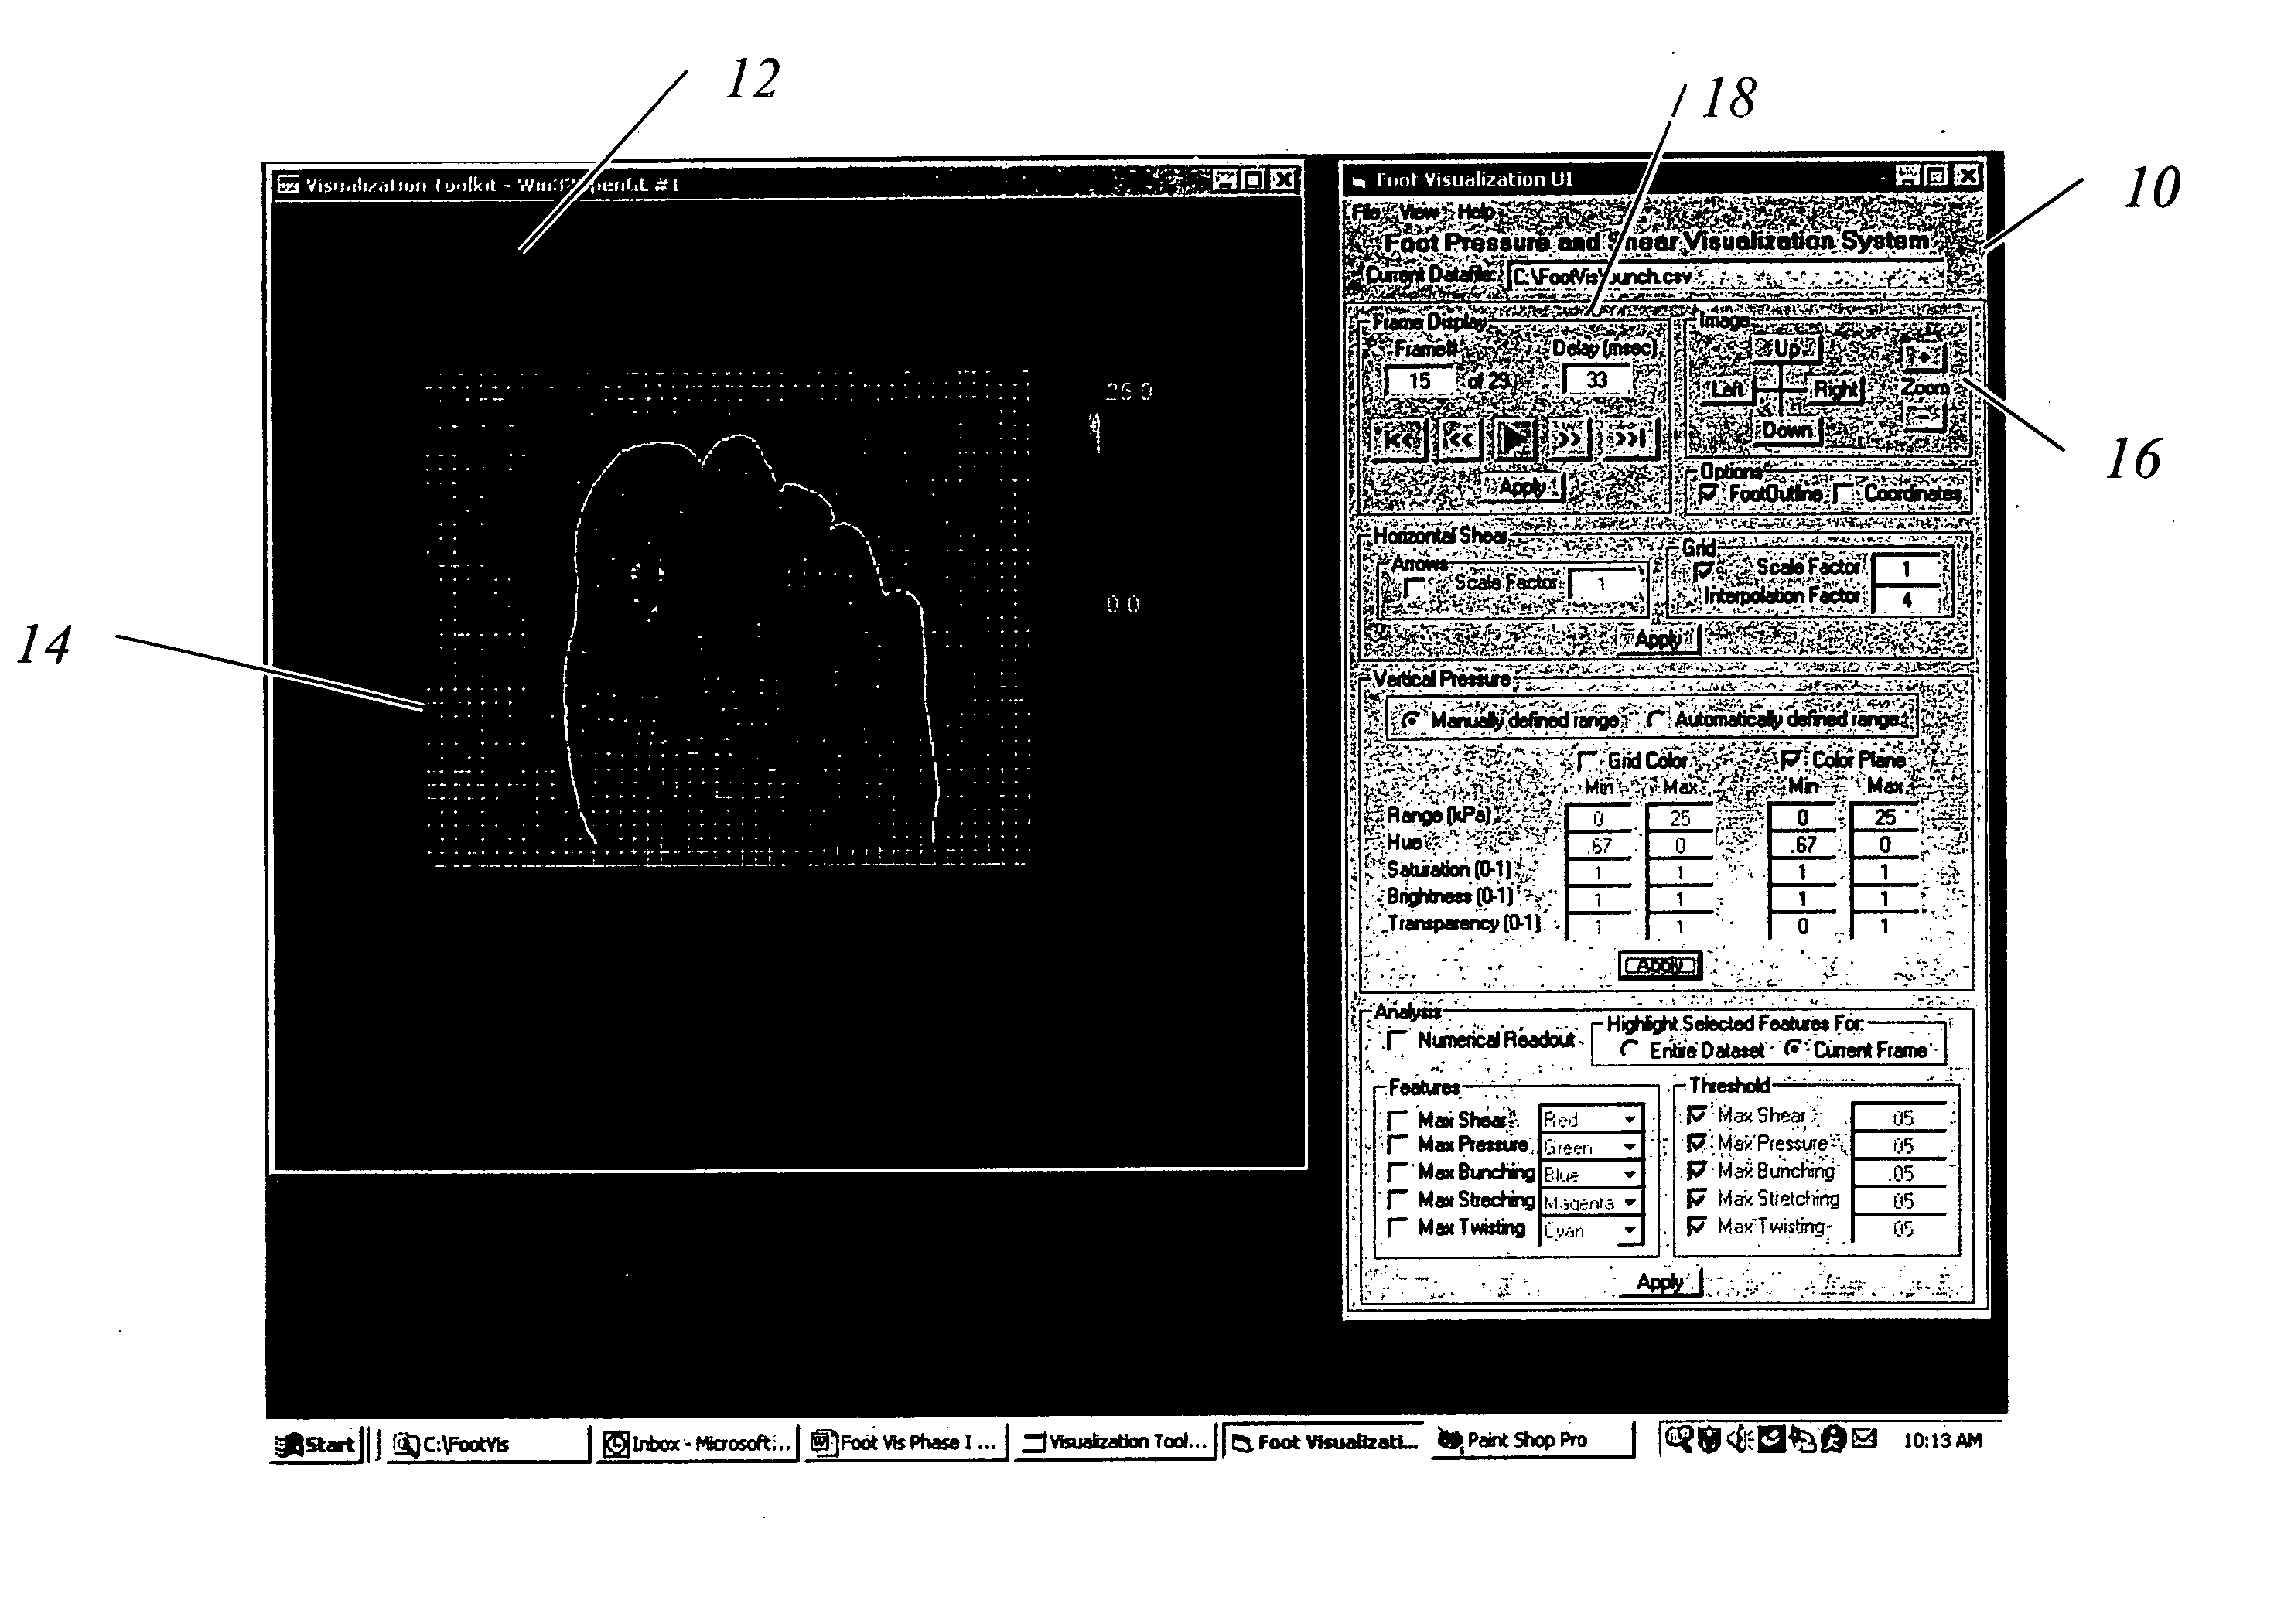
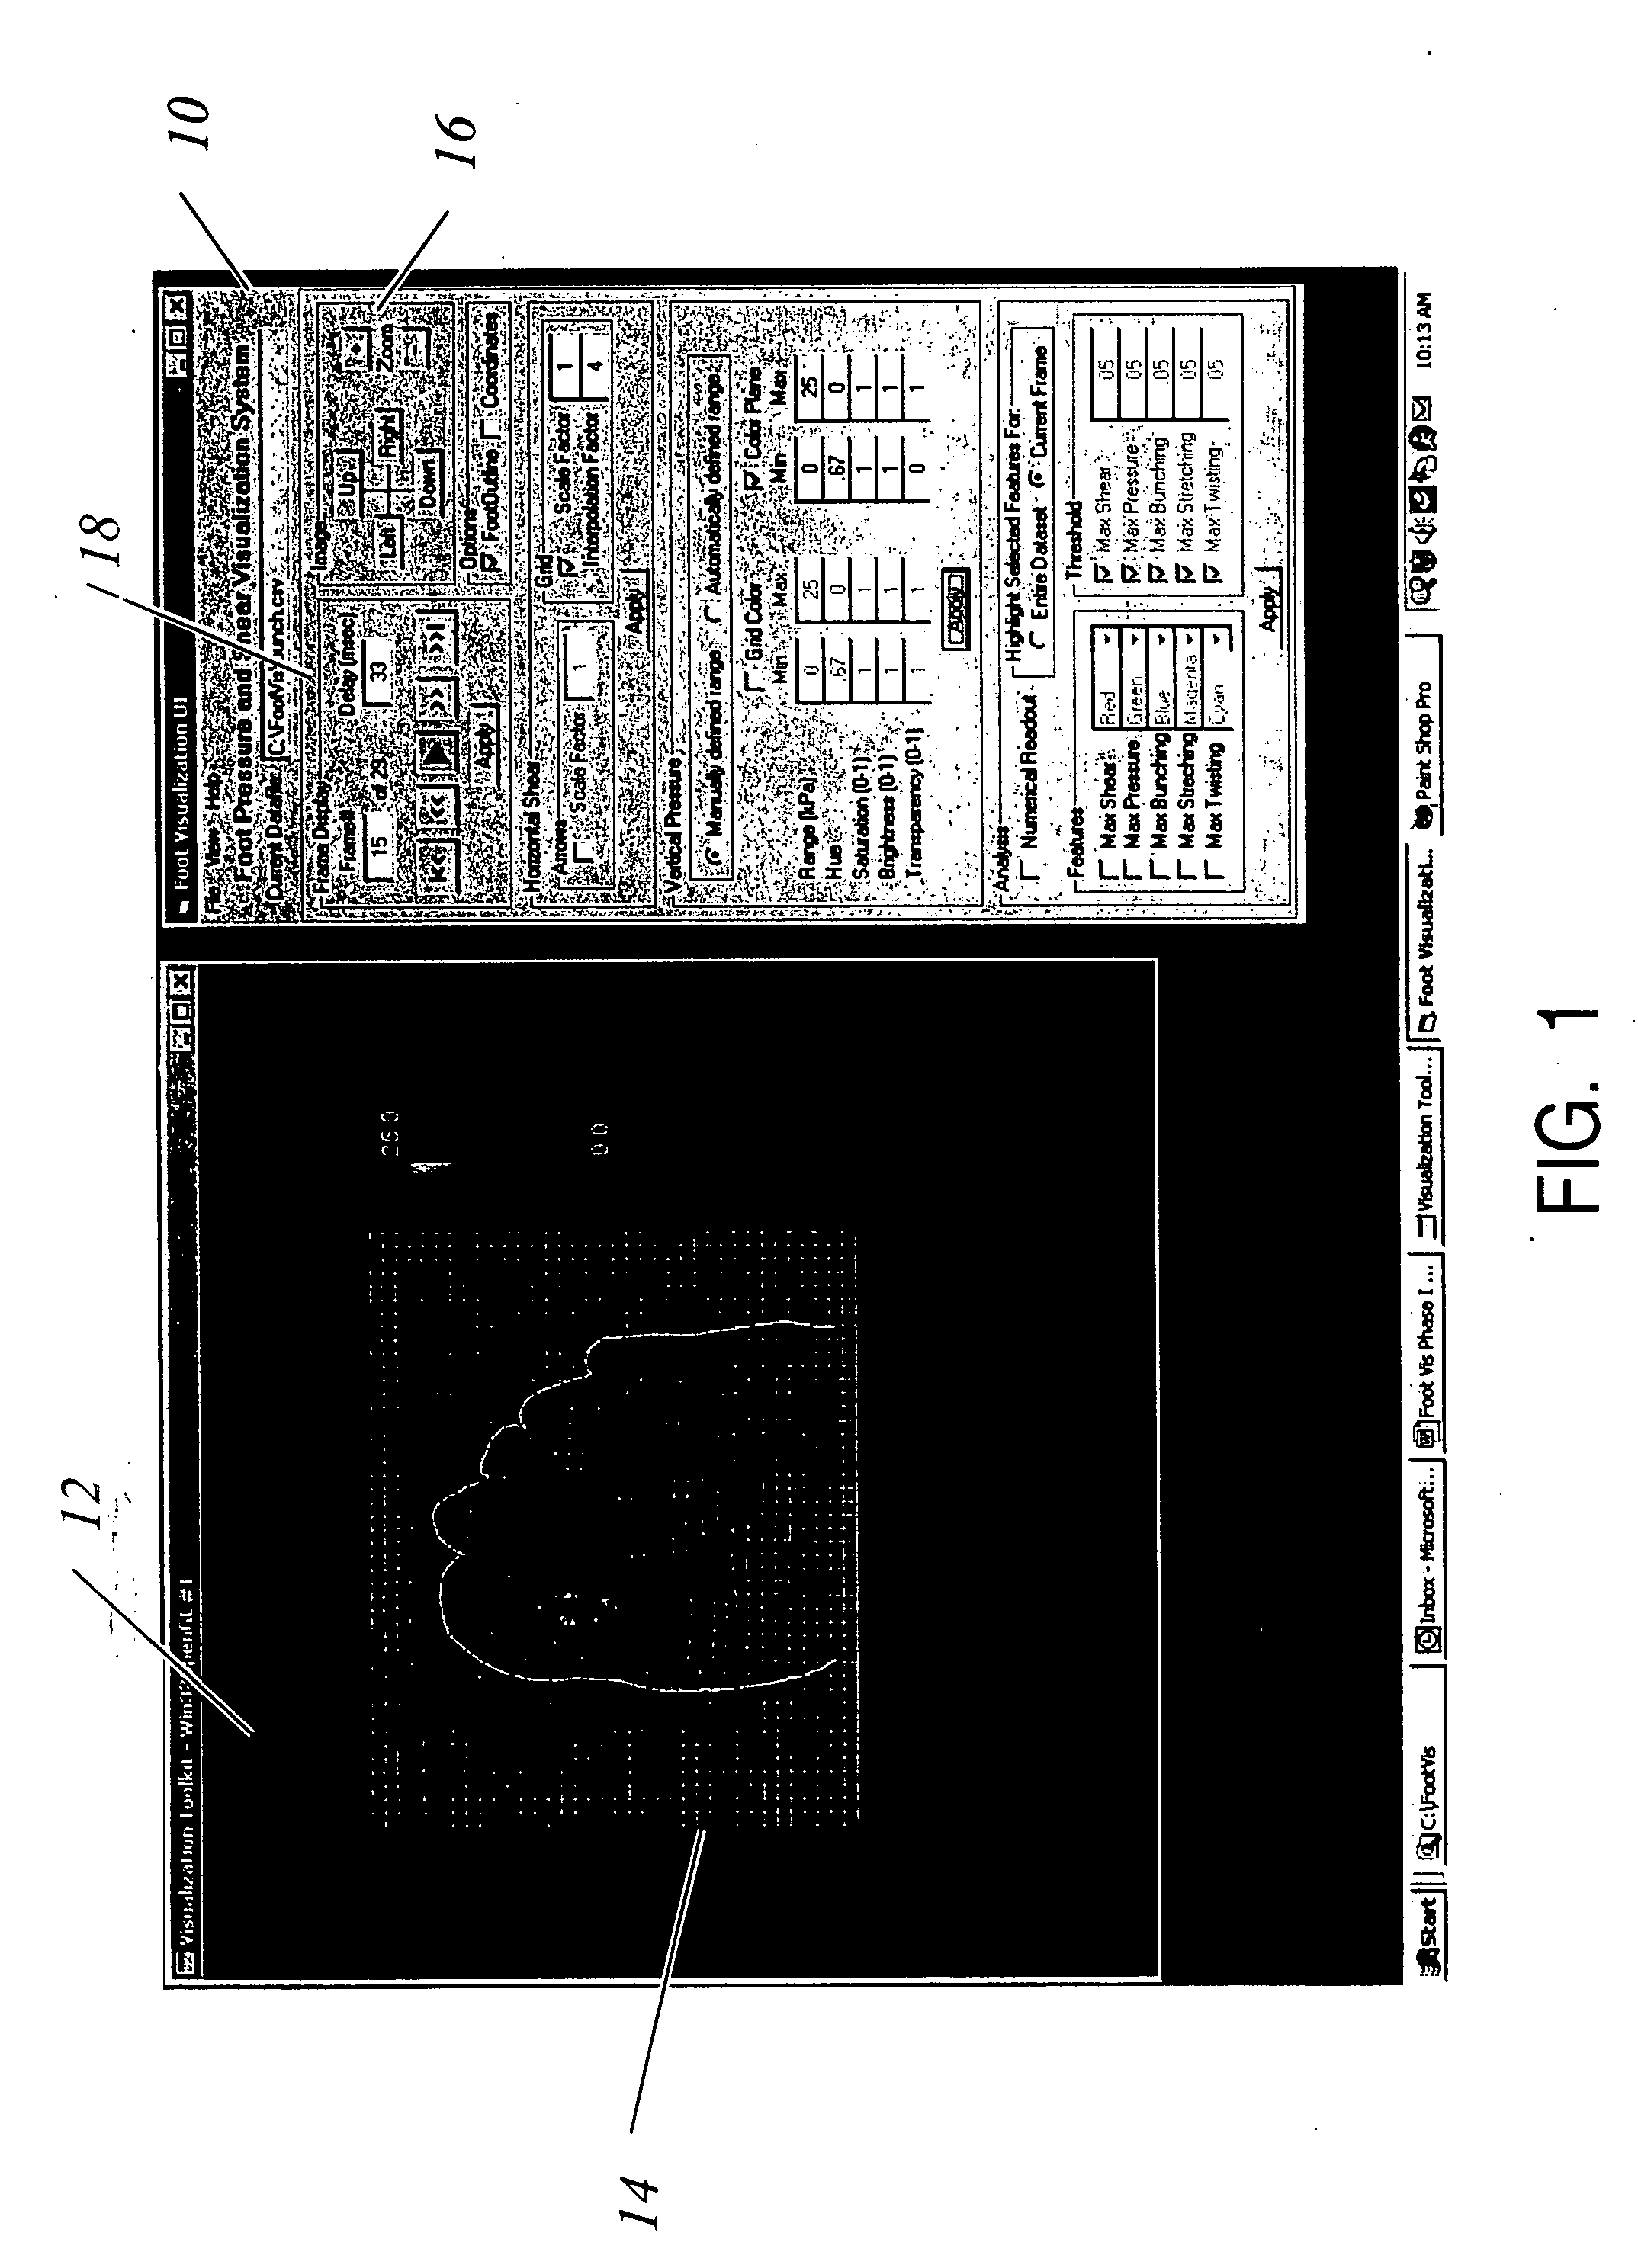
[0034] The present invention provides a system, method and computer product for analyzing and visualizing distributed shear and pressure data, and, is especially useful, for generating and displaying an accurate simultaneous representation of 3-D pressure and shear patterns on the plantar surface of a foot, and for identifying areas of concern.

[0035] Although the system is compatible with a wide variety of shear and pressure measurement hardware, a prototype was initially designed to work with data generated by an experimental sensor array.

[0036] This sensor array (not shown) consists of a rectangular array of 8×10 sensors, each of which is 1.0×1.0 cm. The overall array size is suitable for measurement under the critical forefoot region. Each of the 80 sensors contains a set of strain gages that are sensitive to vertical pressure, x-direction shear, and y-direction shear. A personal computer (PC) handles data acquisition and sequentially scans the sensors, returning to each sensor...


PUM


Abstract

A foot pressure and shear visualization system employs a deformed mesh technique to visualize horizontal shear and color mapping to visualize vertical pressure on a skin surface, e.g. the plantar surface of a foot. Additional cues, such as scaled, directed arrows may be used to enhance the visualization. This system includes a set of sensor hardware interface modules to acquire foot visualization data sets, a data base manager that allows host applications to store and retrieve the data files in a data base, a graphical user interface that performs the display and control aspect, as well as maintains the data files, and a visualization and analysis engine that performs all data set rendering and analysis. The graphical user interface controls a main user interface window, while the visualization and analysis engine controls a rendering window for the combined shear and pressure visualization.

Description

BACKGROUND OF THE INVENTION [0001] A. Field of the Invention [0002] The present invention relates to methods, systems and computer products for providing a visualization of forces acting on the skin, and, more particularly, for presenting an accurate representation of three-dimensional pressure and shear patterns on the plantar surface of a foot and identifying and indicating areas of concern for pathological consequences to the skin. [0003] B. Description of the Background Art [0004] According to the American Diabetes Association, there are approximately 16 million patients in the United States with diabetes, with 800,000 new diagnoses each year. For these patients, foot complications account for more hospitalizations than any other clinical problem, and plantar ulcerations are a major reason for subsequent foot amputation. [0005] In the etiology of foot ulcers in diabetic patients, it is generally agreed that non-mechanical factors such as peripheral neuropathy, dry skin, and / or v...

Claims


Application Information

Patent Timeline
Patent Type & Authority Applications(United States)
IPC IPC(8): A61B5/103G06T15/00G06T17/40
CPCA61B5/1036A61B5/7445G06T2219/2021G06T2219/2012G06T19/20
Inventor HIRSCHMAN, GORDON B.DAVIS, BRIAN L.
Owner FOSTER MILLER TECH
Why Eureka
Try Eureka