Matched filtration with experimental noise determination for denoising, peak picking and quantitation in lc-ms

a technology of experimental noise determination and matching filtration, applied in chemical methods analysis, instruments, material analysis, etc., can solve problems such as difficult detection and identification of peaks, difficult detection of low intensity peaks, so as to reduce noise, increase reliability, and no distortion

Inactive Publication Date: 2005-11-24
NORTHEASTERN UNIV
View PDF8 Cites 49 Cited by
  • Summary
  • Abstract
  • Description
  • Claims
  • Application Information

AI Technical Summary

Benefits of technology

[0010] In accordance with the present invention, an improved system and method of analyzing a multi-dimensional data set is provided that increases the reliability of peak detection and identification in the presence of chemical and / or random noise. The system and method of the present invention achieves such increased reliability by (1) generating a multi-dimensional data set having a first dimension corresponding to compound separation information and a second dimension corresponding to compound characteristic information, e.g., spectral information, (2) reducing noise in the multi-dimensional data set, (3) detecting peak candidates in the first dimension of the data set, and (4) identifying peaks from among the detected peak candidates in the second dimension of the data set.
[0013] First, the LC-MS data array is analyzed in the chromatographic time dimension to generate one or more first extracted ion chromatograms having one or more regions in which there are no peaks conforming to predetermined chromatographic criteria (“chromatographic peaks”). The chromatographic peak-free regions of the first extracted ion chromatograms are herein referred to as vacant chromatograms. Next, noise characteristics (e.g., as represented by one or more power density spectra) of the LC-MS data set are determined based on an analysis of noise in the vacant chromatograms, and at least one transfer function is determined based on the noise characteristics. Noise is then reduced in the LC-MS data set by performing matched filtration of the first chromatograms with the transfer function to generate one or more second extracted ion chromatograms, and by generating a noise-reduced LC-MS data set based on the second extracted ion chromatograms. Like the original LC-MS data set, the noise-reduced LC-MS data set is represented by an LC-MS data array having a chromatographic time dimension and a mass spectral dimension. The noise-reduced LC-MS data array is then analyzed in the chromatographic time dimension and the mass spectral dimension to detect one or more peaks within the corresponding data set. It is important to note that noise reduction performed in the chromatographic time domain does not distort the shapes of MS peaks. On the contrary, chemical noise is removed and the MS peaks are made more symmetrical regardless of the S / N value, thus improving the accuracy of peak centroids definition.
[0015] By generating a multi-dimensional data set having respective dimensions corresponding to compound separation and compound characteristic properties, reducing noise in the multi-dimensional data set, and detecting peaks by analyzing the data set in each of the respective dimensions of the data, peaks (i.e., compounds) can be detected, identified, and quantitated with increased reliability in the presence of chemical and / or random noise and with substantially no distortion in the mass spectral domain.

Problems solved by technology

One drawback of conventional systems for analyzing sample mixtures is that the analysis of data generated by the system often creates a limitation, especially when data generated from complex sample mixtures are analyzed.
Another drawback of conventional sample analysis techniques is that noise in the data frequently makes the detection and identification of peaks, particularly, low intensity peaks, less reliable.
Such noise may comprise chemical noise and / or random noise having a magnitude high enough to reduce significantly the peak Signal-to-Noise ratio (S / N), thereby making the detection of low intensity peaks problematic.
However, the CODA algorithm is not using the a priori information about the shape and width of chromatographic and MS peaks and is typically not robust to chemical and random noise.
However, such de-noising during SPC can significantly alter the data.
However, the WMSM technique is generally not very robust to the non-uniformities connected with limited ion statistics.

Method used


Image

  • Matched filtration with experimental noise determination for denoising, peak picking and quantitation in lc-ms
  • Matched filtration with experimental noise determination for denoising, peak picking and quantitation in lc-ms
  • Matched filtration with experimental noise determination for denoising, peak picking and quantitation in lc-ms

Examples


example 1

Noise Reduction in LC-MALDI-MS Data Sets

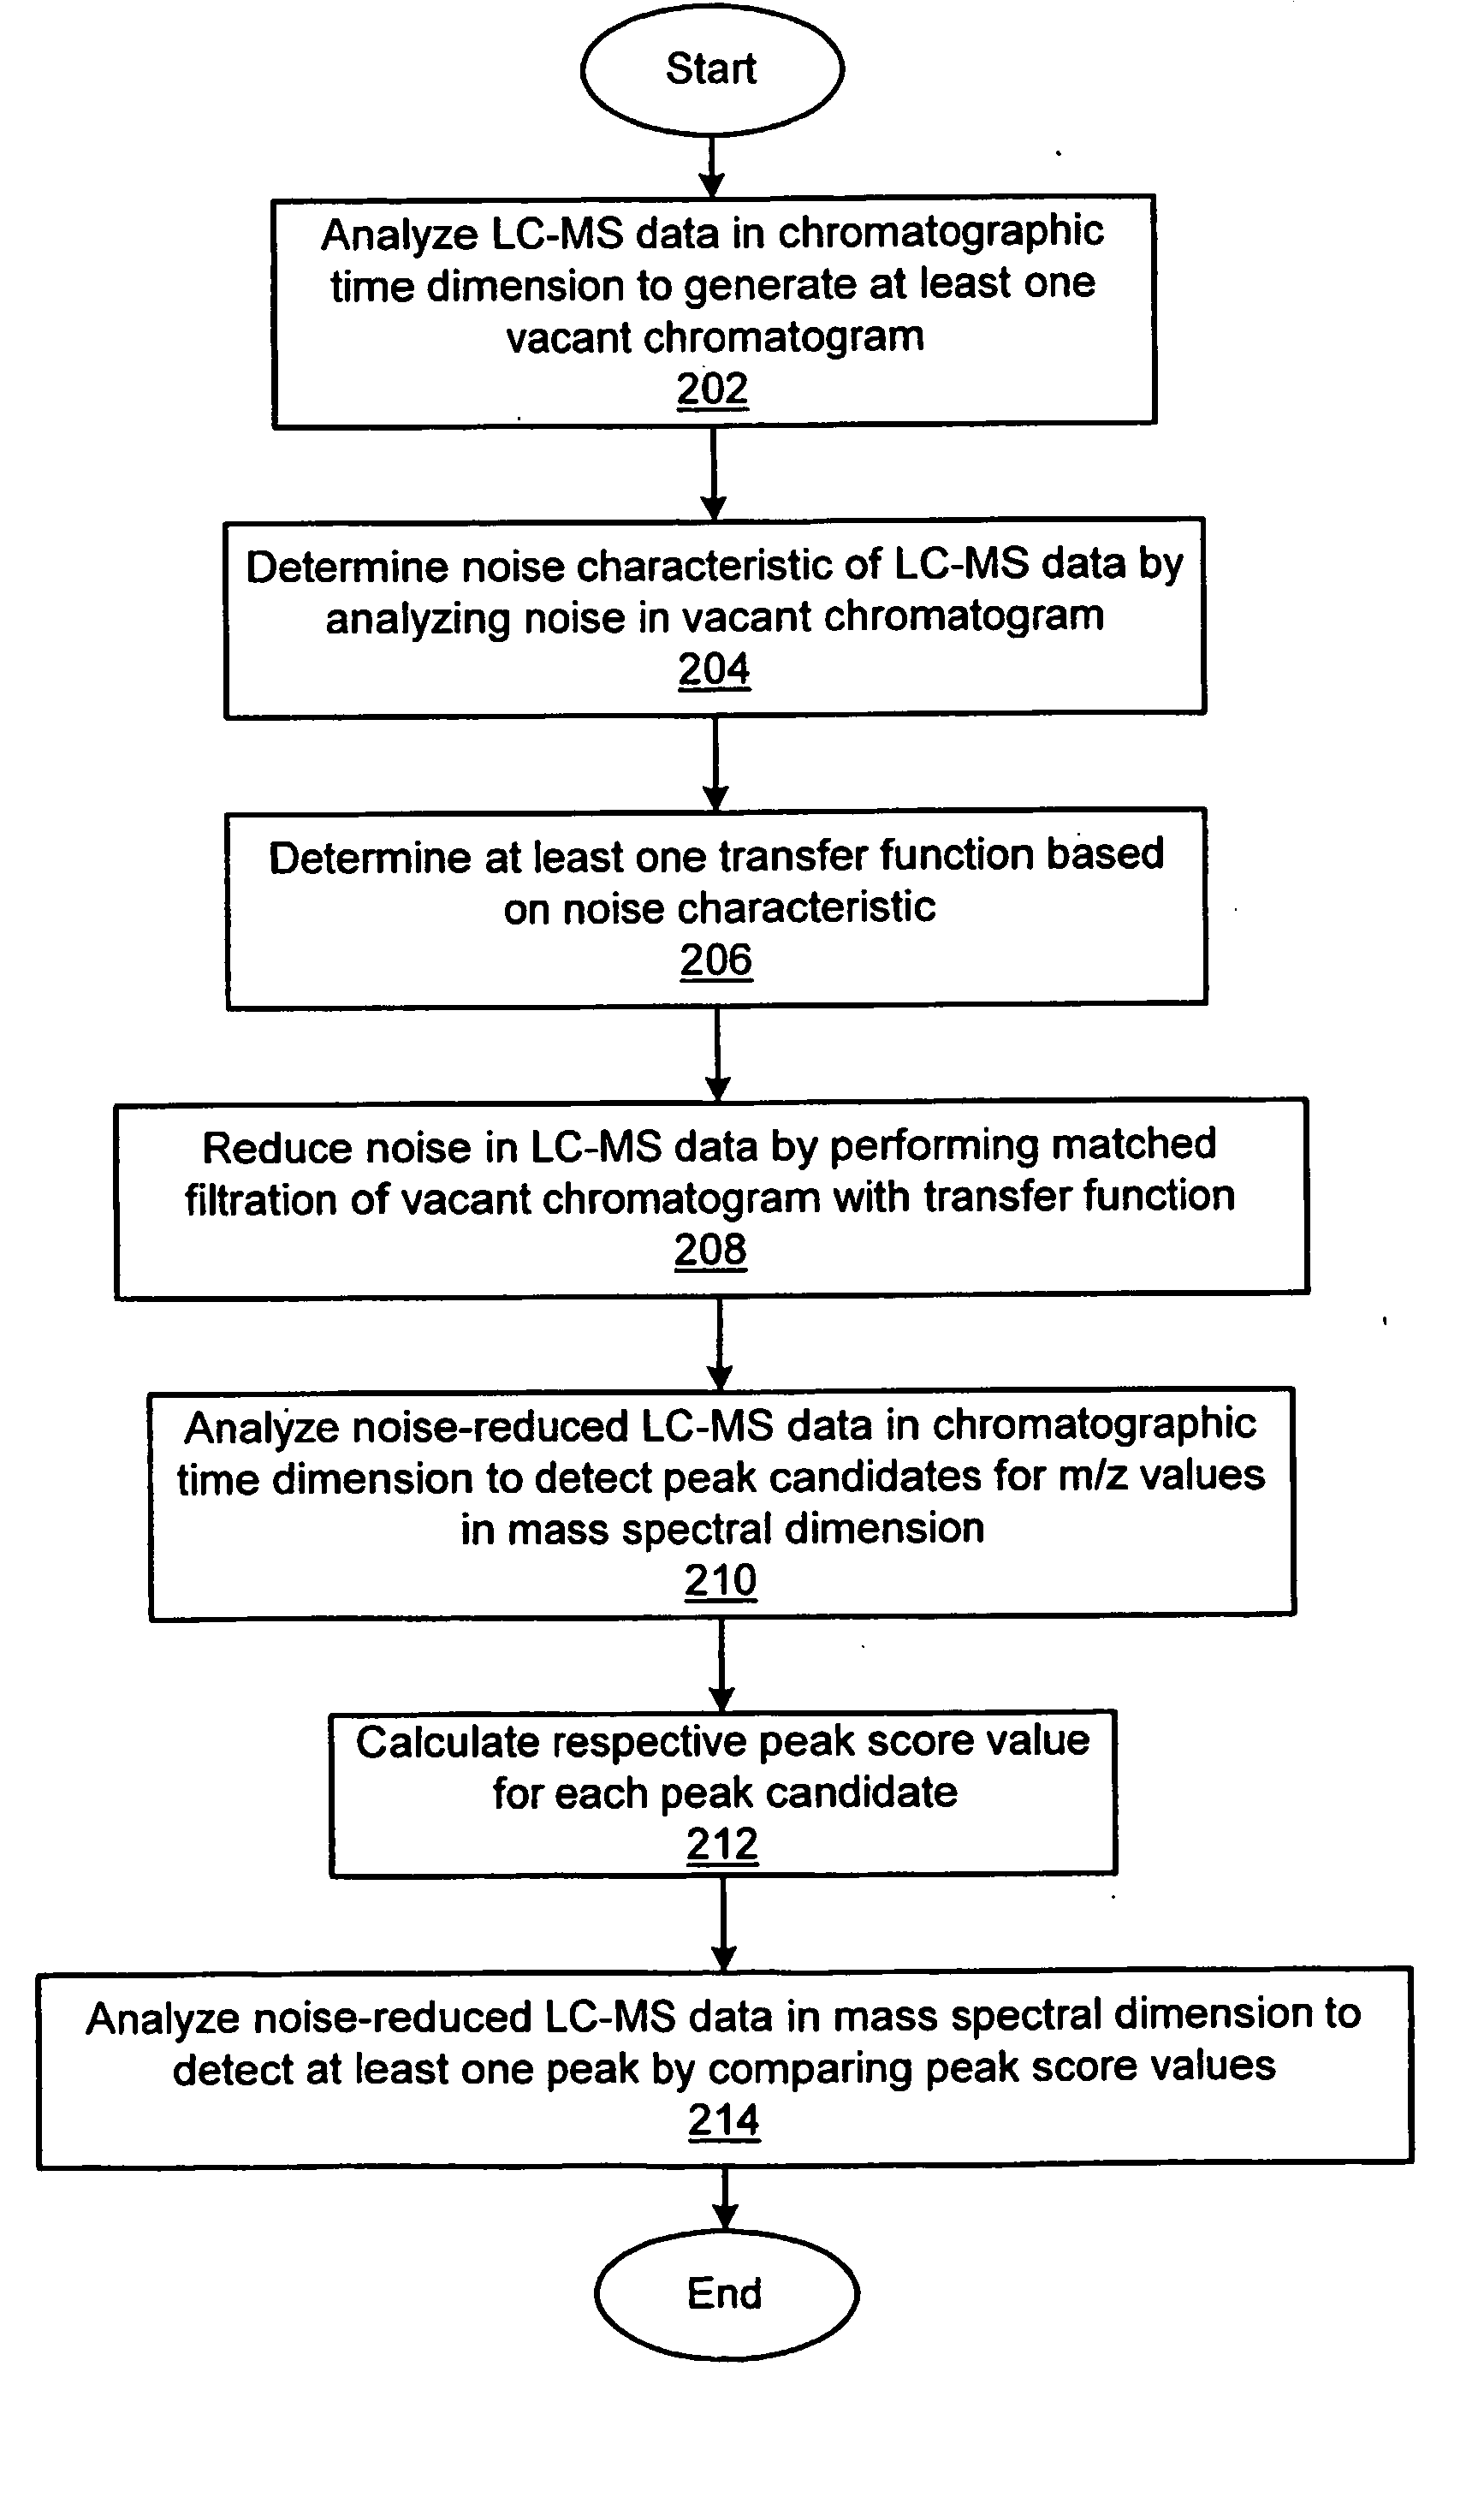
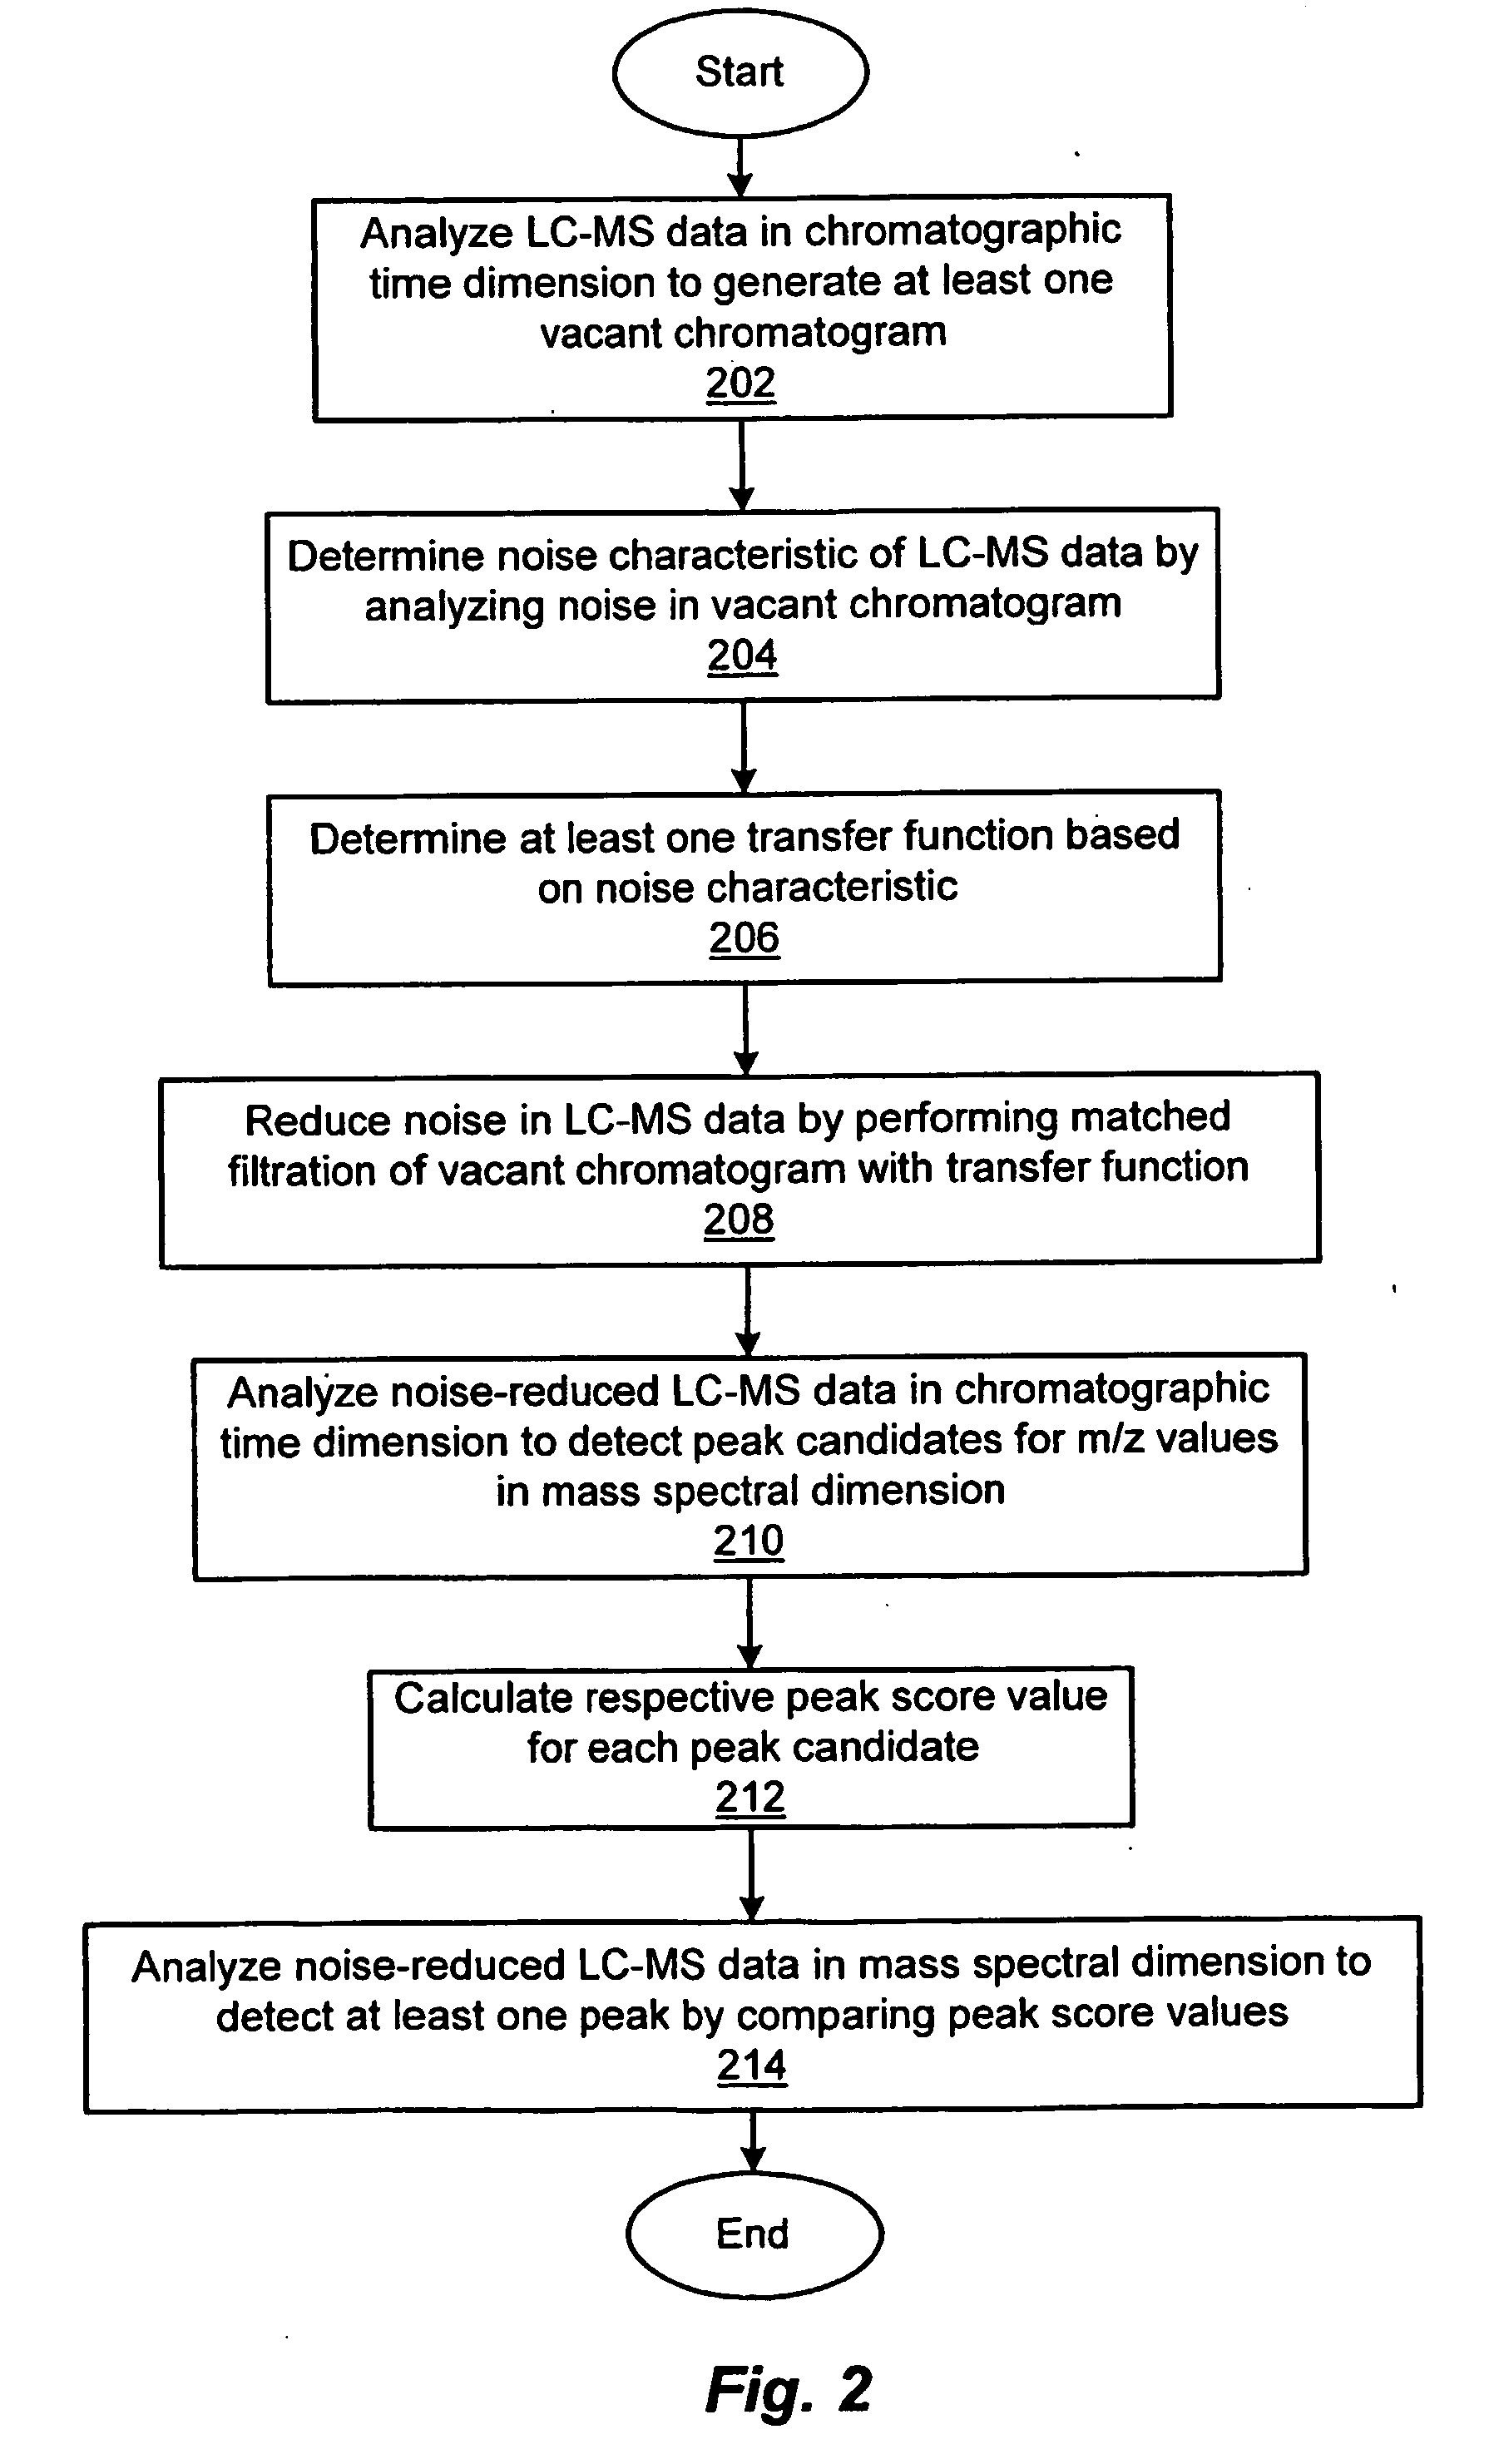
[0054] It should be appreciated that the suppression of chemical and random noise is important for the generation of accurate peak lists. FIGS. 3a-3d depict noise reduction of a typical mass spectrum from an LC-MALDI-MS data set produced by the analysis of a mixture of 10 standard peptides (see SAMPLES below, Sample 1). Specifically, FIG. 3a depicts a representative original spectrum corresponding to one second of chromatography resulting from averaging a signal from 150 laser shots; FIG. 3b depicts the result of moving-averaging of 10 consecutive spectra from the original data set (corresponding to 10 seconds of chromatography and 1500 laser shots); FIG. 3c depicts the result of noise reduction by cross-correlation of the Gaussian (i.e., matched filtration assuming random noise); and, FIG. 3d depicts the spectrum noise-reduced by matched filtration according to the method of FIG. 2 (i.e., using experimentally-determined noise characteristics...

example 2

Mass Accuracy in LC-MALDI-MS Noise-Reduced Data Sets

[0059]FIGS. 6a-6d illustrate the non-distorting character of the disclosed method, even for peaks with low S / N. In this illustrative example, the tryptic digest of a model mixture of 7 proteins (see SAMPLES below, Sample 2) is analyzed by LC-MALDI-MS. Further, the peak list is generated and used for selecting precursor ions for MS / MS analysis, and the results of MS / MS analysis are submitted to the MASCOT™ search engine, which is provided by Matrix Science Ltd., London, England. Thirty-nine peptides are identified. The sample is then diluted 5 times, and 5 standards are added to the matrix solution to provide mass calibration. Due to the combined effect of the dilution and ion suppression caused by the standards, the intensities of the MS peaks are significantly reduced, and only 12 of the 39 peptides identified at the first stage of experiment (high concentration sample) are subsequently detected at the second stage of experiment ...

example 3

Noise Reduction in LC-ESI-MS Data Sets

[0064]FIGS. 8a-8f depict an example of the application of the above-described method to the analysis of LC-ESI-MS data. In the case of 10 spectra averaging (see FIG. 8b), random noise is suppressed, but chemical noise with 1 Da periodicity is higher than in the original spectrum (see FIG. 8a). The noise-reduced spectrum (FIG. 8c) is essentially free of random noise and chemical noise. Peaks at m / z=426.01 and 428.00 are present in both the original spectra (see FIG. 8a) and the 10 averaged spectra (see FIG. 8b), but are absent in the spectrum noise-reduced by the above-described method (see FIG. 8c). As can be seen from the extracted ion chromatograms for these m / z values in FIGS. 8e-8f, the MS peaks are suppressed because they do not correspond to any chromatographic peaks. Rather, they result from the chemical noise due to some impurities of the eluent, and are therefore present in the broad chromatographic time region. The MS peak at m / z=413....


PUM

PropertyMeasurementUnit
concentrationaaaaaaaaaa
dimensionaaaaaaaaaa
liquid chromatography-aaaaaaaaaa

Abstract

An improved system and method of analyzing sample data that increases the reliability of peak (compound) detection and identification in the presence of chemical and / or random noise. The sample analysis system includes a compound-separating unit for separating constituent compounds in a sample mixture, a compound-analyzing unit for identifying and quantitating at least one of the separated compounds, and a computer for acquiring data from the compound-separating and compound-analyzing units, for generating a multi-dimensional data set incorporating the acquired data, for executing an algorithm for reducing noise in the data set and for detecting peaks (compounds) in the noise-reduced data set, and for identifying / quantitating the detected compounds.

Description

CROSS REFERENCE TO RELATED APPLICATIONS [0001] This application claims priority of U.S. Provisional Patent Application No. 60 / 372,155 filed Apr. 12, 2002 entitled PEAK PICKING ALGORITHM FOR LC-MS, and U.S. Provisional Patent Application No. 60 / 440,950 filed Jan. 17, 2003 entitled MATCHED FILTRATION WITH EXPERIMENTAL NOISE DETERMINATION FOR DENOISING, PEAK PICKING AND QUANTITATION IN LC-MS.STATEMENT REGARDING FEDERALLY SPONSORED RESEARCH OR DEVELOPMENT [0002] N / A BACKGROUND OF THE INVENTION [0003] The present application relates generally to chemical analysis, and more specifically to a system and method of analyzing a multi-dimensional data set having a first dimension corresponding to compound separation and a second dimension corresponding to compound spectra for characterizing compounds present in a sample mixture. [0004] Sample analysis techniques are known that may be employed for identifying and quantitating one or more compounds present in a sample mixture. For purposes of il...

Claims


Application Information

Patent Timeline
Patent Type & Authority Applications(United States)
IPC IPC(8): G01NG06F19/00
CPCG01N30/8603G01N30/8617H01J49/004H01J49/0036G06F19/703G16C20/20
Inventor ANDREEV, VICTOR P.REJTAR, TOMASKARGER, BARRY L.
Owner NORTHEASTERN UNIV
Why Eureka
Try Eureka