Methods and compositions for diagnosis, stratification, and monitoring of alzheimer's disease and other neurological disorders in body fluids
- Summary
- Abstract
- Description
- Claims
- Application Information
AI Technical Summary
Benefits of technology
Problems solved by technology
Method used
Image
Examples
example 1
AD Diagnosis Biomarkers
[0182] We compared plasma protein expression levels for 120 proteins in 32 cases of serum collected from patients with Alzheimer's Disease (with a mean age of 74) to 19 cases of serum collected from control subjects (also with mean age of 74). Alzheimer's Disease subjects were clinically diagnosed with AD by a neurologist, and had Mini Mental State Exam (MMSE) scores ranging from 26-14.
[0183] Plasma samples were assayed using a sandwich-format ELISA on a nitrocellulose filter substrate. Plasma samples were diluted 1:10 in phosphate buffer and incubated with the capture substrate (a nitrocellulose membrane spotted with capture antibodies). The samples were incubated with the capture substrate for two hours at room temperature, then decanted from the capture substrate. The substrate was washed twice with 2 ml of washing buffer (1×PBS; 0.05% Tween-20) at room temp, then incubated with biotinylated detection antibodies for two hours at room temperature. The capt...
example 2
Decision Trees from AD Diagnosis Marker Data
[0186] Upon further analysis of the data from example 1, two different decision trees were formulated for diagnosis of AD using AD diagnosis biomarkers.
[0187] The first decision tree utilizes sIL-6R, IL-8, and TIMP-1 levels. The rules which make up the decision tree are: (1) If sIL-6R≦5.18 and IL-8 is ≦0.957, the indication is normal; (2) if sIL-6R≦5.18 and IL-8>0.957, the indication is AD; (3) if sIL-6R>5.18 and TIMP-1≦7.978, the indication is AD; and (4) if sIL-6R>5.18 and TIMP-1 is >7.978, the indication is normal, wherein the values expressed are relative concentrations.
[0188] Accuracy of this decision tree was measured using 10-fold cross-validation testing feature in CART to generate misclassification rates for learning samples and testing samples. Sensitivity was calculated from the testing scores as number of AD samples correctly predicted as AD / total number of AD samples (29 / 32=0.906). Specificity was calculated from the testin...
example 3
Diagnosis of MCI
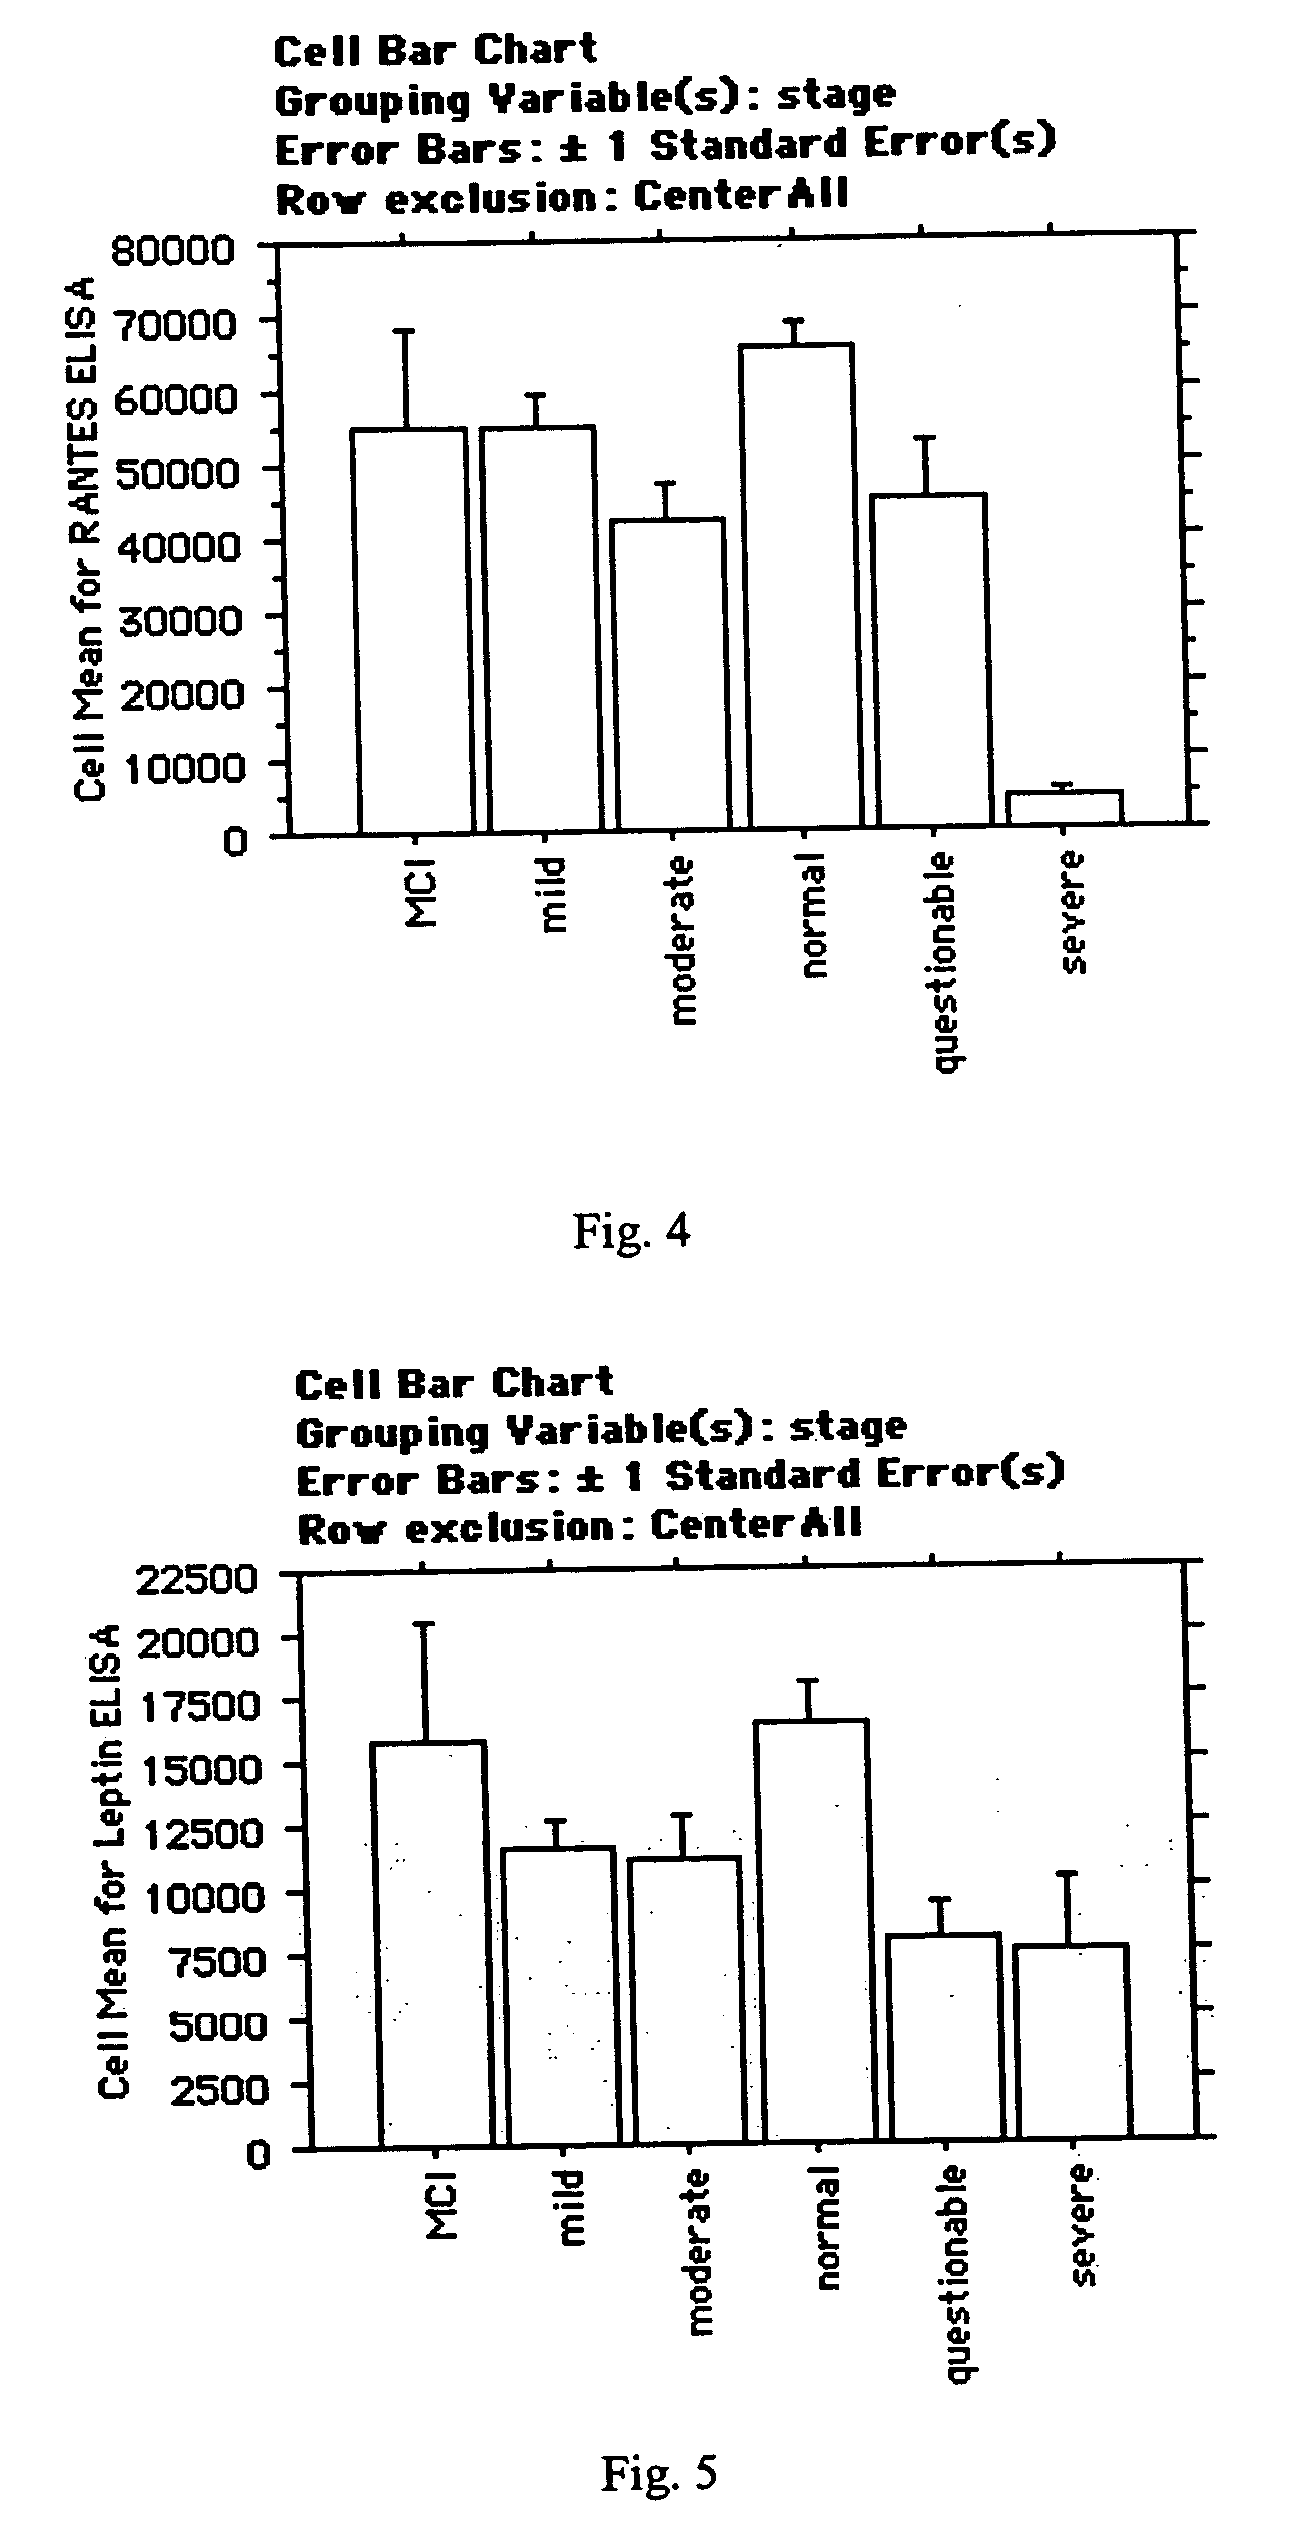
[0190] Levels of RANTES and Leptin were measured in 18 samples from control subjects (mean age=74) and 6 samples from patients diagnosed with mild cognitive impairment (MCI). MCI patients had been clinically diagnosed by a neurologist, and had an AULT-A7 score of less than 5 and Mini Mental State Exam (MMSE) scores ranging from 30-28. Control subjects had an AULT-A7 score greater than or equal to 5 and MMSE score ranging from 30-28.
[0191] RANTES and Leptin levels were measured using an ELISA kit from R&D systems according to the manufacturer's instructions. The raw ELISA expressions values were normalized by dividing each value by the median of all the samples. Analysis of the data showed (a) Leptin is not decreased in MCI patients as compared to control subjects (in the six MCI samples, Leptin was actually 11% higher than the control subjects), and (b) a bimodal distribution of RANTES, where MCI patients had RANTES levels of between 1.043 and 1.183 (levels from co...
PUM
| Property | Measurement | Unit |
|---|---|---|
| Fraction | aaaaa | aaaaa |
| Fraction | aaaaa | aaaaa |
| Fraction | aaaaa | aaaaa |
Abstract
Description
Claims
Application Information
 - R&D
- Intellectual Property
- Life Sciences
- Materials
- Tech Scout
- Unparalleled Data Quality
- Higher Quality Content
- 60% Fewer Hallucinations
Browse by: Latest US Patents, China's latest patents, Technical Efficacy Thesaurus, Application Domain, Technology Topic, Popular Technical Reports.
© 2025 PatSnap. All rights reserved.Legal|Privacy policy|Modern Slavery Act Transparency Statement|Sitemap|About US| Contact US: help@patsnap.com


