Method to measure a t cell response and its uses to qualify antigen-presenting cells

a t cell response and antigen-presenting cell technology, applied in the field of t cell response measurement and its use to qualify antigen-presenting cells, can solve the problems of naive or experienced, difficult to describe the response to this antigen quantitatively, and difficulty in evaluating the repertoire of t cells, etc., to achieve the effect of measuring the effectiveness of complex cross-talk and increasing sensitivity

Inactive Publication Date: 2006-07-20
TRUSTEES OF DARTMOUTH COLLEGE THE +1
View PDF0 Cites 4 Cited by
  • Summary
  • Abstract
  • Description
  • Claims
  • Application Information

AI Technical Summary

Benefits of technology

[0038] An advantage of the invention is that it allows identification of different T lymphocytes subsets.
[0039] Another advantage of the method is that it allows for an estimate of the precursor proportion of each functional subset of T lymphocytes, defined by the parameters used in the measurement (such as proliferation, T cell antigen receptor, cytokine secretion) within the initial population. It could be applied to additional markers of function and differentiation (such as determinant surface markers different from T cell antigen receptor, enzymes secretion, chemokines secretion), combining all those parameters into a description of the complex response potential of a T-cell pool.
[0040] One advantage of the invention is that it benefits from sub-population expansion to increase the sensitivity for detecting rare responsive cells and for calculating the precursor frequencies of sub-population in the original mixture of cells.
[0041] For example, this new method allows detection of some rare precursors being able to produce cytokine such as IFN-γ but that do not expand. These results indicate that some CD8+ T cells do not require clonal expansion in vitro to produce cytokine such as IFN-γ. Thus, the new method could be used to compare the frequency of these precursors in various populations of effector / memory T cells (Sallusto et al. 1999 Nature. 401:708-712).
[0042] An advantage is that, because the method involves the calculation of precursors frequencies, the method is not biased by the length of culture time and by the expansions of certain cell population.
[0043] Another advantage of the invention is that it allows to describe an original population of resting T lymphocytes or precursors (before culture) in terms of its ability to react in different ways to antigen stimulation. This in turn could be used to characterize a composition of APCs loaded with an antigen, or a fragment of antigen, in term of capacity of the APCs to activate a particular subset of T lymphocytes. The method measures the effectiveness of the complex cross-talk from APCs to T lymphocytes and from T lymphocytes to APCs when a specific antigen is presented or a particular APC is used.

Problems solved by technology

A major drawback of the method is that it gives information about a global population and may not help to distinguish the different subtypes of T cells that may respond differentially to a given stimulus resulting from co-incubation with APCs.
Because of the small proportion of cells that respond to any specific antigen, describing the response to this antigen quantitatively is difficult.
The difficulty in evaluating the repertoire of T cells, naive or experienced, that can potentially respond to a given antigen relates to the diversity of the T cell clones, to the low frequency of these clones, and to the pattern of effector functions shaped by previous antigenic challenge.
Indeed, because of the exponential expansion of specific T cells, observation of cells without tracking molecules by flow cytometry after several days of culture is misleading.

Method used


Image

  • Method to measure a t cell response and its uses to qualify antigen-presenting cells
  • Method to measure a t cell response and its uses to qualify antigen-presenting cells
  • Method to measure a t cell response and its uses to qualify antigen-presenting cells

Examples


example 1

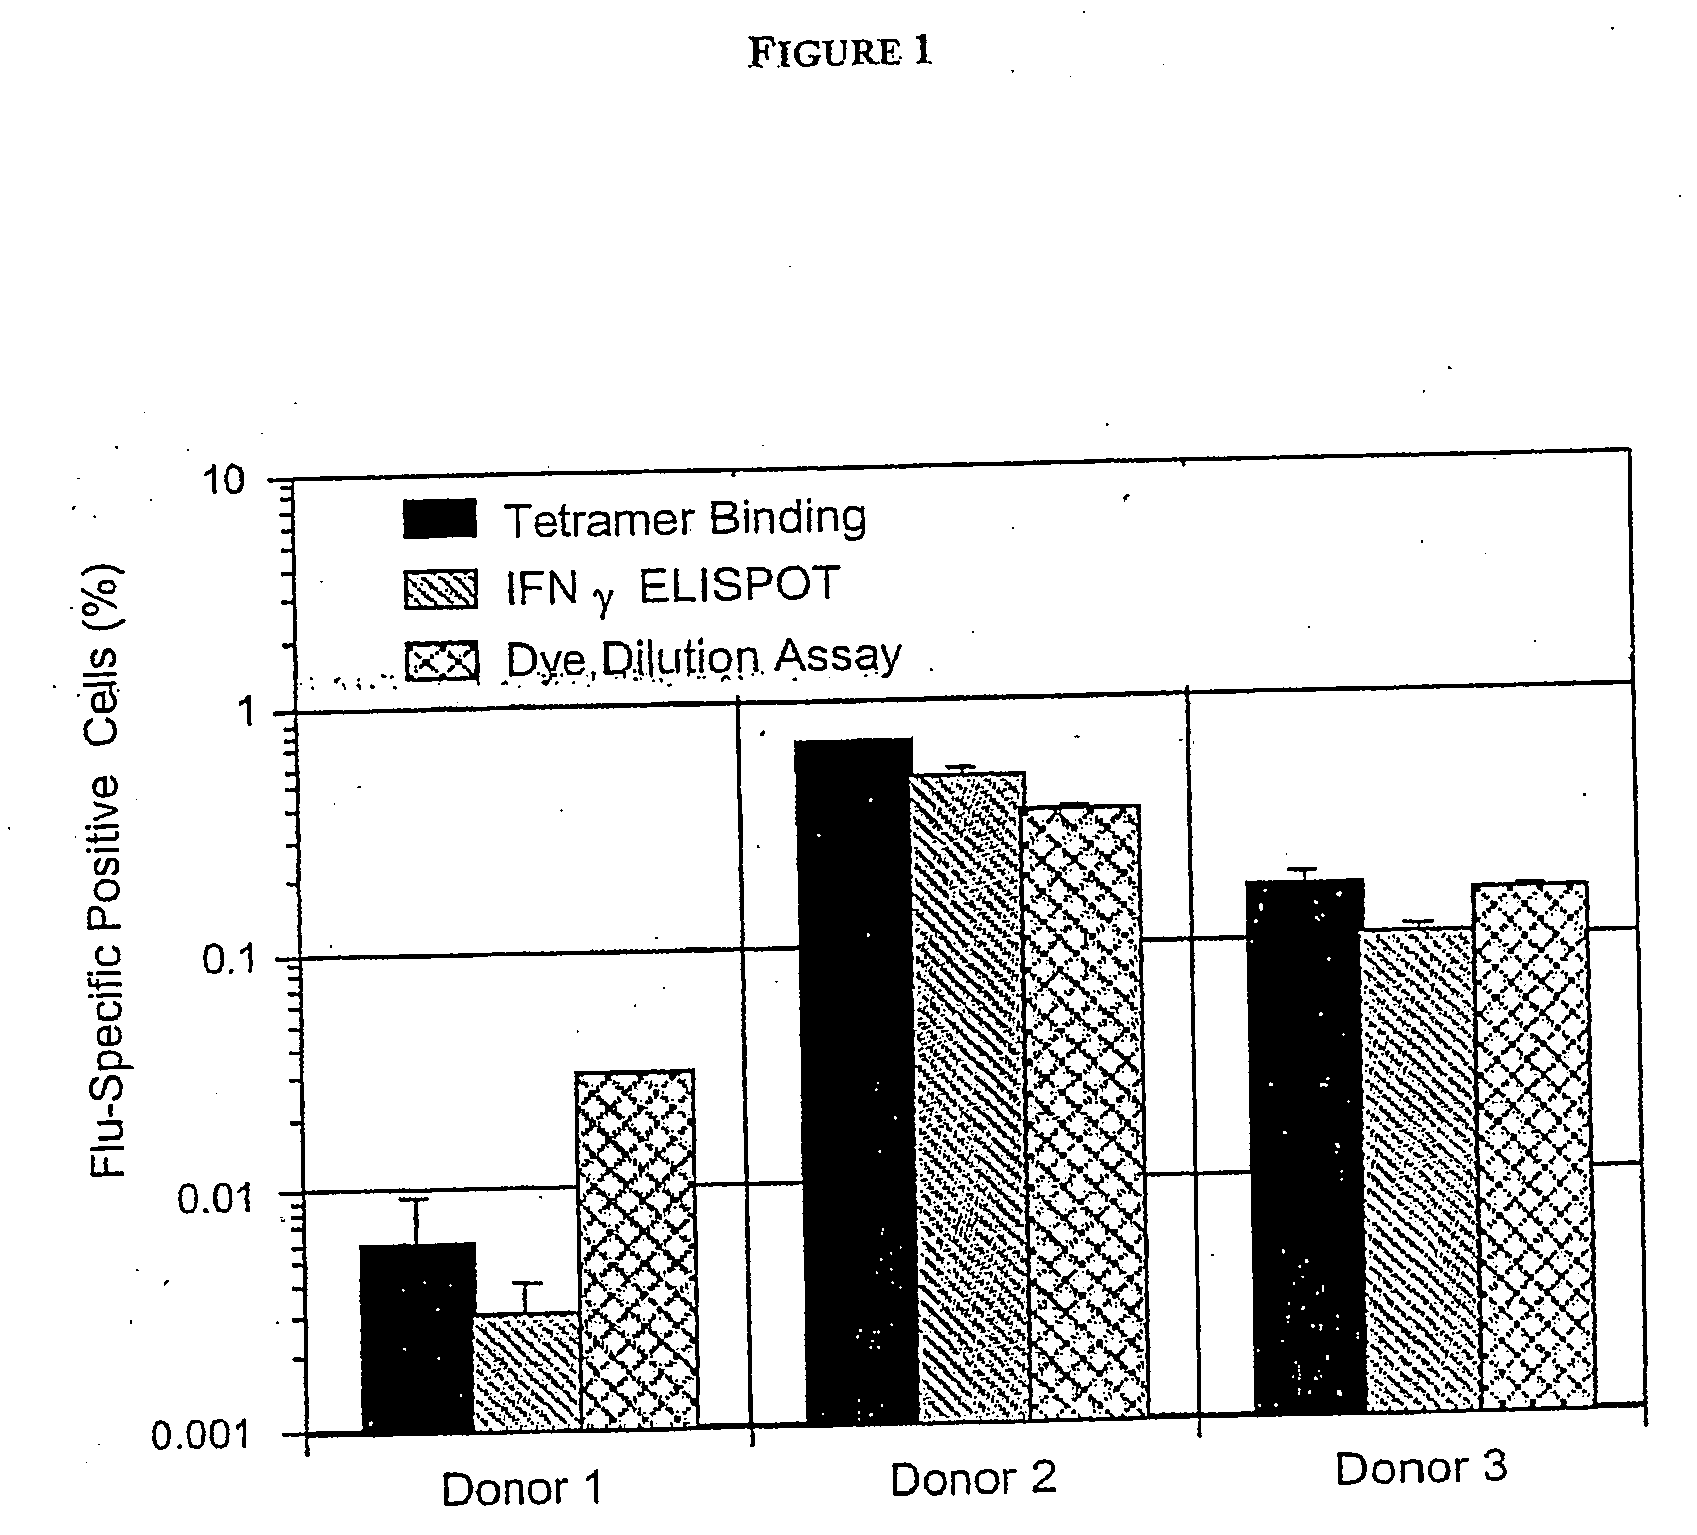
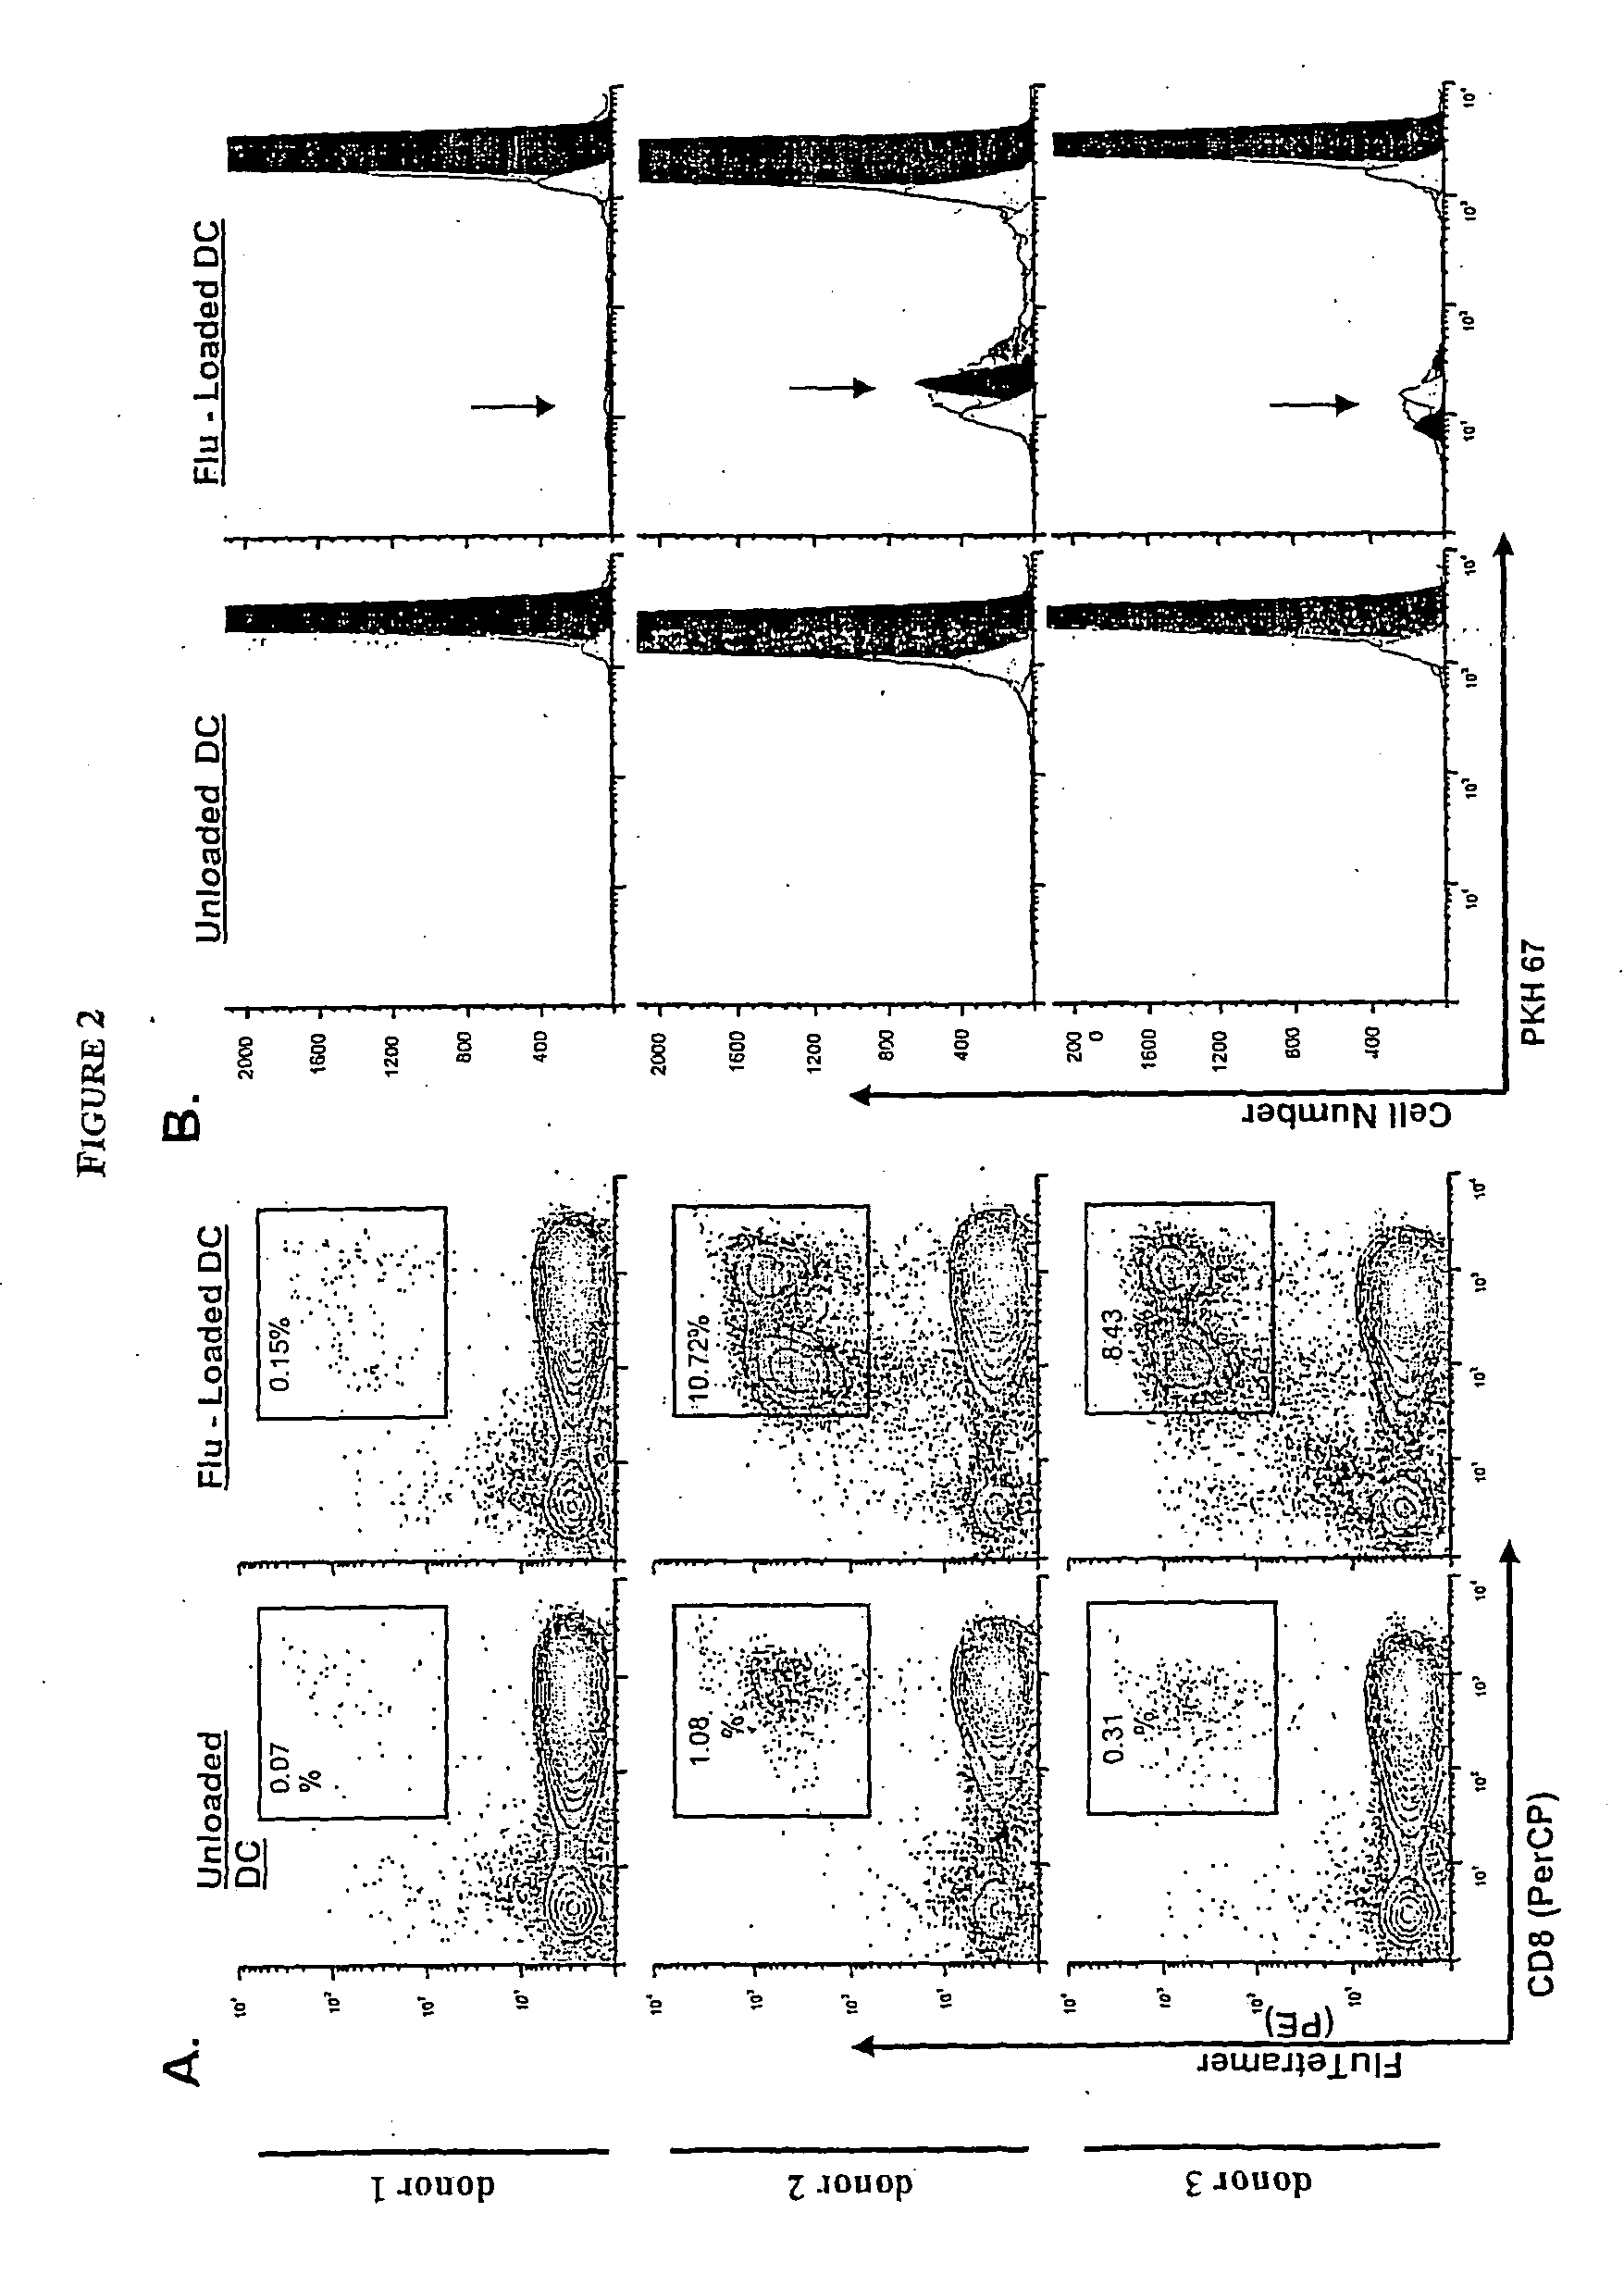
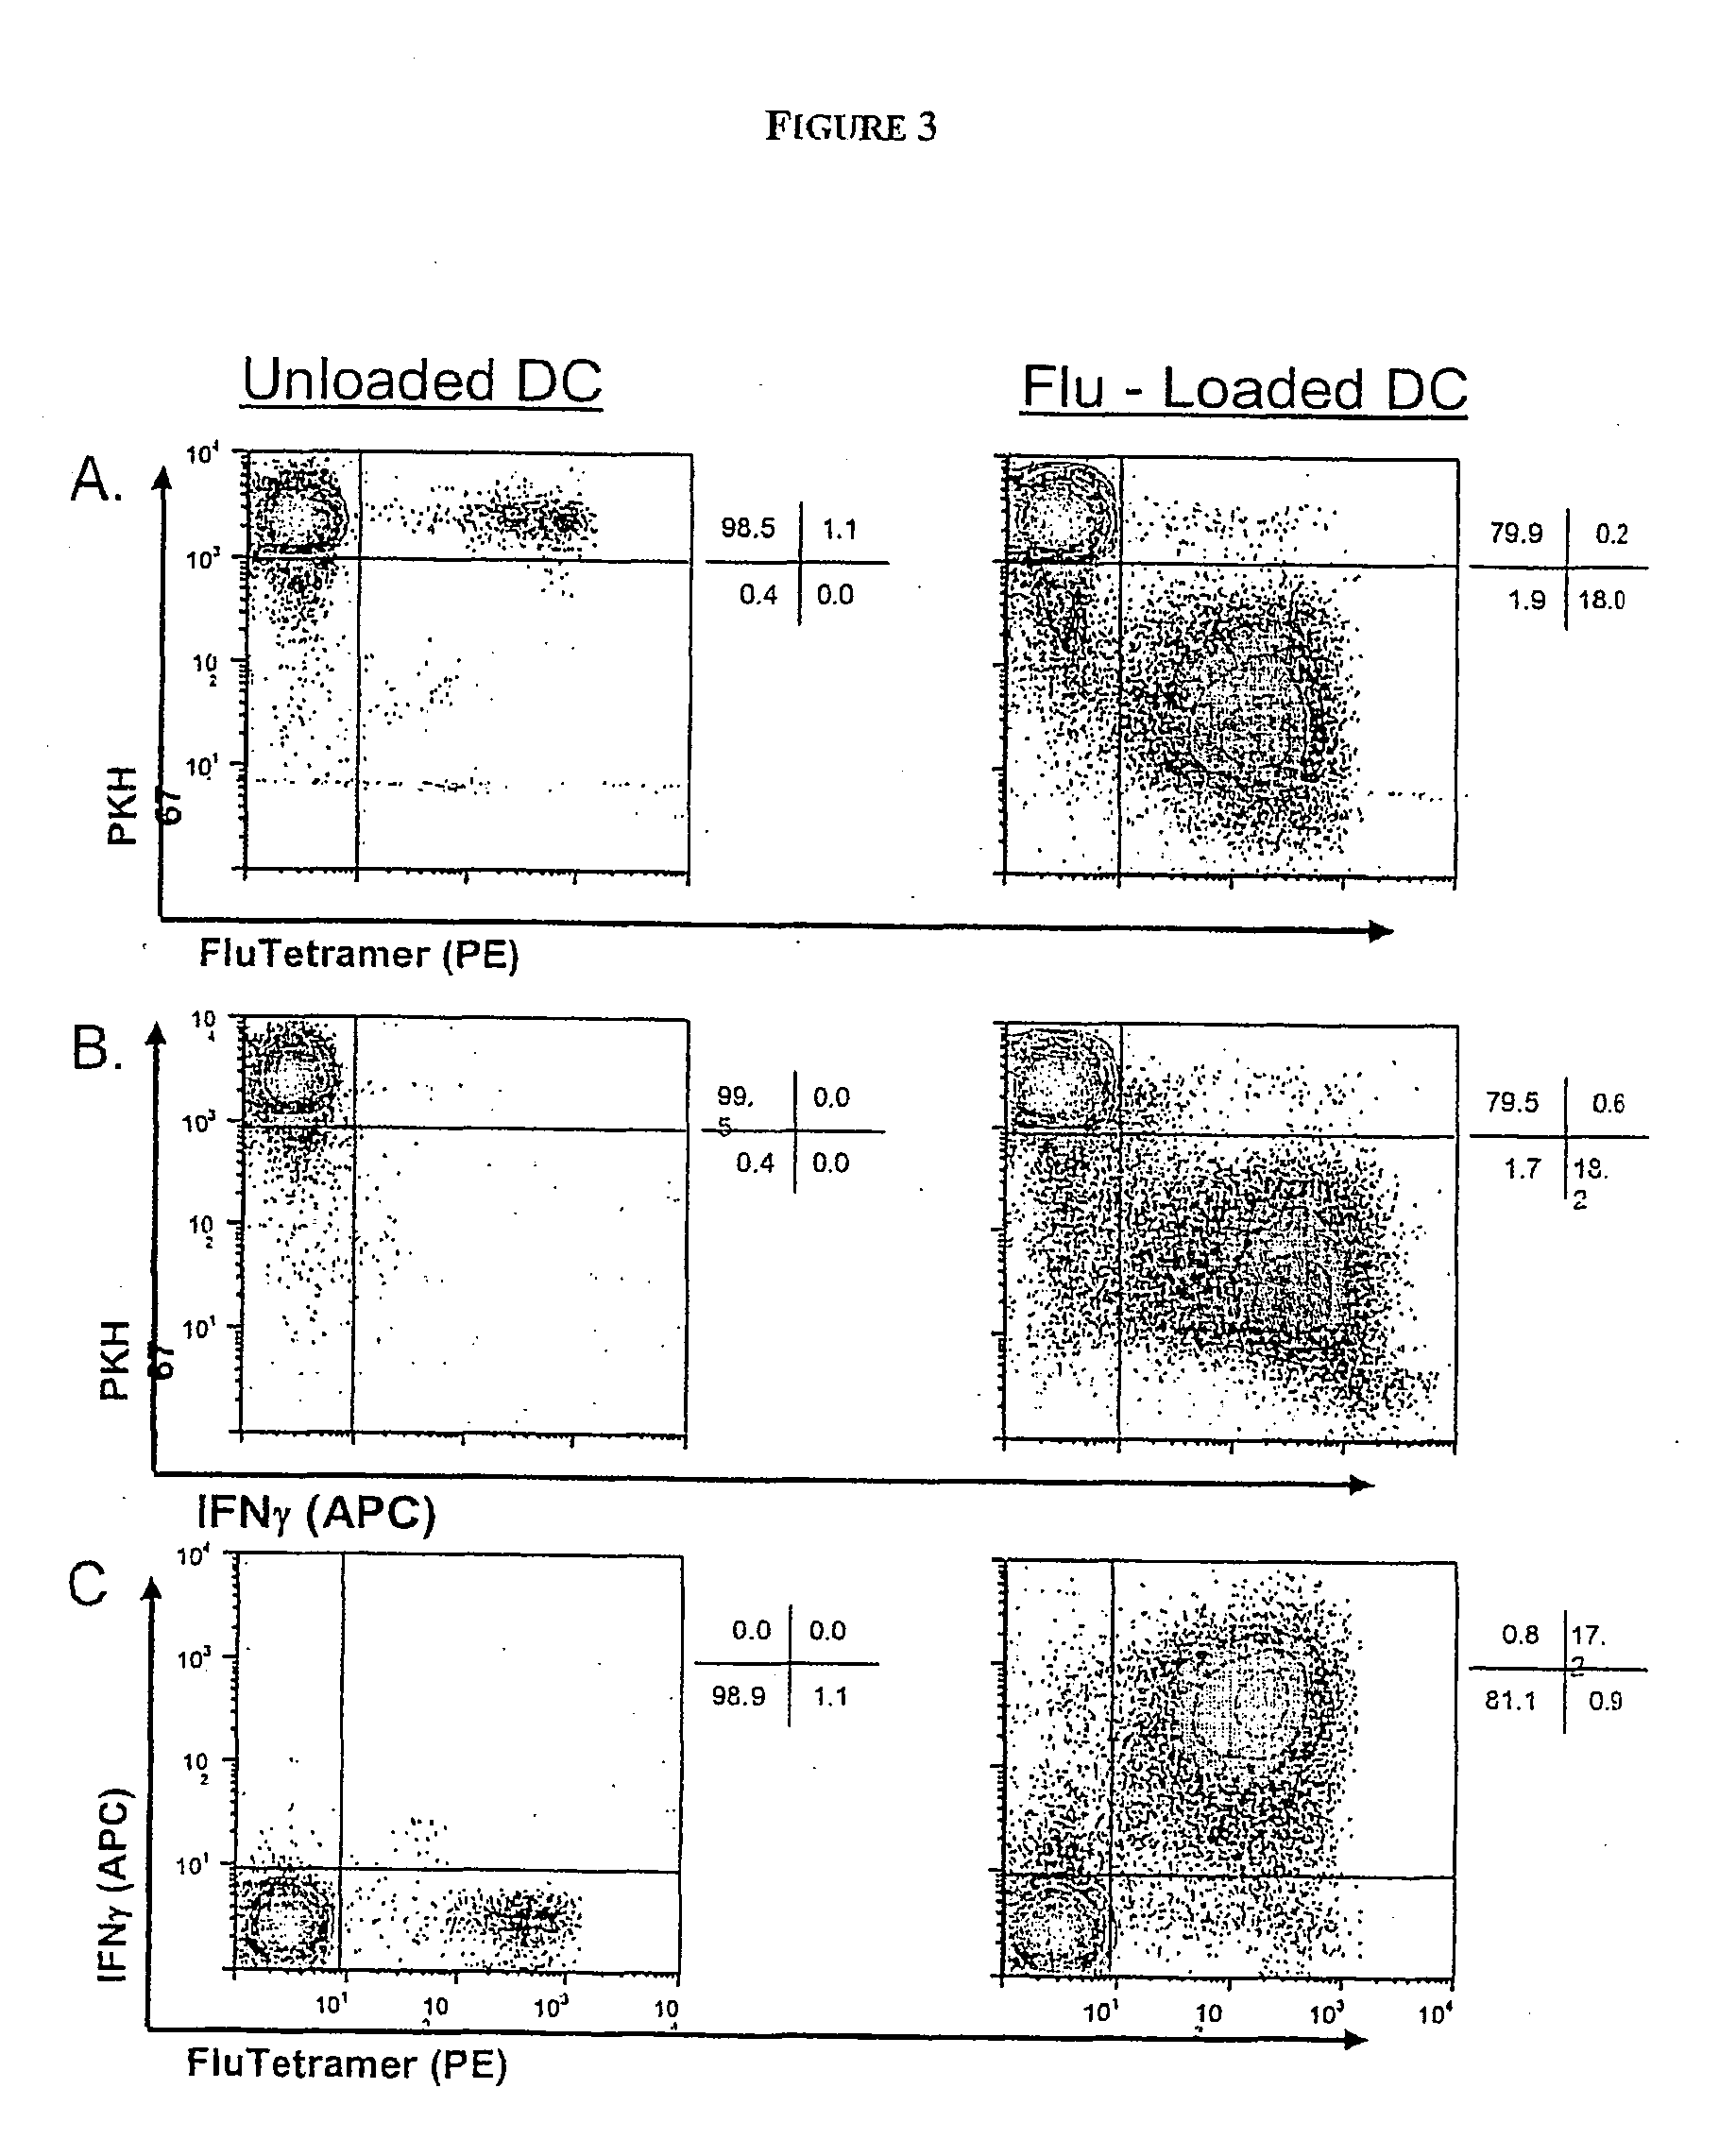
[0272] Here we illustrate the method according to the invention, based on multiparameter flow cytometry, to visualize simultaneously proliferation and cytokine production by T cells having different capacities to bind MHC / peptide tetramers; this method also allows calculations of the original frequency of these sub-populations of cells ex vivo.

[0273] Antigens encountered by T cells affect their proliferation potential and drive acquisition of effector functions including cytokine synthesis and cytolytic activity as well as long term survival (Lanzavecchia and Sallusto, Science 2000. 290: 92-97; Champagne et al., Nature 2001. 410: 106-111; Kaech et al., Nat Rev Immunol 2002. 2: 251-262). Enumeration and characterization of antigen-specific T cells is, however, limited by the low frequency of precursors detectable ex vivo and also by the particular readout chosen to identify a T cell as specific for any particular antigen.

[0274] The generation of MHC / peptide tetrameric complexes (Al...

example 2

[0316] The present work compares different populations of memory CD8 T cells, one specific for a viral epitope and one specific for the differentiation antigen MART1, in their capacity to proliferate, in order to identify potential differences between viral and tumor specific CD8 T cell populations.

MATERIAL AND METHODS

[0317] Peptides and Tetramers

[0318] Peptides presented by HLA-A*0201 molecules were used: Melan-A MART1 (ELAGIGILTV 26-35 (27L), Neosystem) and influenza matrix protein (GILGFVFTL 58-66, Cybergene). Phycoerythrin (PE)-labeled HLA-A*0201 tetramers contained the following peptides: Melan-A 26-35(27L) and influenza matrix protein 58-66 and were purchased from Proimmune, (Oxford, GB), and Beckman Coulter Immunomics (San Diego, Calif.) as were PE-labeled A*0201 / HIV gag (SLYNTVATL) tetramer, used as a negative control.

[0319] Patients Samples

[0320] Aphaeresis were collected from HLA-A*0201 melanoma patients included in phase I / II clinical trial.

[0321] Dendritic Cell Dif...

example 3

[0330] The present work compares different populations of memory CD8 T cells specific for viral epitopes in their capacity to proliferate. We asked whether particular T cell subsets can be identified.

MATERIAL AND METHODS

[0331] The experiments were carried out as described in example 2

[0332] Peptides and Tetramers

[0333] Different peptides, presented by HLA-A*0201 molecules, were used: CMV pp65 (NLVPMVATV, 495-503, Neosystem, Strasbourg, France); EBV BMLF1 (GLCTLVAML 280-288, Cybergene, Huddinge, Sweden) and EBV LMP2a (CLGGLLTMV 426-434, Cybergene). Phycoerythrin (PE)-labeled HLA-A*0201 tetramers contained the following peptides: EBV BMFL1 280-288, EBV LMP2 426-434 and CMV pp65 495-503 and were purchased from Proimmune, (Oxford, GB), and Beckman Coulter Immunomics (San Diego, Calif.) as were PE-labeled A*0201 / HIV gag (SLYNTVATL) tetramer, used as a negative control.

[0334] Healthy Volunteers

[0335] Aphaeresis were collected from HLA-A*0201 healthy donors

[0336] Dendritic Cell Diff...


PUM

PropertyMeasurementUnit
timeaaaaaaaaaa
timeaaaaaaaaaa
timeaaaaaaaaaa

Abstract

A method to characterize a T-cell response of a final population of T-lymphocytes resulting from the co-incubation of an initial population of T lymphocytes with a composition of antigen-presenting cells (APCs), said method comprising the steps of a) simultaneous measuring on a single cell basis at least two parameters: (i) proliferation of T lymphocytes and (ii) presence of a T cell antigen receptor on the surface of T lymphocytes and / or presence of at least one biological molecule produced by T lymphocytes, and the attribution of a positive or a negative value to each of these parameters, and b) classification of the final T-lymphocytes population into 2n different subsets of T lymphocytes, n being the number of parameters, each subset being characterized by a positive or a negative value respectively to each parameter and the determination of the proportion of T lymphocytes present in each subset with respect to the number of T lymphocytes in the final population, with said proportion being characteristic of the T-cell response. Use of the method for batch release assay and potency assay.

Description

FIELD OF THE INVENTION [0001] The present invention relates to a new method to characterize a T-cell response of a final population of T lymphocytes resulting from the co-incubation of a composition of antigen-presenting cells (APCs) with an initial population of T lymphocytes. The present invention also relates to the use of the new method to qualify APCs. BACKGROUND AND PRIOR ART OF THE INVENTION [0002] All the patent applications and articles are included herein for references. [0003] Antigen-presenting cells (APCs) play a crucial role in controlling the initiation and orientation of Ag-specific immune responses. The influence of APCs maturation on T cell recruitment, activation, expansion and functional differentiation is currently widely investigated. A classical method to evaluate the capacity of APCs to recruit and expand T cells is the nixed lymphocytes reaction (MLR). This method rests upon the mixture in co-culture of T-cells and APCs originating from two different persons...

Claims


Application Information

Patent Timeline
Patent Type & Authority Applications(United States)
IPC IPC(8): G01N33/567G01N33/50
CPCG01N33/505G01N33/5094G01N33/56972
Inventor ABASTADO, JEAN-PIERREBERCOVICI, NADEGEERNSTOFF, MARC S.GIVAN, ALICE L.NARDIN, ALESSANDRAMAGGUILLI BORN SALCEDO, MARGARITAWALLACE, PAUL K.
Owner TRUSTEES OF DARTMOUTH COLLEGE THE
Why Eureka
Try Eureka