Apparatus and method for classifying multi-dimensional biological data
a multi-dimensional biological data and apparatus technology, applied in the field of apparatus and methods for classifying multi-dimensional biological data, to achieve the effect of reducing the value of a loss function
- Summary
- Abstract
- Description
- Claims
- Application Information
AI Technical Summary
Benefits of technology
Problems solved by technology
Method used
Image
Examples
example 1
Construction of Reference Gene Expression Dataset
[0245] In vivo short-term repeat dose rat studies were conducted on over 580 test compounds, including marketed and withdrawn drugs, environmental and industrial toxicants, and standard biochemical reagents. The data from these in vivo experiments was used to form the basis of a comprehensive chemogenomic reference database (“DrugMatrix™”) that also includes data from the clinical chemistry and hematology experiments and information extracted from the literature. The construction of this database is described in U.S. application Ser. No. 10 / 854,609 filed May 24, 2004, which is hereby incorporated by reference for all purposes. This chemogenomic reference database was used in the following Example to provide the expression dataset from which classification functions were derived according to the various loss finctions.
[0246] Briefly, rats (three per group) were dosed daily at either a low or high dose. The low dose was an efficaciou...
example 2
Classification of Gene Expression Data Using Various Loss Functions
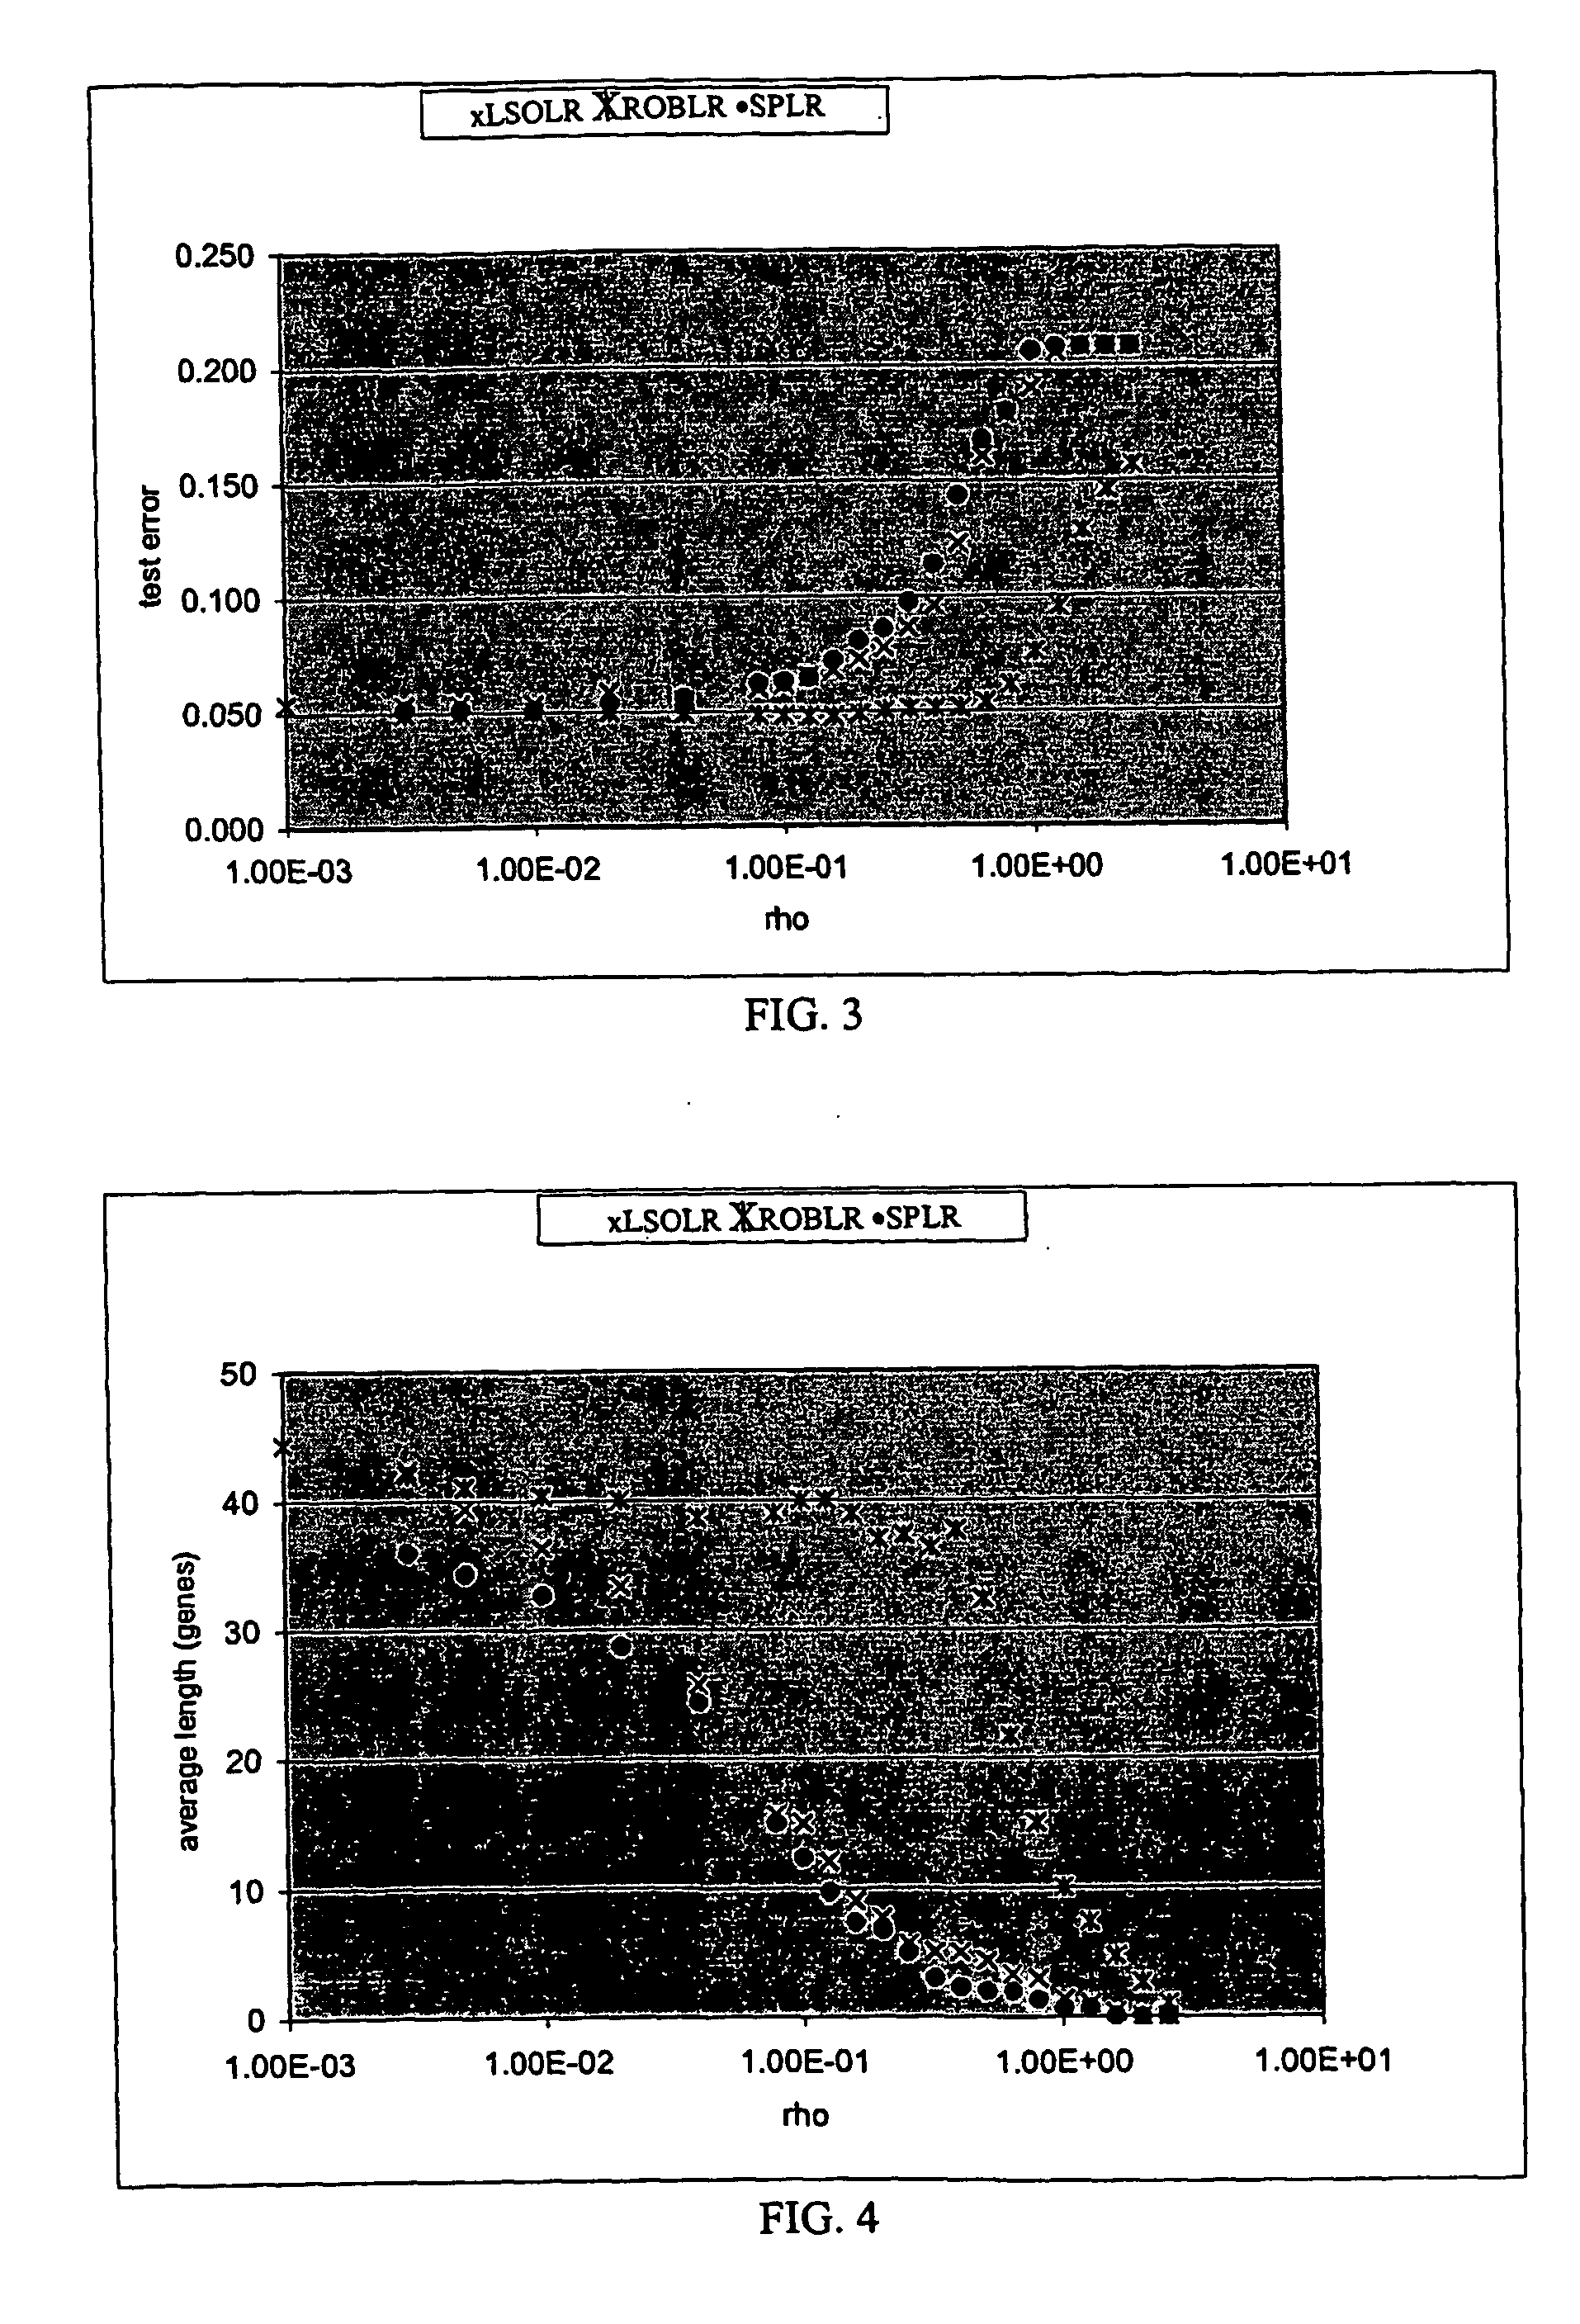
[0247] Numerical experiments were performed on data from a chemogenomic gene expression dataset made according to Example 1. The objective of the numerical experiments was to derive sparse classifiers (i.e. classifiers comprising a relatively small number of genes) that were useful for distinguishing three particular classes of compounds from other compounds with good performance. The three compound classes for which classifiers were derived are: fibrates, statins and azoles.
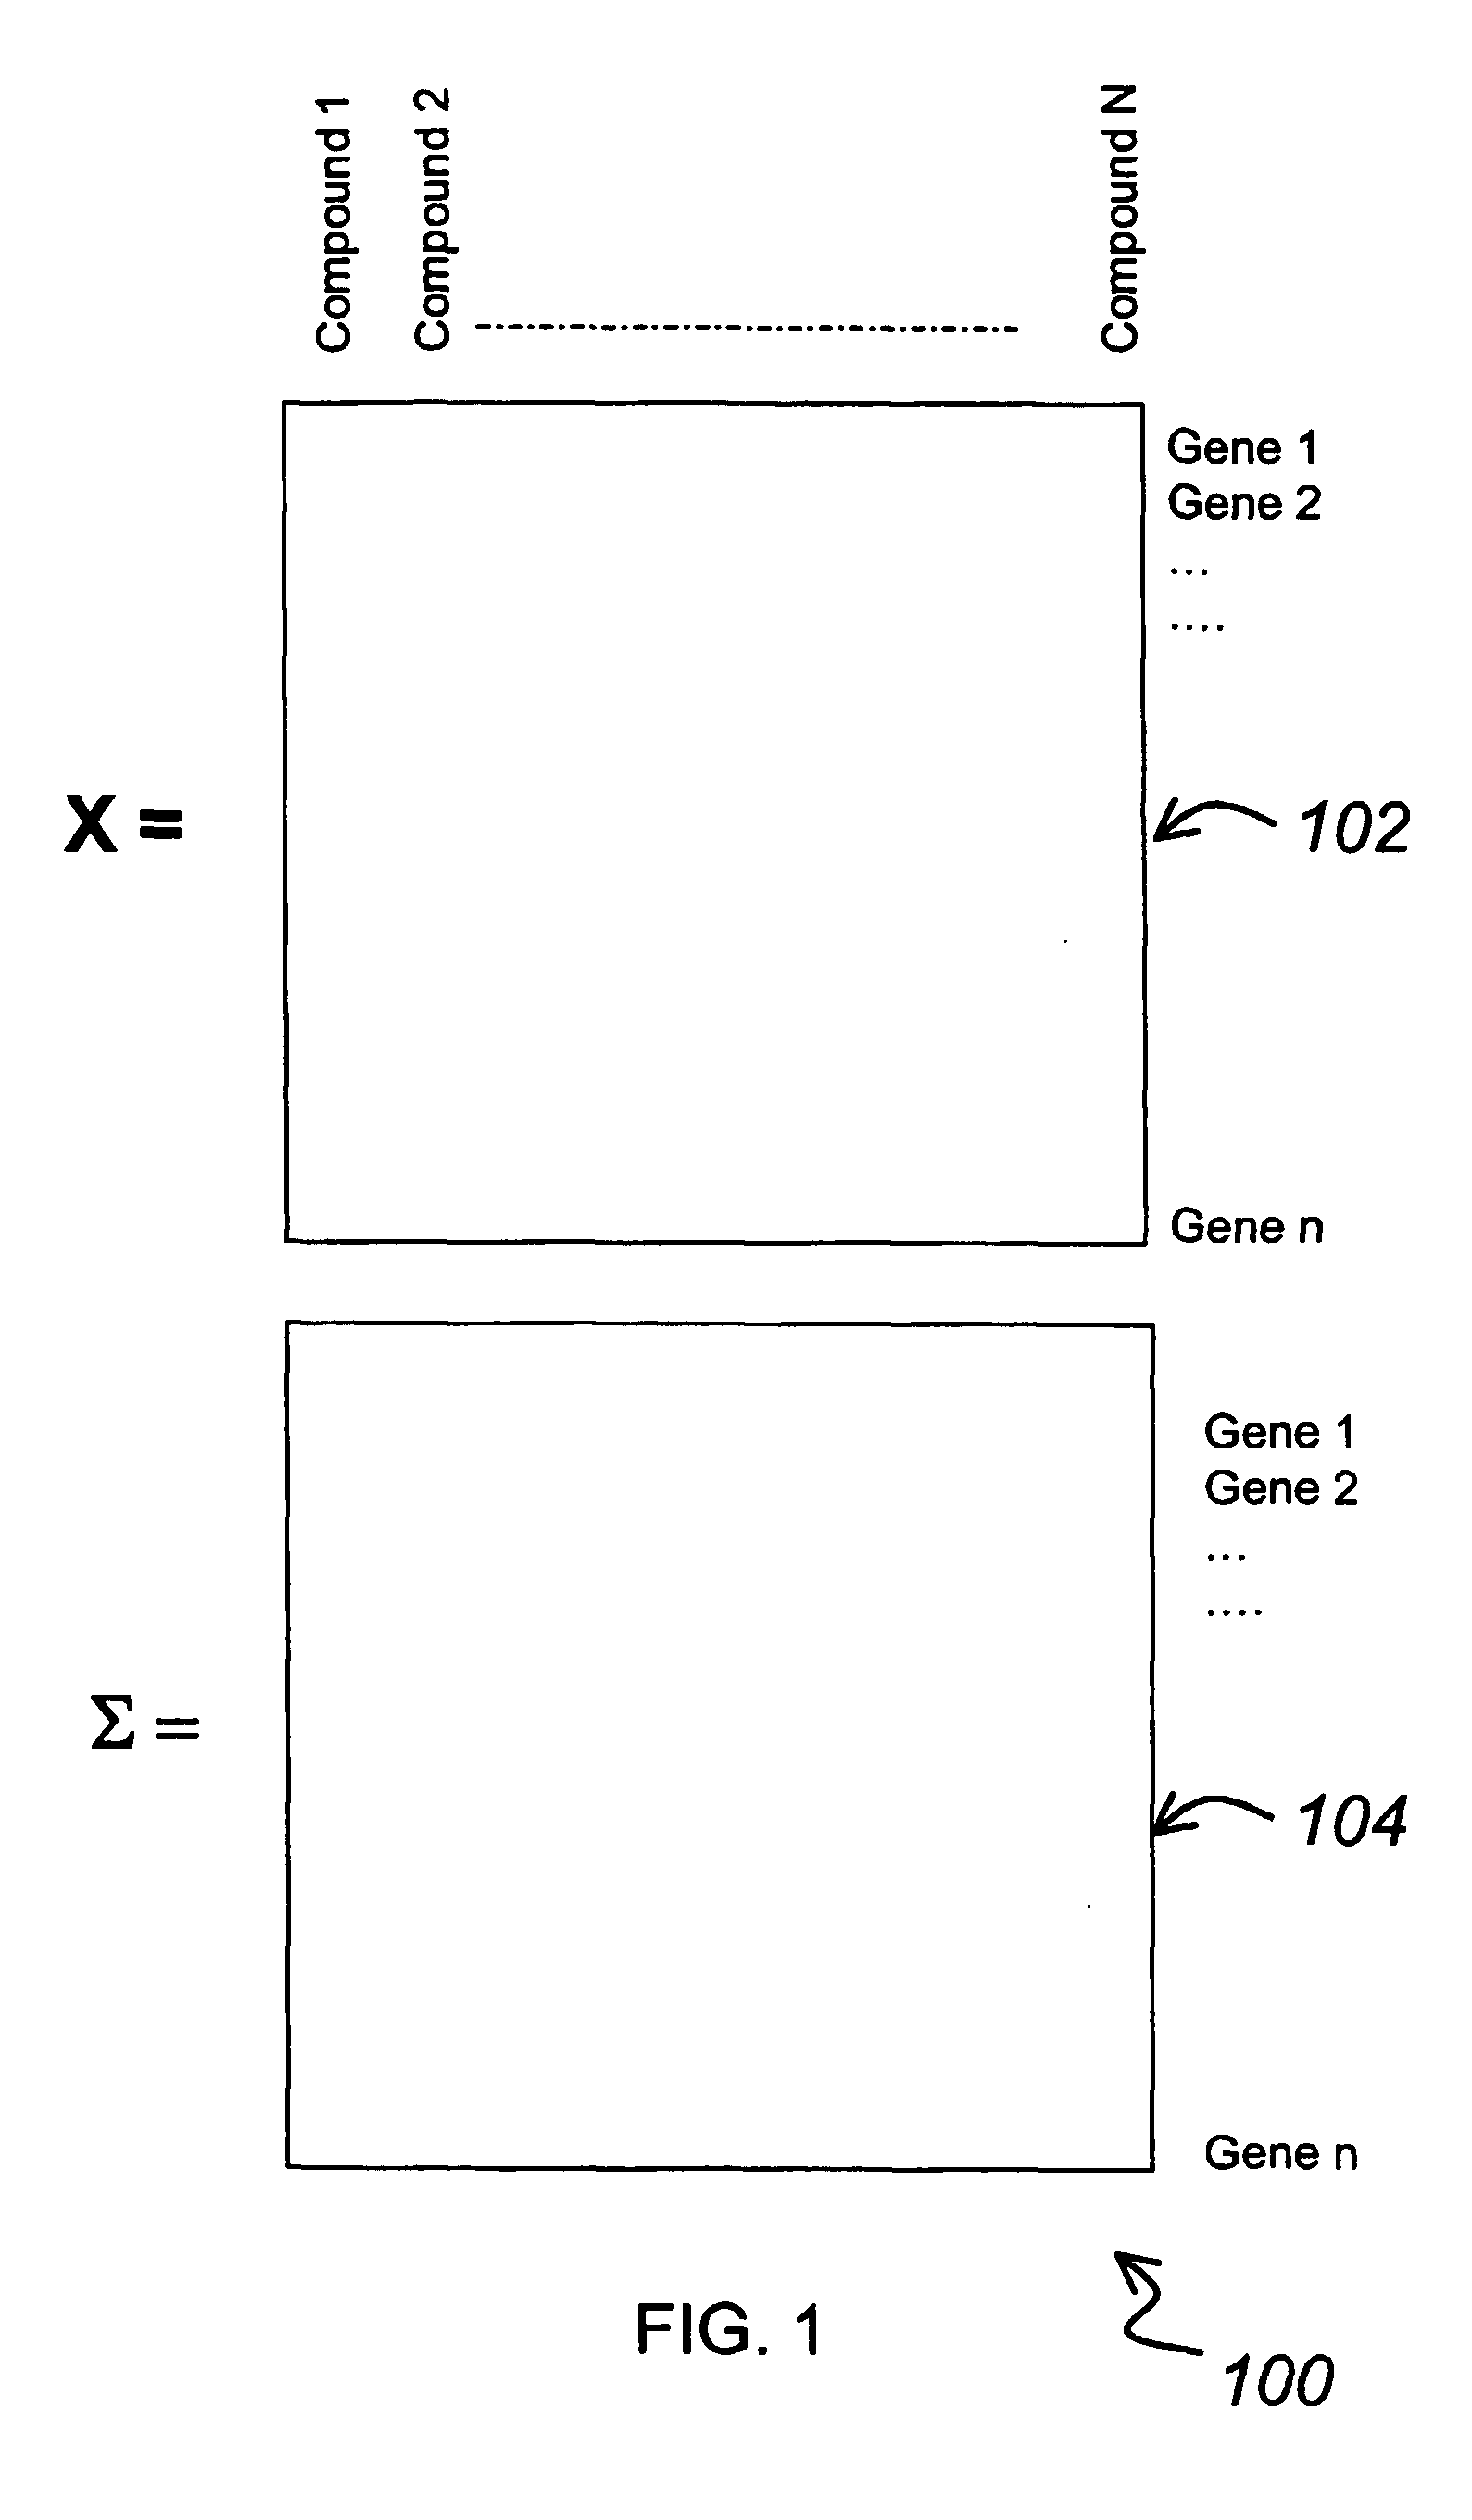
[0248] The gene expression data was assembled into a training set based on a matrix Xand a matrix Σ (i.e. matrices of the type described in FIG. 1). The matrix X included logarithm of ratios of gene expression levels relative to baseline gene expression levels for n=8565 genes and N=194 compounds. The matrix Σ included standard deviations associated with 3 measurements for each compound.
[0249] Three different labeling vectors were used in con...
PUM
| Property | Measurement | Unit |
|---|---|---|
| Biological properties | aaaaa | aaaaa |
| Efficiency | aaaaa | aaaaa |
| Gene expression profile | aaaaa | aaaaa |
Abstract
Description
Claims
Application Information
 - R&D
- Intellectual Property
- Life Sciences
- Materials
- Tech Scout
- Unparalleled Data Quality
- Higher Quality Content
- 60% Fewer Hallucinations
Browse by: Latest US Patents, China's latest patents, Technical Efficacy Thesaurus, Application Domain, Technology Topic, Popular Technical Reports.
© 2025 PatSnap. All rights reserved.Legal|Privacy policy|Modern Slavery Act Transparency Statement|Sitemap|About US| Contact US: help@patsnap.com


