[0007] A real-time interactive
data analysis management and review tool for managing
disease and / or pathology
response to treatment or therapy is presented. The invention involves the archival of quantitative analytics data for the purpose of immediate or long term retrieval for comparative review over time and the display of current quantitative analytic data in a
usable format that offers quick comparisons to previous quantitative analytic data for informed
patient management. The
usable format may be displayed in tabular or graphical layouts. The tool can be incorporated in the clinician reading
workflow to be positioned between analysis image review and structured patient reporting. Positioning in this manner will allow direct interaction between these two important reading
workflow processes. By selecting and clicking on a localizer image, the tool will automatically hotlink to analysis review and display the image of interest in a primary focused
viewport. Conversely, the physician will be able to propagate to the
patient report one or more graphs or analytical data deemed related for report archival. The invention also includes an electronic
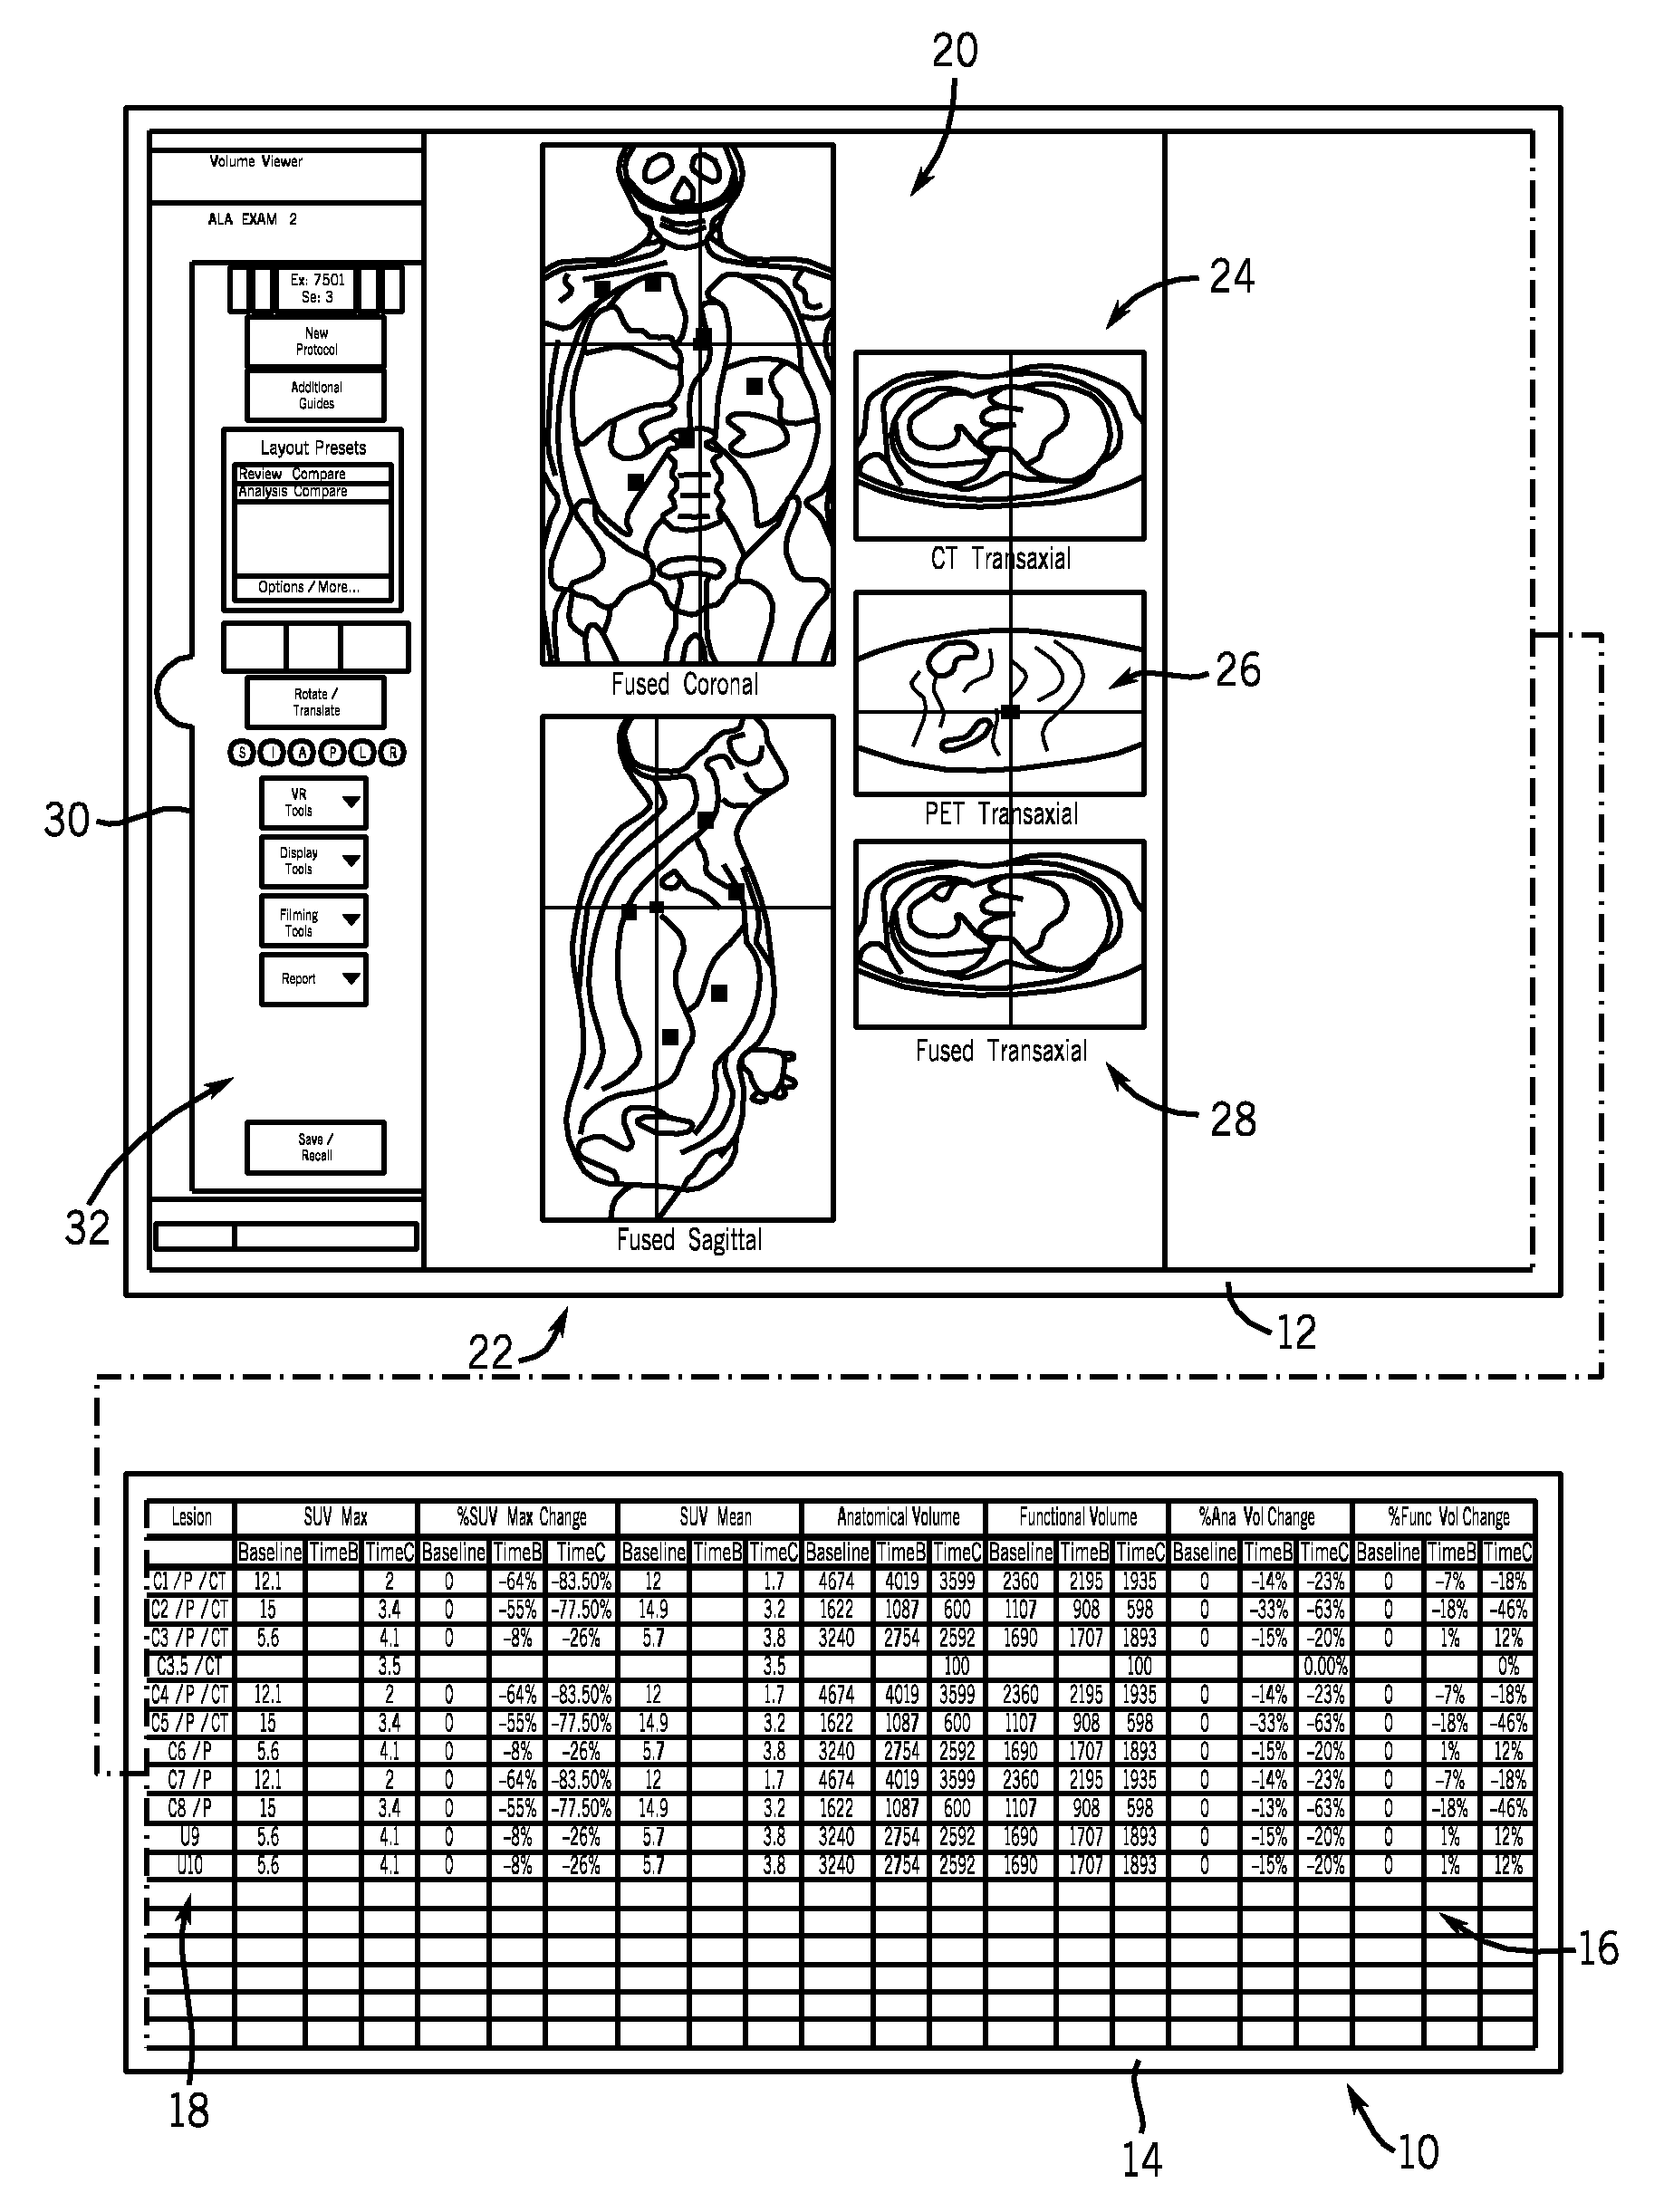
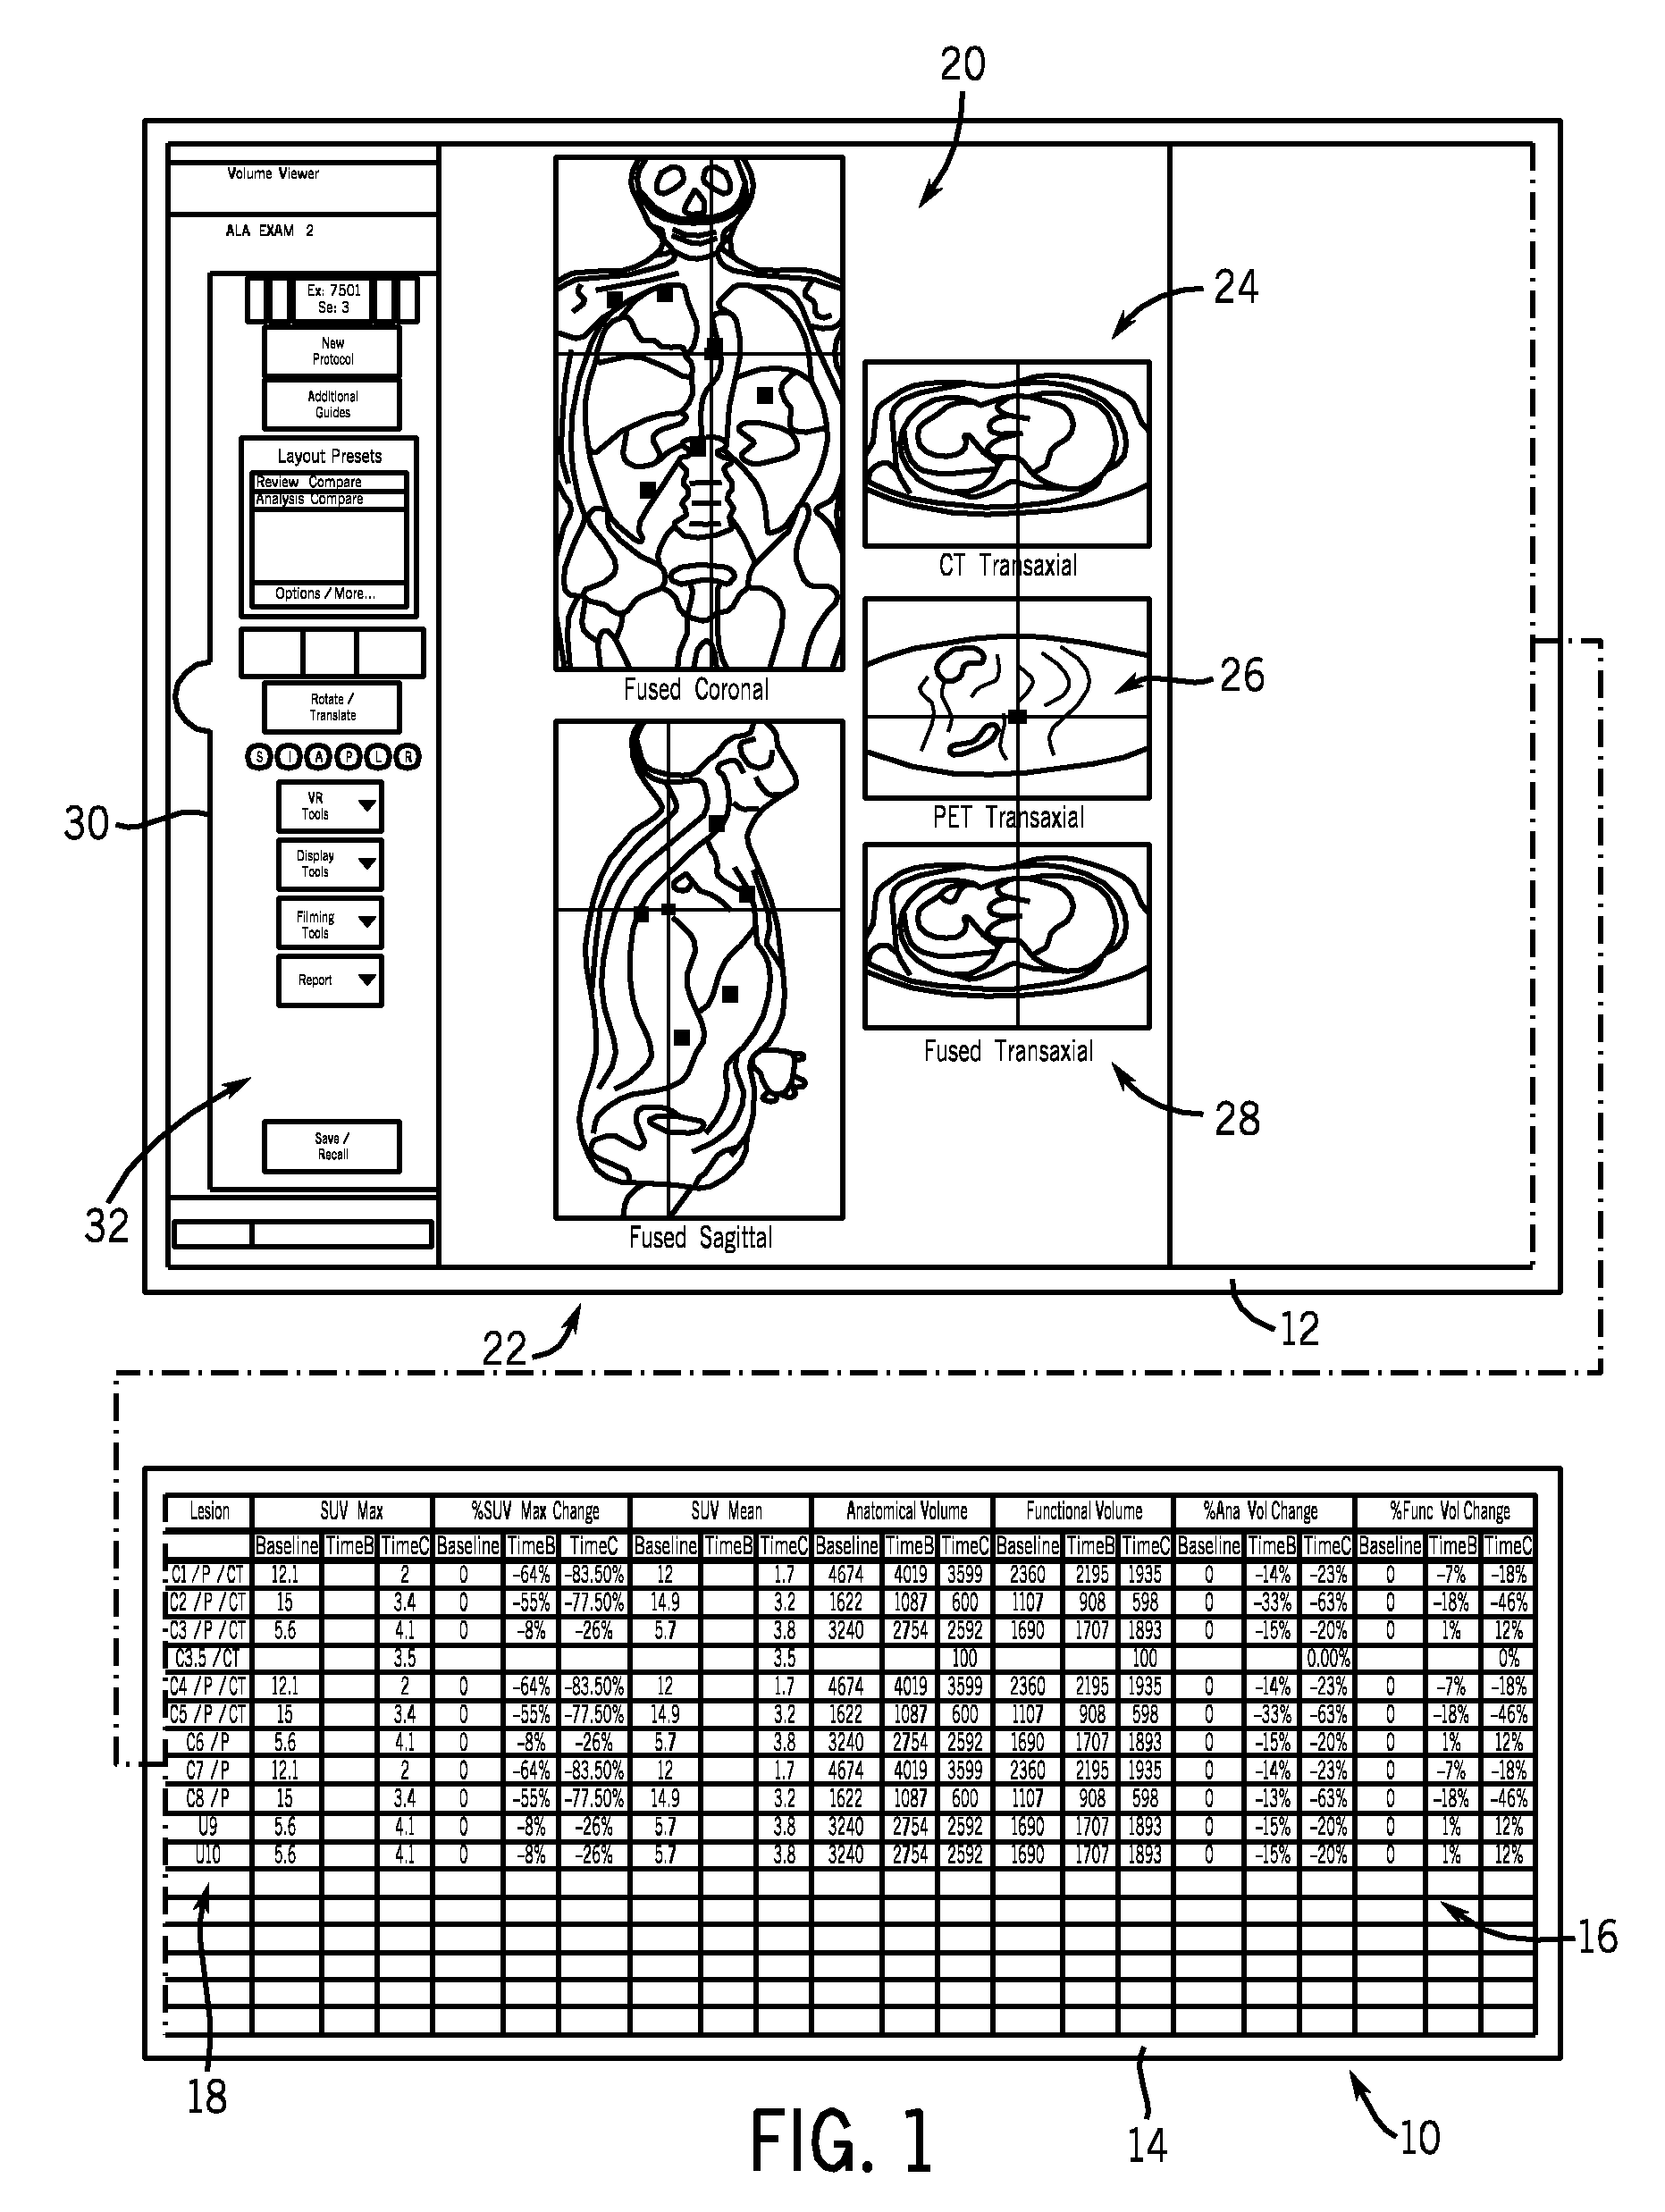
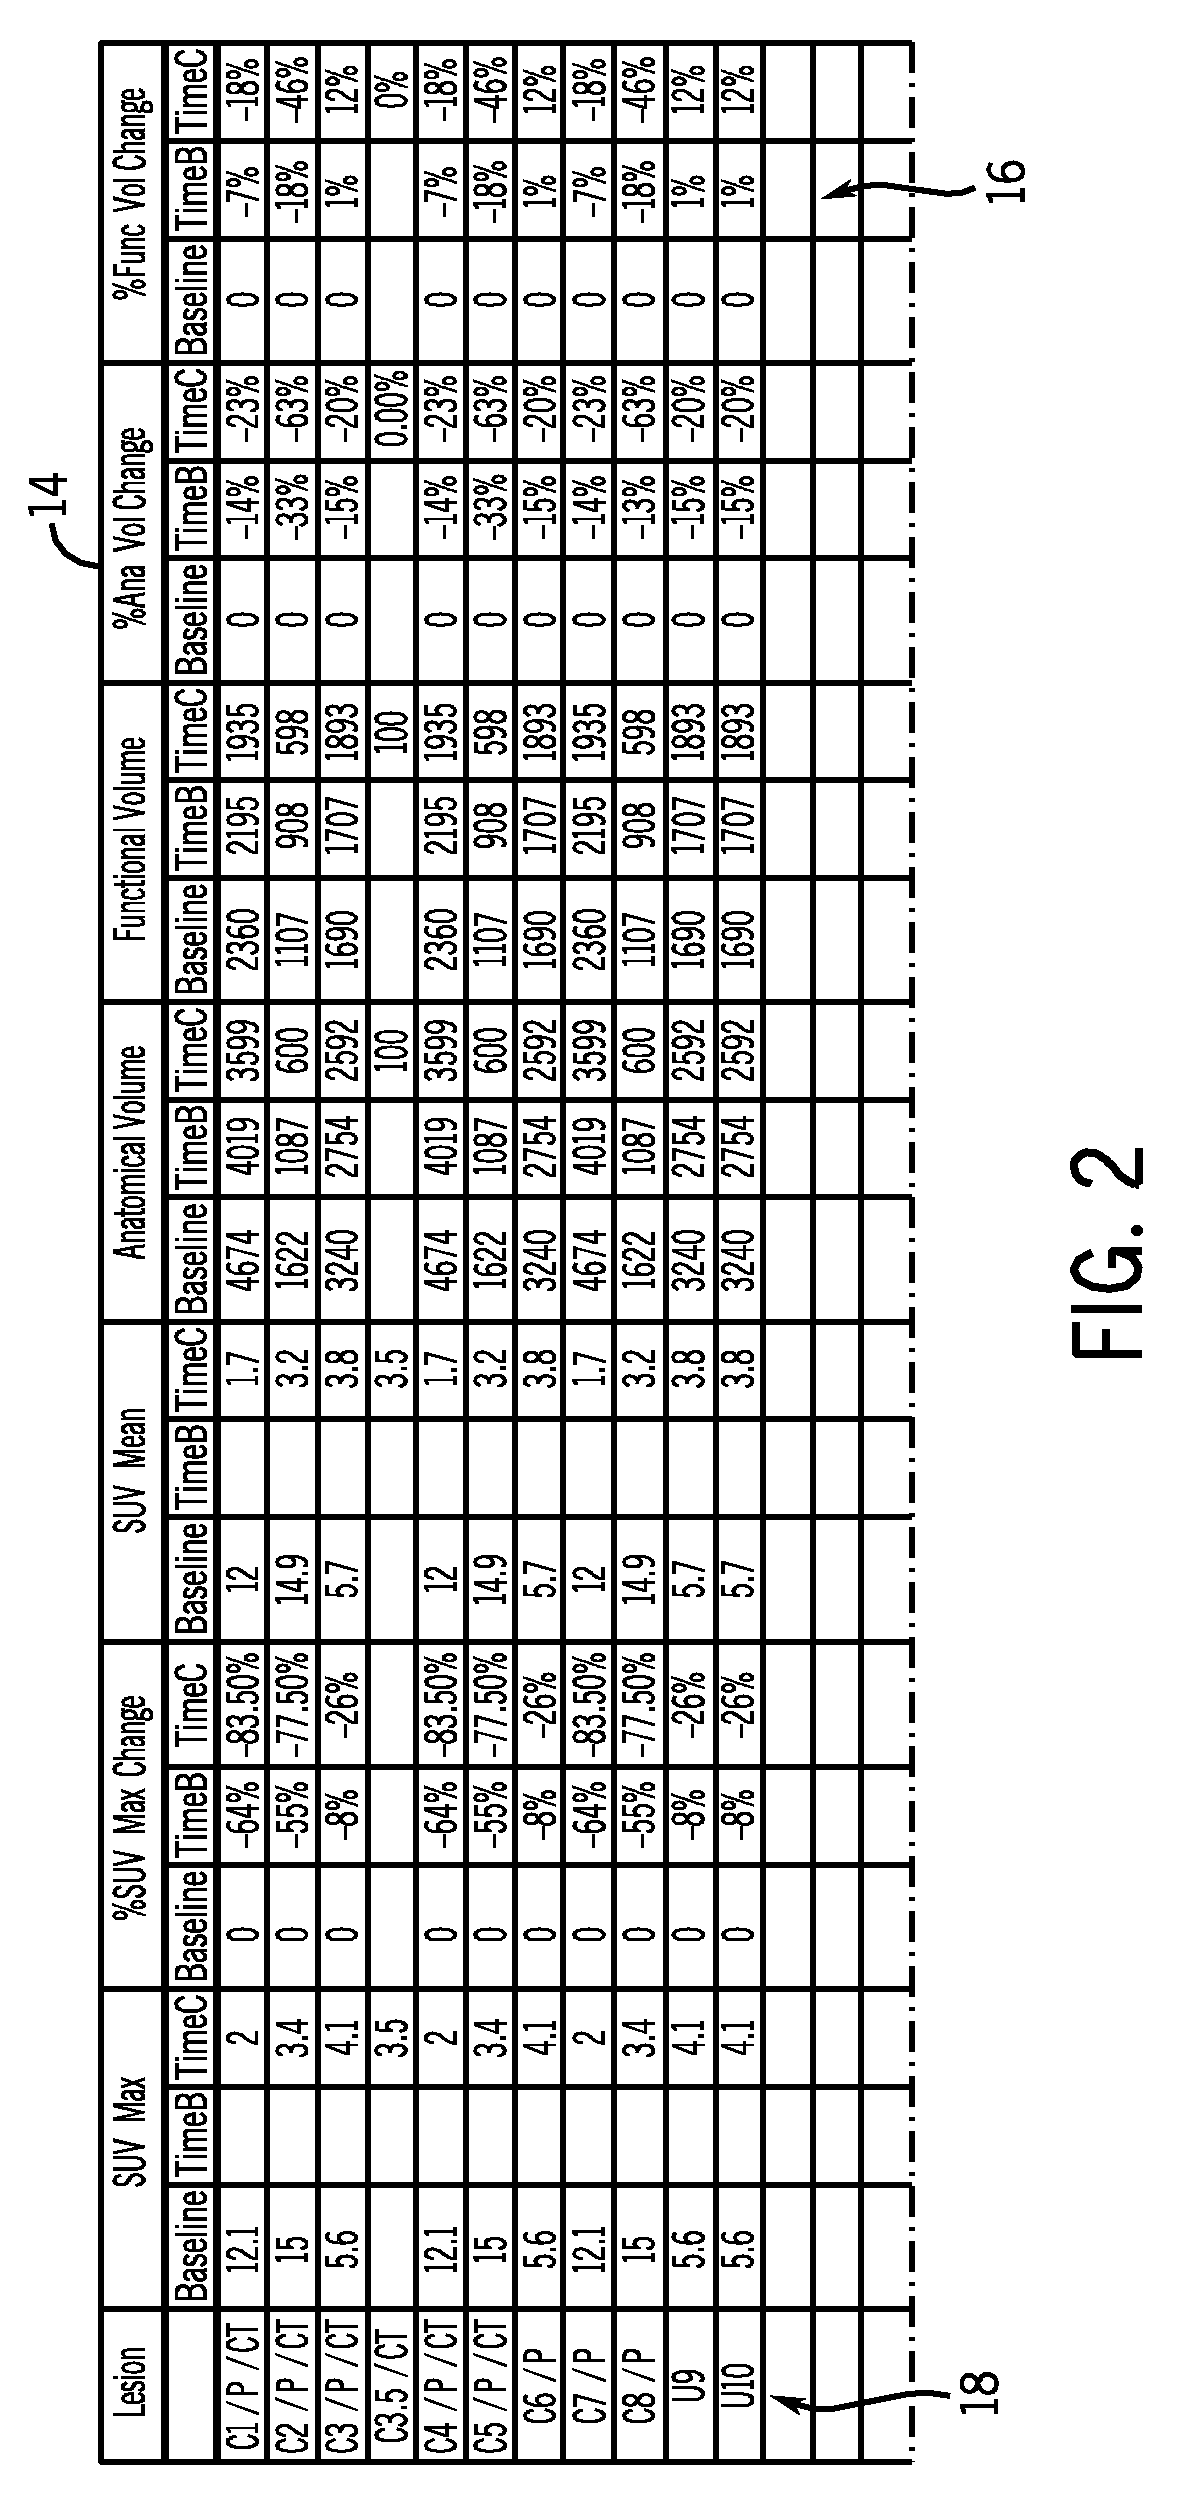
datasheet for posting relevant measurements in a spreadsheet format specific to an application. In the PET / CT application example, SUV max, Functional Volume, Anatomical Volume, SUV Mean, %
Volume Change, etc. are examples of measurements that are displayed. The
datasheet allows the user to select any
lesion of interest and hotlink to the book-marked image displayed in the analysis viewports for further visual analysis. The invention leverages graphical charts to show
disease or
lesion response to treatment. The invention also includes an interactive navigational interface that allows the user to quickly select chart, tables, and other quantitative data of interest. Localizer or
thumbnail images can be selected and hotlink to the analysis review for a more detailed visual analysis of that specific
disease or
lesion. A
thumbnail image reference is used for hotlinking to analysis or simply for a visual reference.
[0008] The invention further provides interactive
data analysis between analysis image review and patient
structured reporting. Thus, the invention is interactive with both these components of reading
workflow. The invention also facilitates management of quantitative analytics associated with disease and lesion progression as well as disease and lesion response to medical or
therapeutic treatment.
[0009] The invention is applicable to a number of physiological studies including
oncology and
neurology related pathologies. Current methods produce analytics from PET / SPECT images that show functional deviations in metabolic or
perfusion rates from a normal cohort. These deviations are either displayed point-wise or ROI / VOI based on regions of a standardized brain, i.e., individual brain mapped to a standard atlas. In addition to PET this functional information can also be determined using fMRI. Neurological diseases, particularly
dementia, i.e. Alzheimer's disease, also have anatomical markers as their indicators. These include atrophied regions in the brain, i.e. reduction of the
hippocampus, as well as other changes to the brain anatomical regions that can be imaged using CT and / or MR and quantified using
analysis tools. A similar transformation to the standardized space will allow for anatomical and functional information to be co-registered. With the invention, data analysis methodology allows for the anatomically relevant regions to be analyzed simultaneously using anatomical and functional attributes. Likewise, longitudinal studies can also be merged to allow for diagnosis, characterization of
therapy response and / or treatment planning. This invention provides productivity tools for the streamlined data analysis of disparate information.
[0010] Therefore, in accordance with one aspect of the present invention, a computer-readable storage medium having a
computer program stored thereon and representing a set of instructions is disclosed. The
computer program when executed by the computer causes the computer to access a first set of data of a first
data type and a second set of data of a second
data type. The first set of data and the second set of data are acquired from an object of interest, and the first set of data is acquired in a first plurality of scans and the second set of data is acquired in a second, different from the first, plurality of scans. The set of instructions further causes the computer to display a change in the value of the quantitative metric between the first plurality and the second plurality of scans.

