
System and Method for Characterizing a Chemical Sample

Inactive Publication Date: 2008-09-25
METANOMICS GMBH
View PDF5 Cites 17 Cited by
  • Summary
  • Abstract
  • Description
  • Claims
  • Application Information

AI Technical Summary

Benefits of technology

[0049]Followingly, within the third process step, at least one characteristic value is selected for each time variable interval and for each extracted signal. This characteristic value is selected, in order to characterize the respective extracted signal within the respective time variable interval, and, thus, reduces the dimensionality of the extracted signal from being a function of the time variable to the at least one characteristic value, similarly to the selection of the extracted signal for each mass variable interval as described above. As for the selection of the extracted signal, a number of methods reducing dimensionality may be used and are known to the person skilled in the art. These methods of data compression may, preferably, comprise one of the following methods:
[0055]As in the case of the selection of the extracted signal for each mass variable interval, an integration is most preferred. In accordance with the present invention, it has been found that applying integration is particularly useful to generate the at least one characteristic value. Specifically, it has been found that such a characteristic value is highly informative and specific for a sample. Therefore, sample comparison based thereon is highly reliable.
[0057]The method according to the invention as disclosed in one of the embodiments described above, provides a number of advantages over methods known from prior art. Thus, the method avoids the necessity of peak detection, which, as indicated above, is a disadvantage of many known methods. The position and the height of the peaks in the spectra, which is often used in prior art methods, may be replaced, e.g., by an integration over the time variable intervals. Thus, no time-consuming peak detection algorithm is necessary, and the above-mentioned uncertainties of peak detection are circumvented.
[0058]Further, the amount of data, starting from the first set of data (“raw data”) may be significantly reduced by generating the characteristic example profile. This allows for a reduction of storage space, e.g. for storing the characteristic sample profile in a database. Further, the significant reduction of the amount of data may result in an easier further processing of the data, such as for the purpose of comparing two or more different samples by comparing their respective characteristic sample profile. Further advantages will become clear within the further description given below.
[0063]Nevertheless, the method according to the invention may be further “refined” by adding a more detailed step of comparison, following to the described comparison of the characteristic sample profiles. Thus, in a following step, the three-dimensional first set of data or a relevant part thereof of the sample may be compared to a three-dimensional first set of data of the second sample or of the reference sample. A relevant part of the data set refers to a subset of data based on which the characteristic value can be determined or which represents the characteristic value. Thus, further clarification may be obtained on whether the samples are likely to be identical and / or are likely to comprise one or more identical or similar compounds. Thus, the comparison of the characteristic sample profiles may be used to reduce a large number of samples (e.g. several thousand samples) to a small group of samples which are likely to not match or to differ from a reference sample. Followingly, a more detailed comparison of the raw data may be performed, in order to further characterize the samples.
[0065]Thus, the method according to the invention in one of the embodiments as described above allows for a fast comparison of a large number of samples by using a “pre-matching” step, followed by an optional step of a more detailed sample comparison. Thus, the time needed for comparing a large amount of samples is significantly reduced, and the necessity of extensive hardware resources is minimized.

Problems solved by technology

They are, thus, complex samples which are difficult to analyze and to characterize.

Method used


Image

  • System and Method for Characterizing a Chemical Sample
  • System and Method for Characterizing a Chemical Sample
  • System and Method for Characterizing a Chemical Sample

Examples


Embodiment Construction

[0069]Further details and characteristic features of the invention will become clear from the following description of preferred embodiments in combination with the dependent claims. Therein, the respective characteristic features may be realized by oneself or in combination with other characteristic features. The invention is not restricted to the embodiments.

[0070]The embodiments are depicted schematically in the figures. Identical reference numbers in these figures denote identical or functionally similar or corresponding elements. The figures show:

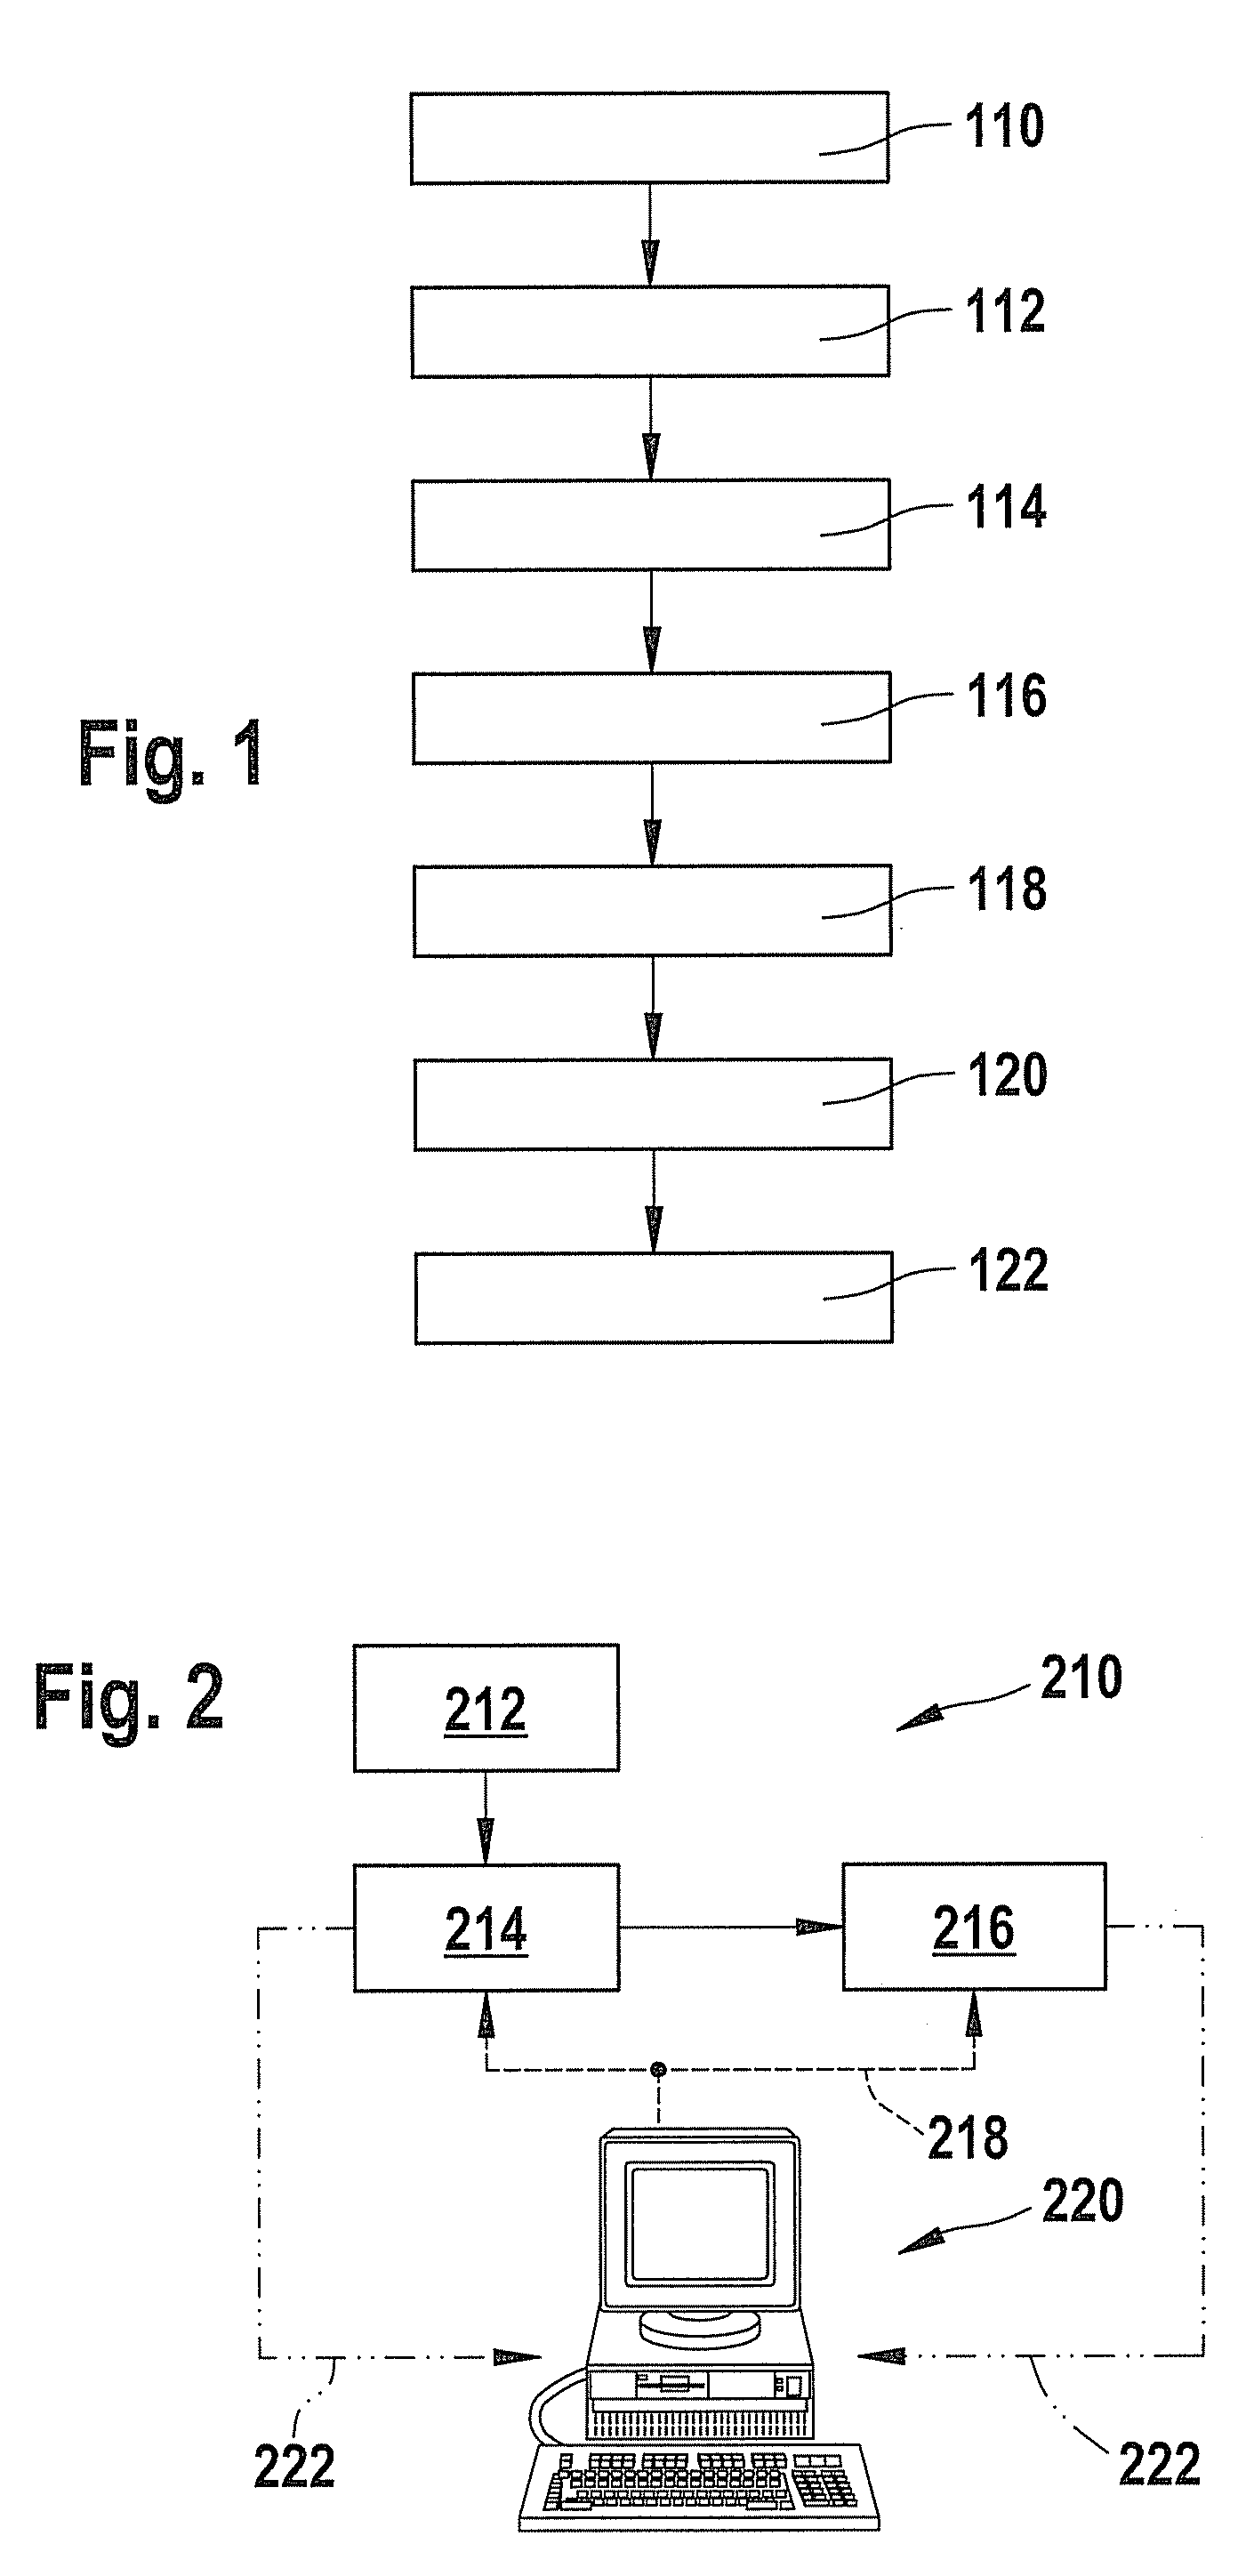
[0071]FIG. 1 a preferred embodiment of the method according to the invention;

[0072]FIG. 2 a schematic setup of a preferred embodiment of a system for performing the method according to FIG. 1;

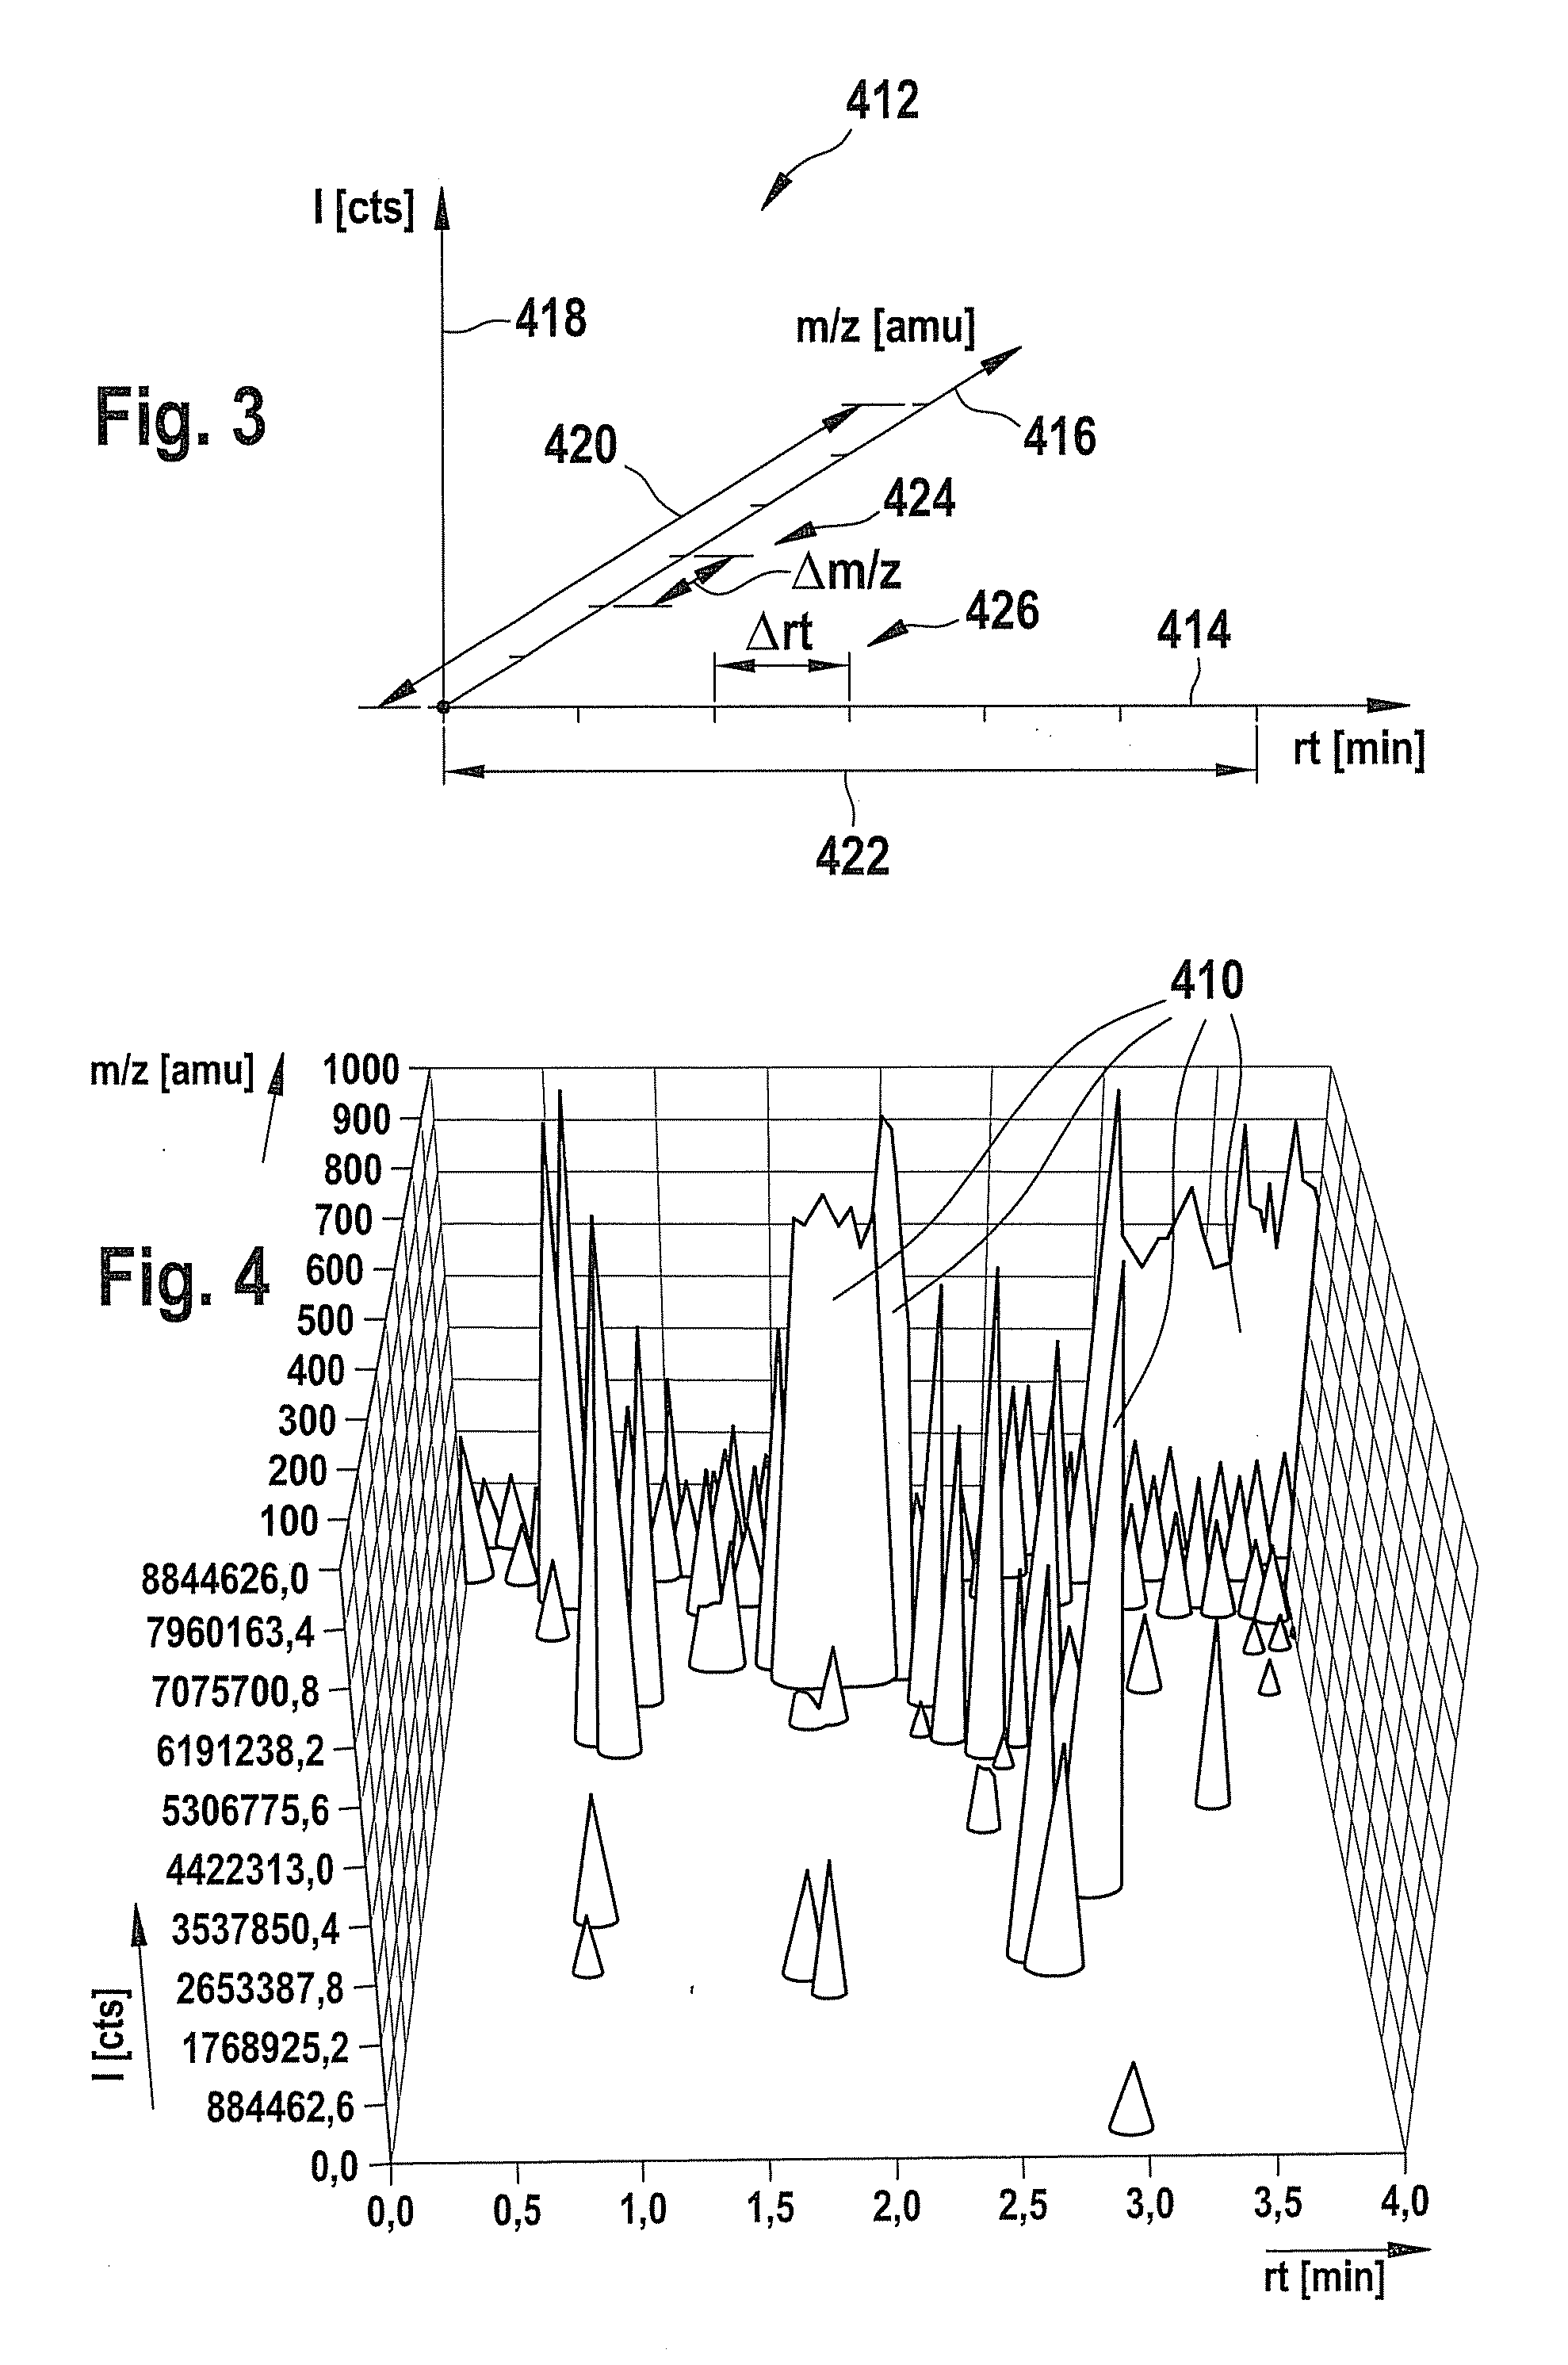
[0073]FIG. 3 a coordinate system of a three-dimensional first set of data characterizing a sample containing at least one compound;

[0074]FIG. 4 an example of a three-dimensional first set of data;

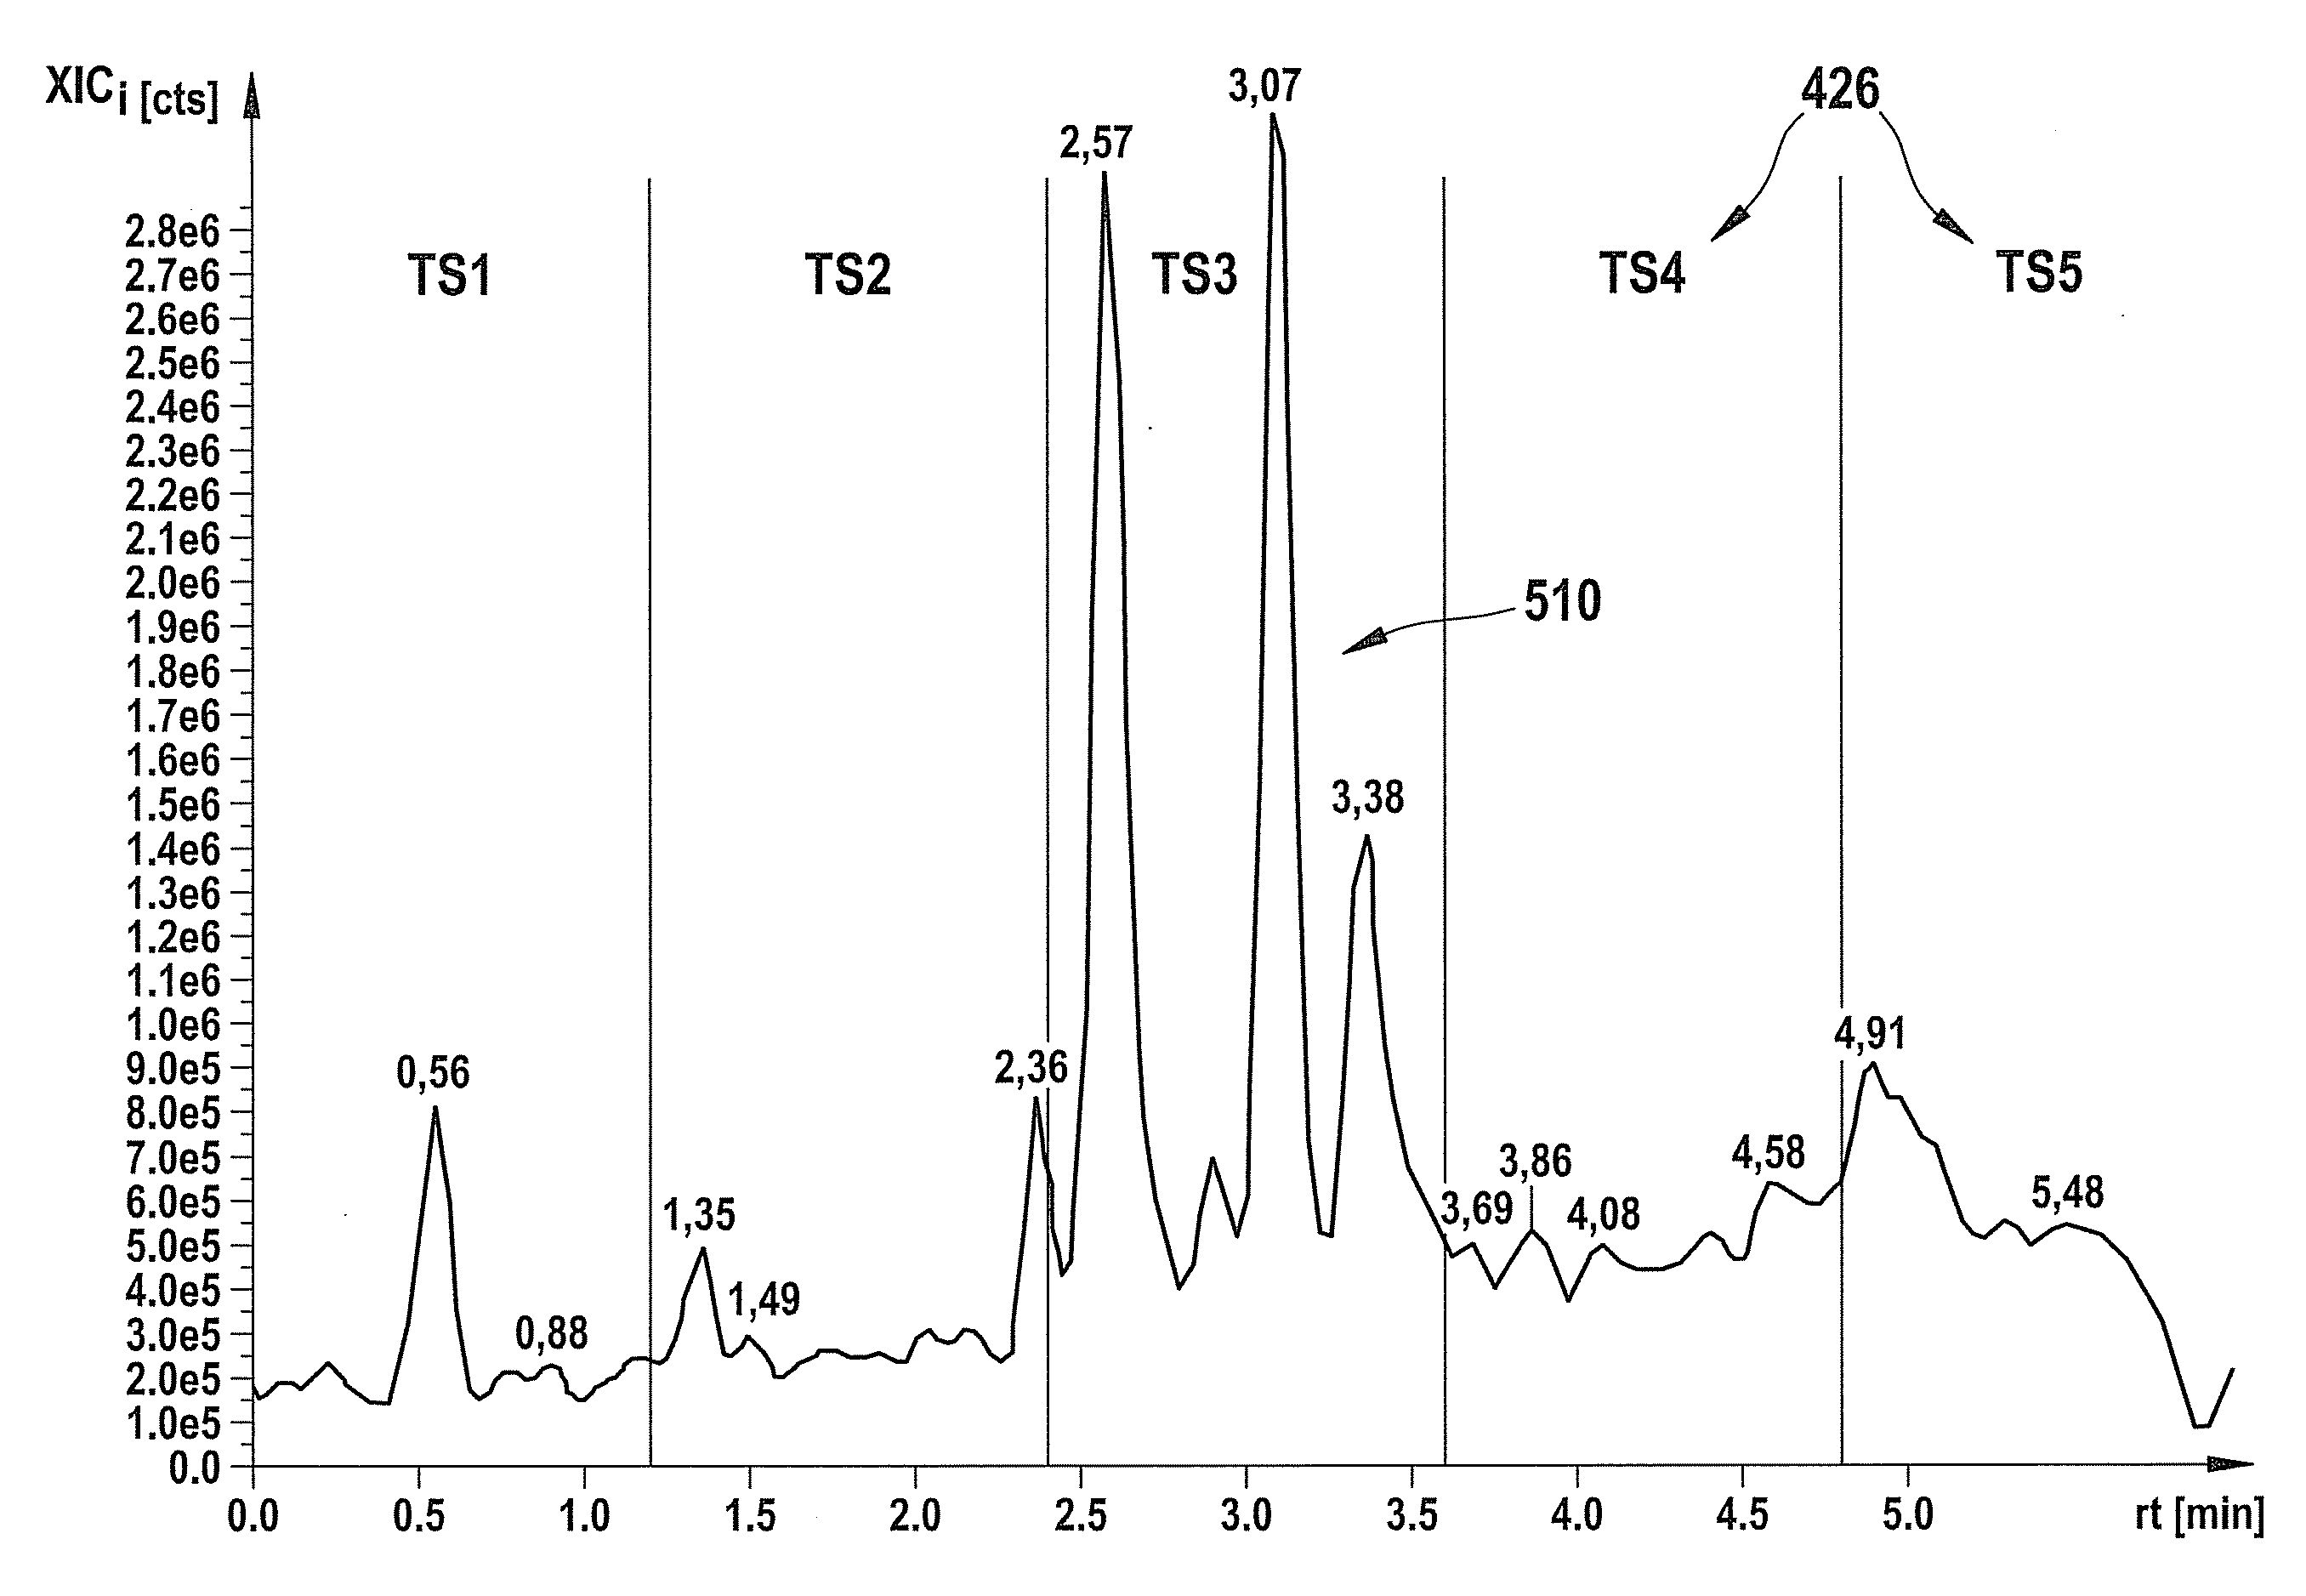
[0075]FIG. 5 an example of an extracted signal for ...


PUM


Abstract

A method for characterizing a sample containing at least one compound, preferably a biological sample comprising at least one metabolite, is proposed. In a first process step, a three-dimensional first set of data is generated by analyzing the sample by using at least one time resolved separation technique (214) and at least mass one resolved separation technique (216). The set of data comprises at least one signal I as a function of a mass variable over a first range of measurement (420) and of a time variable over a second range of measurement (422). In a second process step, the first range of measurement (420) is divided into at least two mass variable intervals (424). For each mass variable interval (424), an extracted signal is selected, wherein the extracted signal is a function of the time variable. In a third process step, the second range of measurement (422) is divided into at least one time variable interval (426). At least one characteristic value is selected for each time variable interval (426) and for each extracted signal. Thus, a characteristic sample profile is generated, which comprises the at least one characteristic value as a function of the respective time variable interval (426) and of the respective mass variable interval (424).

Description

FIELD OF THE INVENTION[0001]The invention refers to a method for characterizing a sample containing at least one compound, preferably a biological sample. The method further discloses means for characterizing the sample, such as a system comprising means for performing the method according to the invention, as well as computer means and database means. The method and means are particularly suited for characterizing biological samples, such as samples comprising at least one metabolite.PRIOR ART[0002]For analyzing and / or characterizing chemical samples, a large variety of analytical techniques is known to the person skilled in the art. Among those techniques, mass spectrometry and chromatography are particularly wide-spread examples.[0003]Mass spectrometry (MS) is a widely used method for identifying substances or molecules in the field of organic chemistry as well as in the field of inorganic chemistry. Ions are separated according to their mass-to-charge-ratio (m / z) and are detecte...

Claims


Application Information

Patent Timeline
IPC IPC(8): G06F19/00G16B40/10
CPCG01N30/72G01N30/8675H01J49/0036G01N2030/8813G01N2030/8818G01N30/8682G16B40/00G16C20/20G16B40/10
Inventor WALK, TILMANN B.DOSTLER, MARTIN
Owner METANOMICS GMBH
Learn More