

TAT-041 and methods of assessing and treating cancer
- Summary
- Abstract
- Description
- Claims
- Application Information
AI Technical Summary
Benefits of technology
Problems solved by technology
Method used
Image

Examples
example 1
Reproducibility of Peptide Matching and Variance of Peptide Intensities
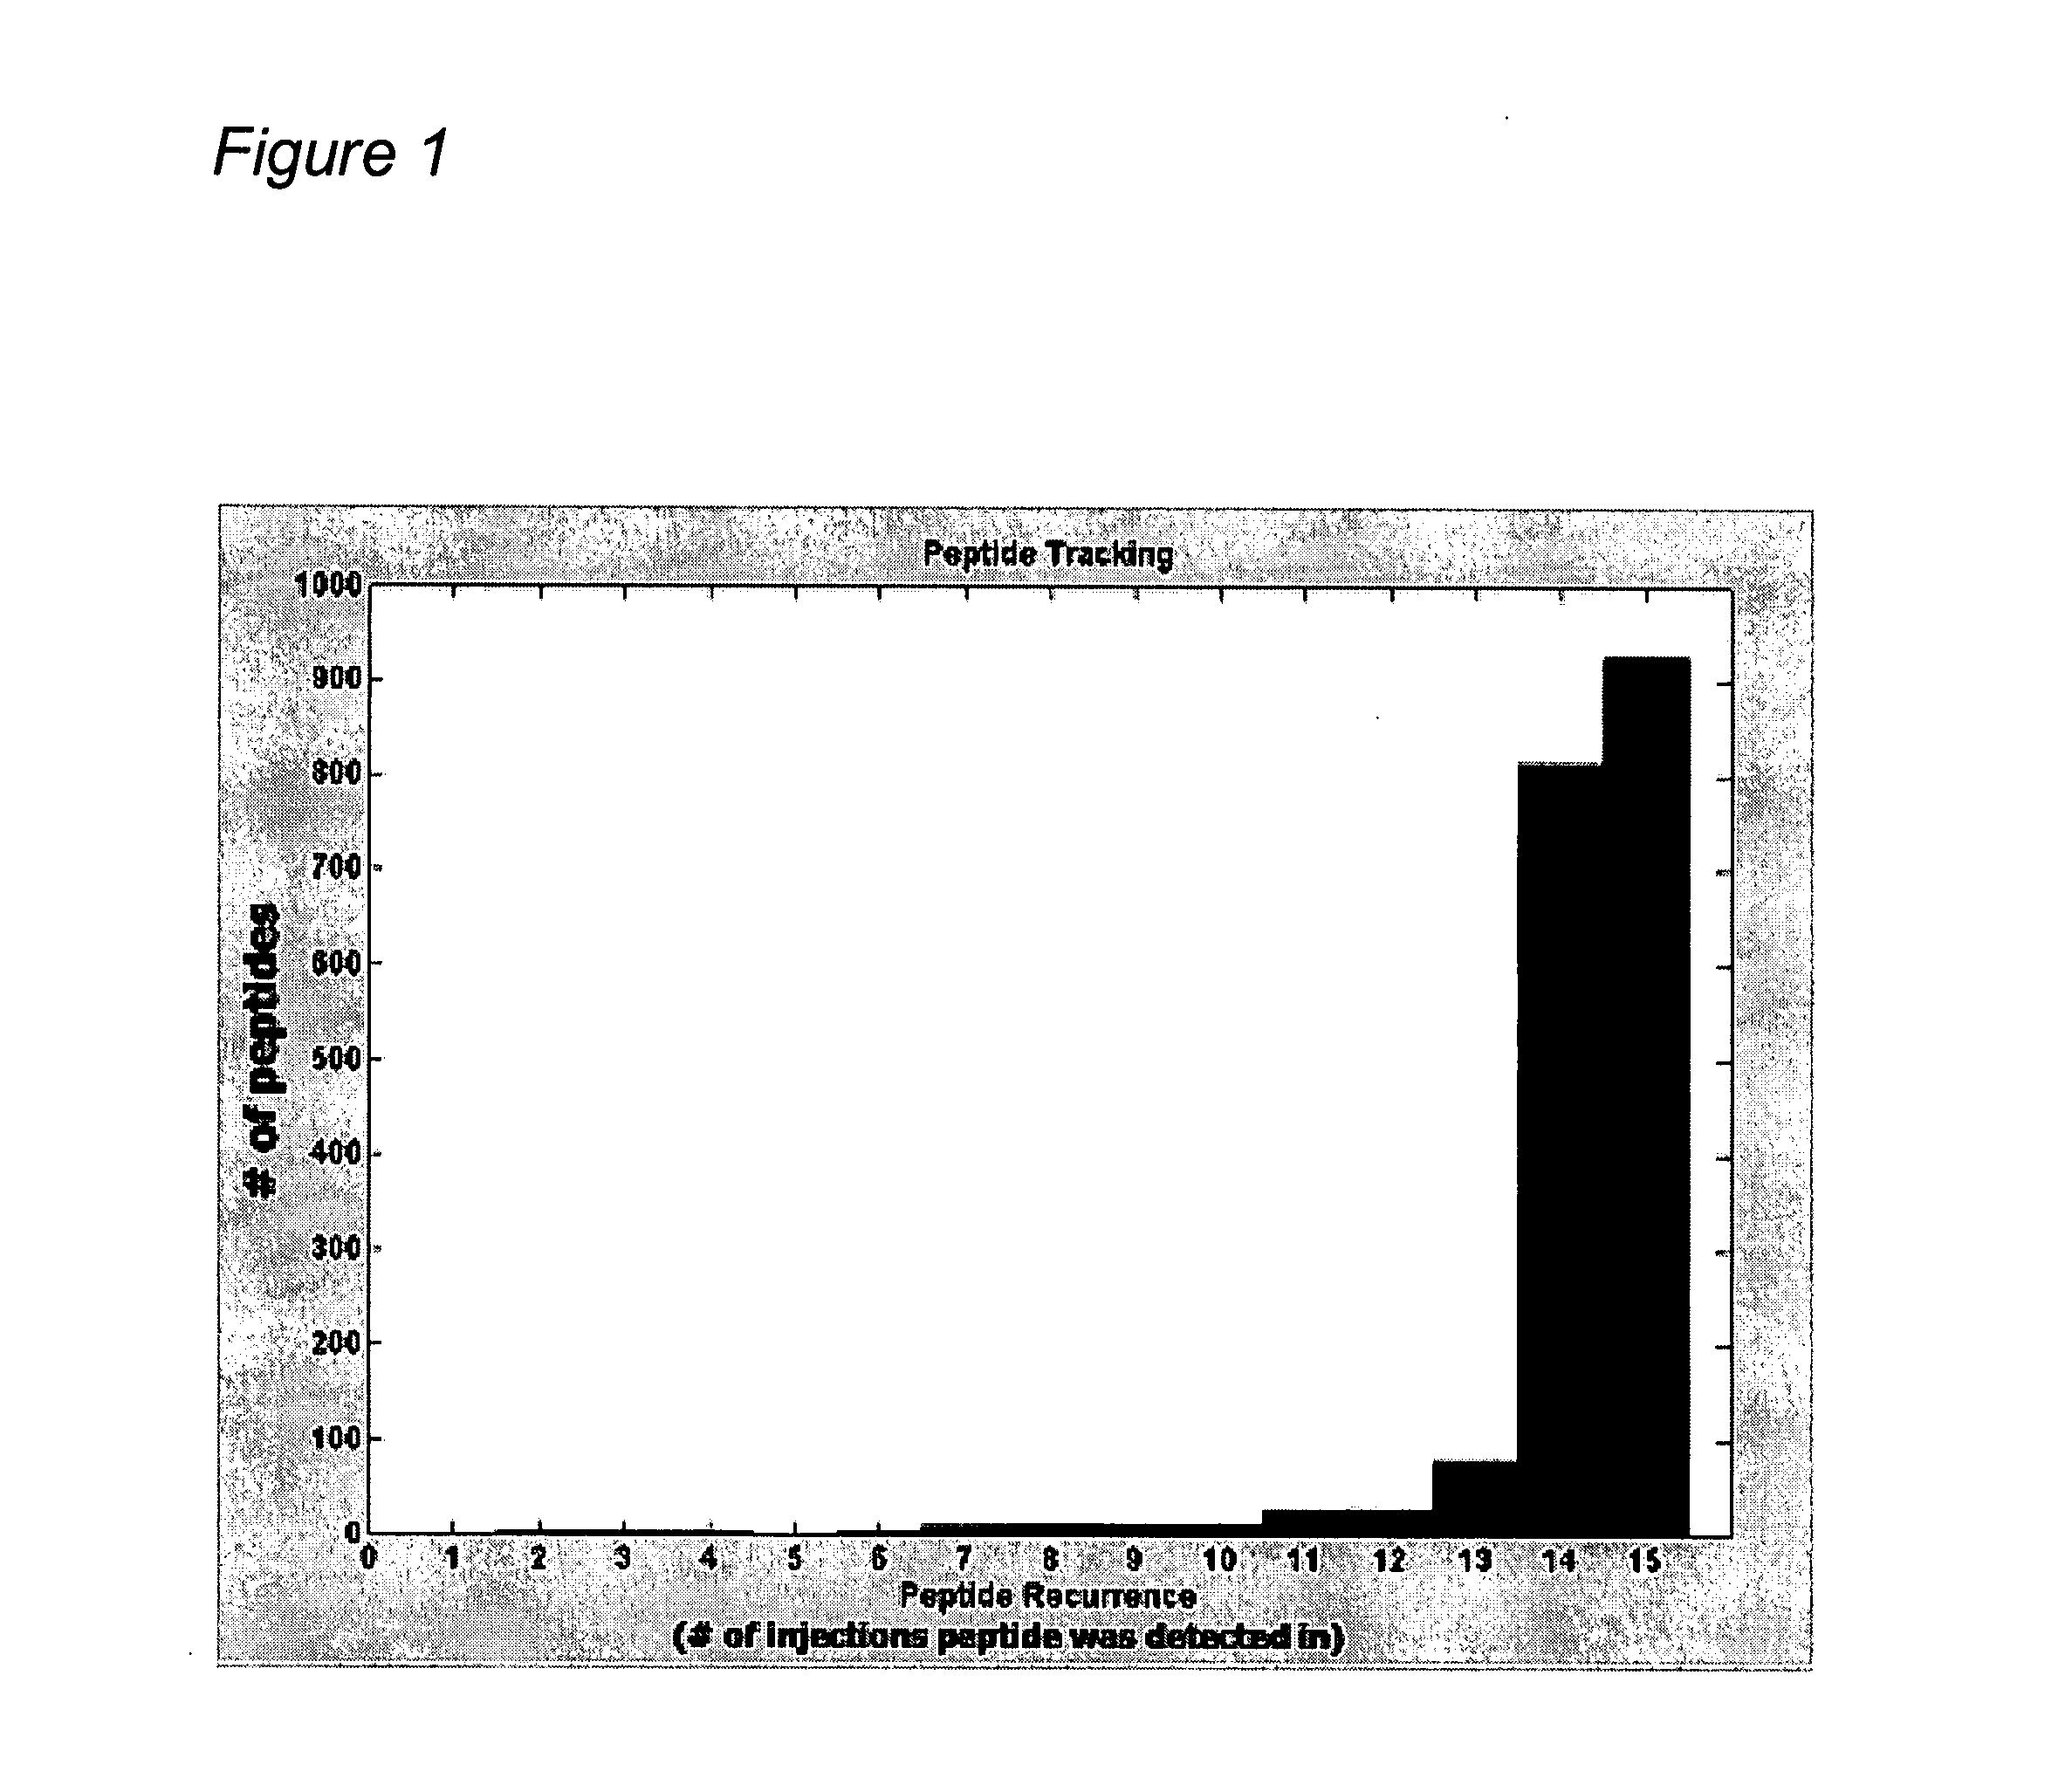
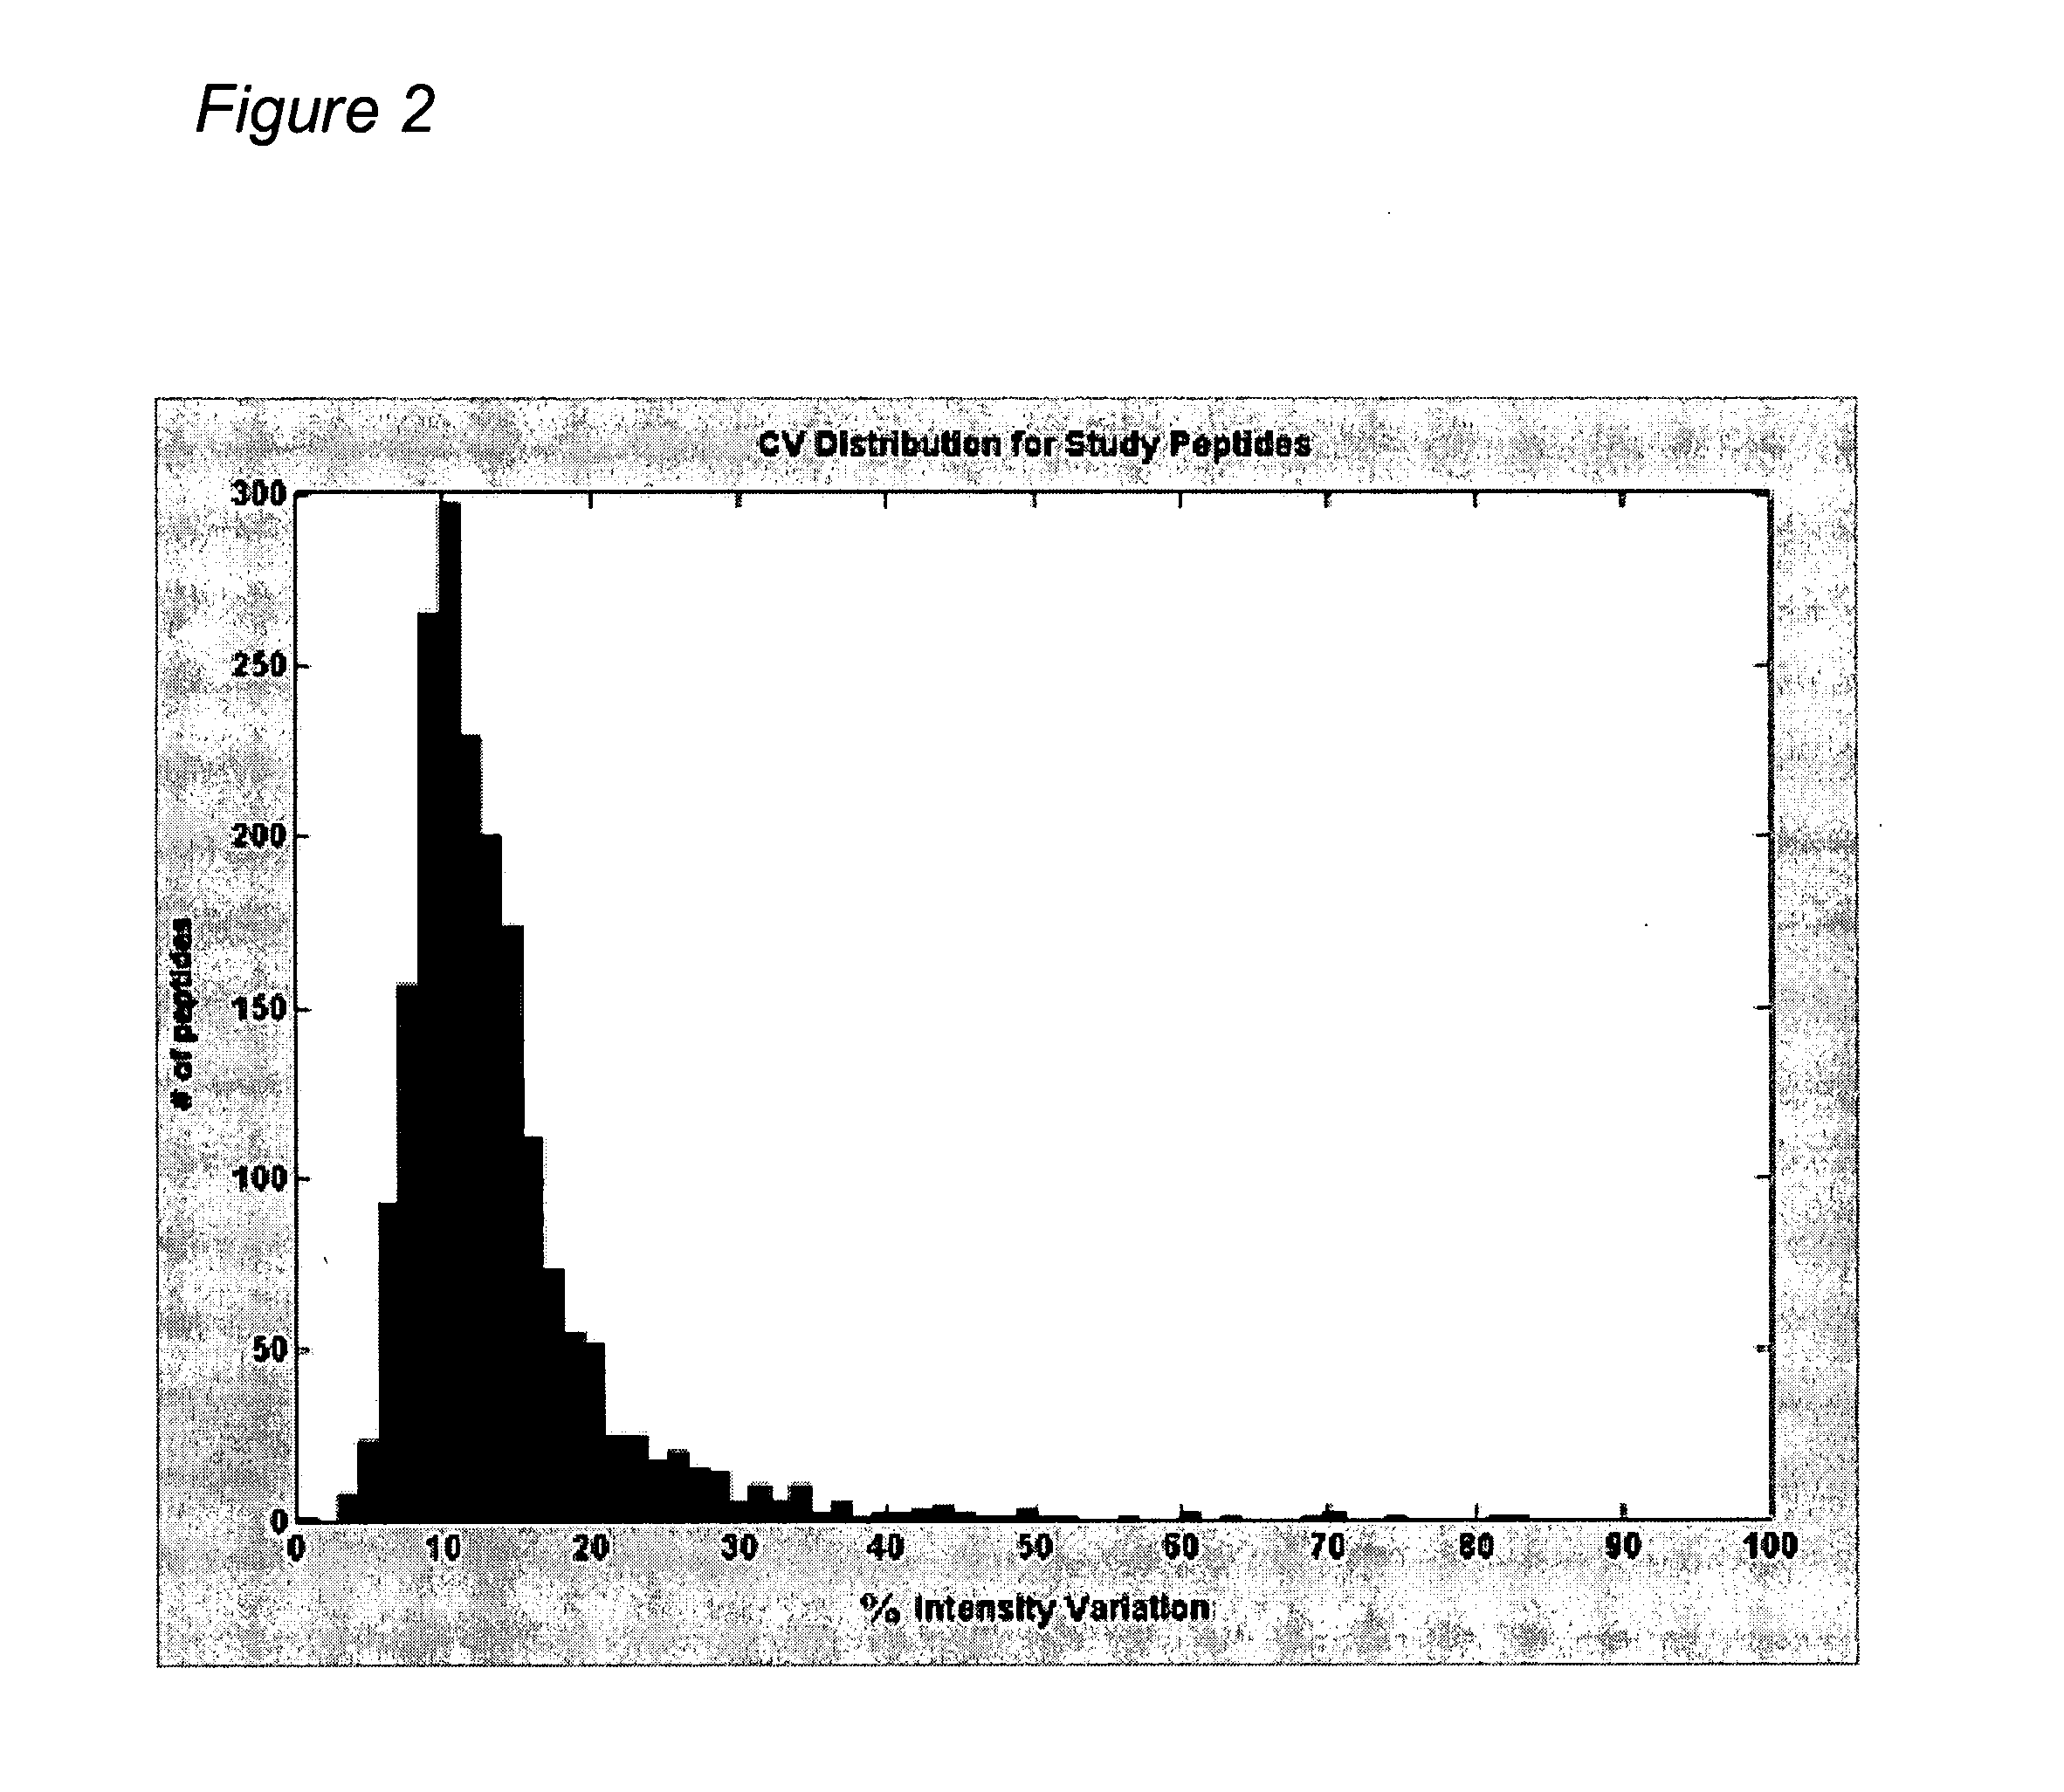
[0424] An experiment was conducted using a complex human tissue sample and the sample was processed (solubilized and fractionated by 1D SDS polyacrylamide gel electrophoresis (PAGE)). The gels were cut into 24 equal bands and each band was digested with trypsin to obtain peptides for analysis by nano-liquid chromatography-mass spectrometry (LC-MS)) to provide a total of 15 injections into the mass spectrometer after pooling. Each peptide fraction was injected onto a reverse phase capillary nano-liquid chromatography C18 column, coupled by electrospray to a QTOF (quadrapole time of flight) mass spectrometer. Peptide maps were derived for each of the 15 LC-MS isotope maps and all pairwise alignments between peptide maps were performed according to methods found in “Constellation Mapping and Uses Thereof” (PCT publication number WO 2004 / 049385, U.S. patent application publication number 20040172200; hereinafter “Co...
example 2
Predicting Differential Abundance from Differential Intensity
[0427] A controlled experiment was conducted where 3 proteins were spiked into a complex sample at 14 different concentrations, from 1.25 fmoles to 500 fmoles, each in triplicate yielding 42 samples that were analyzed by LC-MS. For each of the 3 proteins, 10 peptides were identified in each sample and their intensities recorded. Peptide intensity was derived from the height of the peptide peak within the LC-MS data.
[0428] All differential protein abundance (dA) ratios and corresponding differential peptide intensity (dI) ratios were obtained. FIG. 3 shows a plot of all such pairs where the mean differential abundance (black line) and standard deviations were plotted. Protein differential abundance (dA) was clearly predicted from peptide differential intensity (dl).
example 3
Predicting Protein Abundance from Peptide Abundance
[0429] Intensities were acquired from mouse plasma samples for three different hemoglobin tryptic peptides by mass spectrometry using Constellation Mapping and Mass Intensity Profiling System (PCT Publication No. WO 03 / 042774 and US Publication No. 20030129760; hereinafter “MIPS”) software. Briefly, proteins from the plasma samples were solubilized and fractionated by 1D SDS-PAGE. Gels were cut into 24 equal bands and each band was digested by trypsin to obtain peptides for analysis by nano-LC-MS. Each peptide fraction was injected onto a reverse phase capillary nano-liquid chromatography C18 column, coupled by electrospray to a QTOF mass spectrometer.
[0430] Plasma samples were subjected, in parallel, to proteomics analysis through a pair-wise comparison of the samples using MIPS and Constellation Mapping softwares. The analyses yielded isotope maps (see Constellation Mapping) in which thousands of peptide ions were visible, separ...
PUM
| Property | Measurement | Unit |
|---|---|---|
| Fraction | aaaaa | aaaaa |
| Composition | aaaaa | aaaaa |
| Immunogenicity | aaaaa | aaaaa |
Abstract
Description
Claims
Application Information