TAT-036 and methods of assessing and treating cancer
- Summary
- Abstract
- Description
- Claims
- Application Information
AI Technical Summary
Benefits of technology
Problems solved by technology
Method used
Image
Examples
example 1
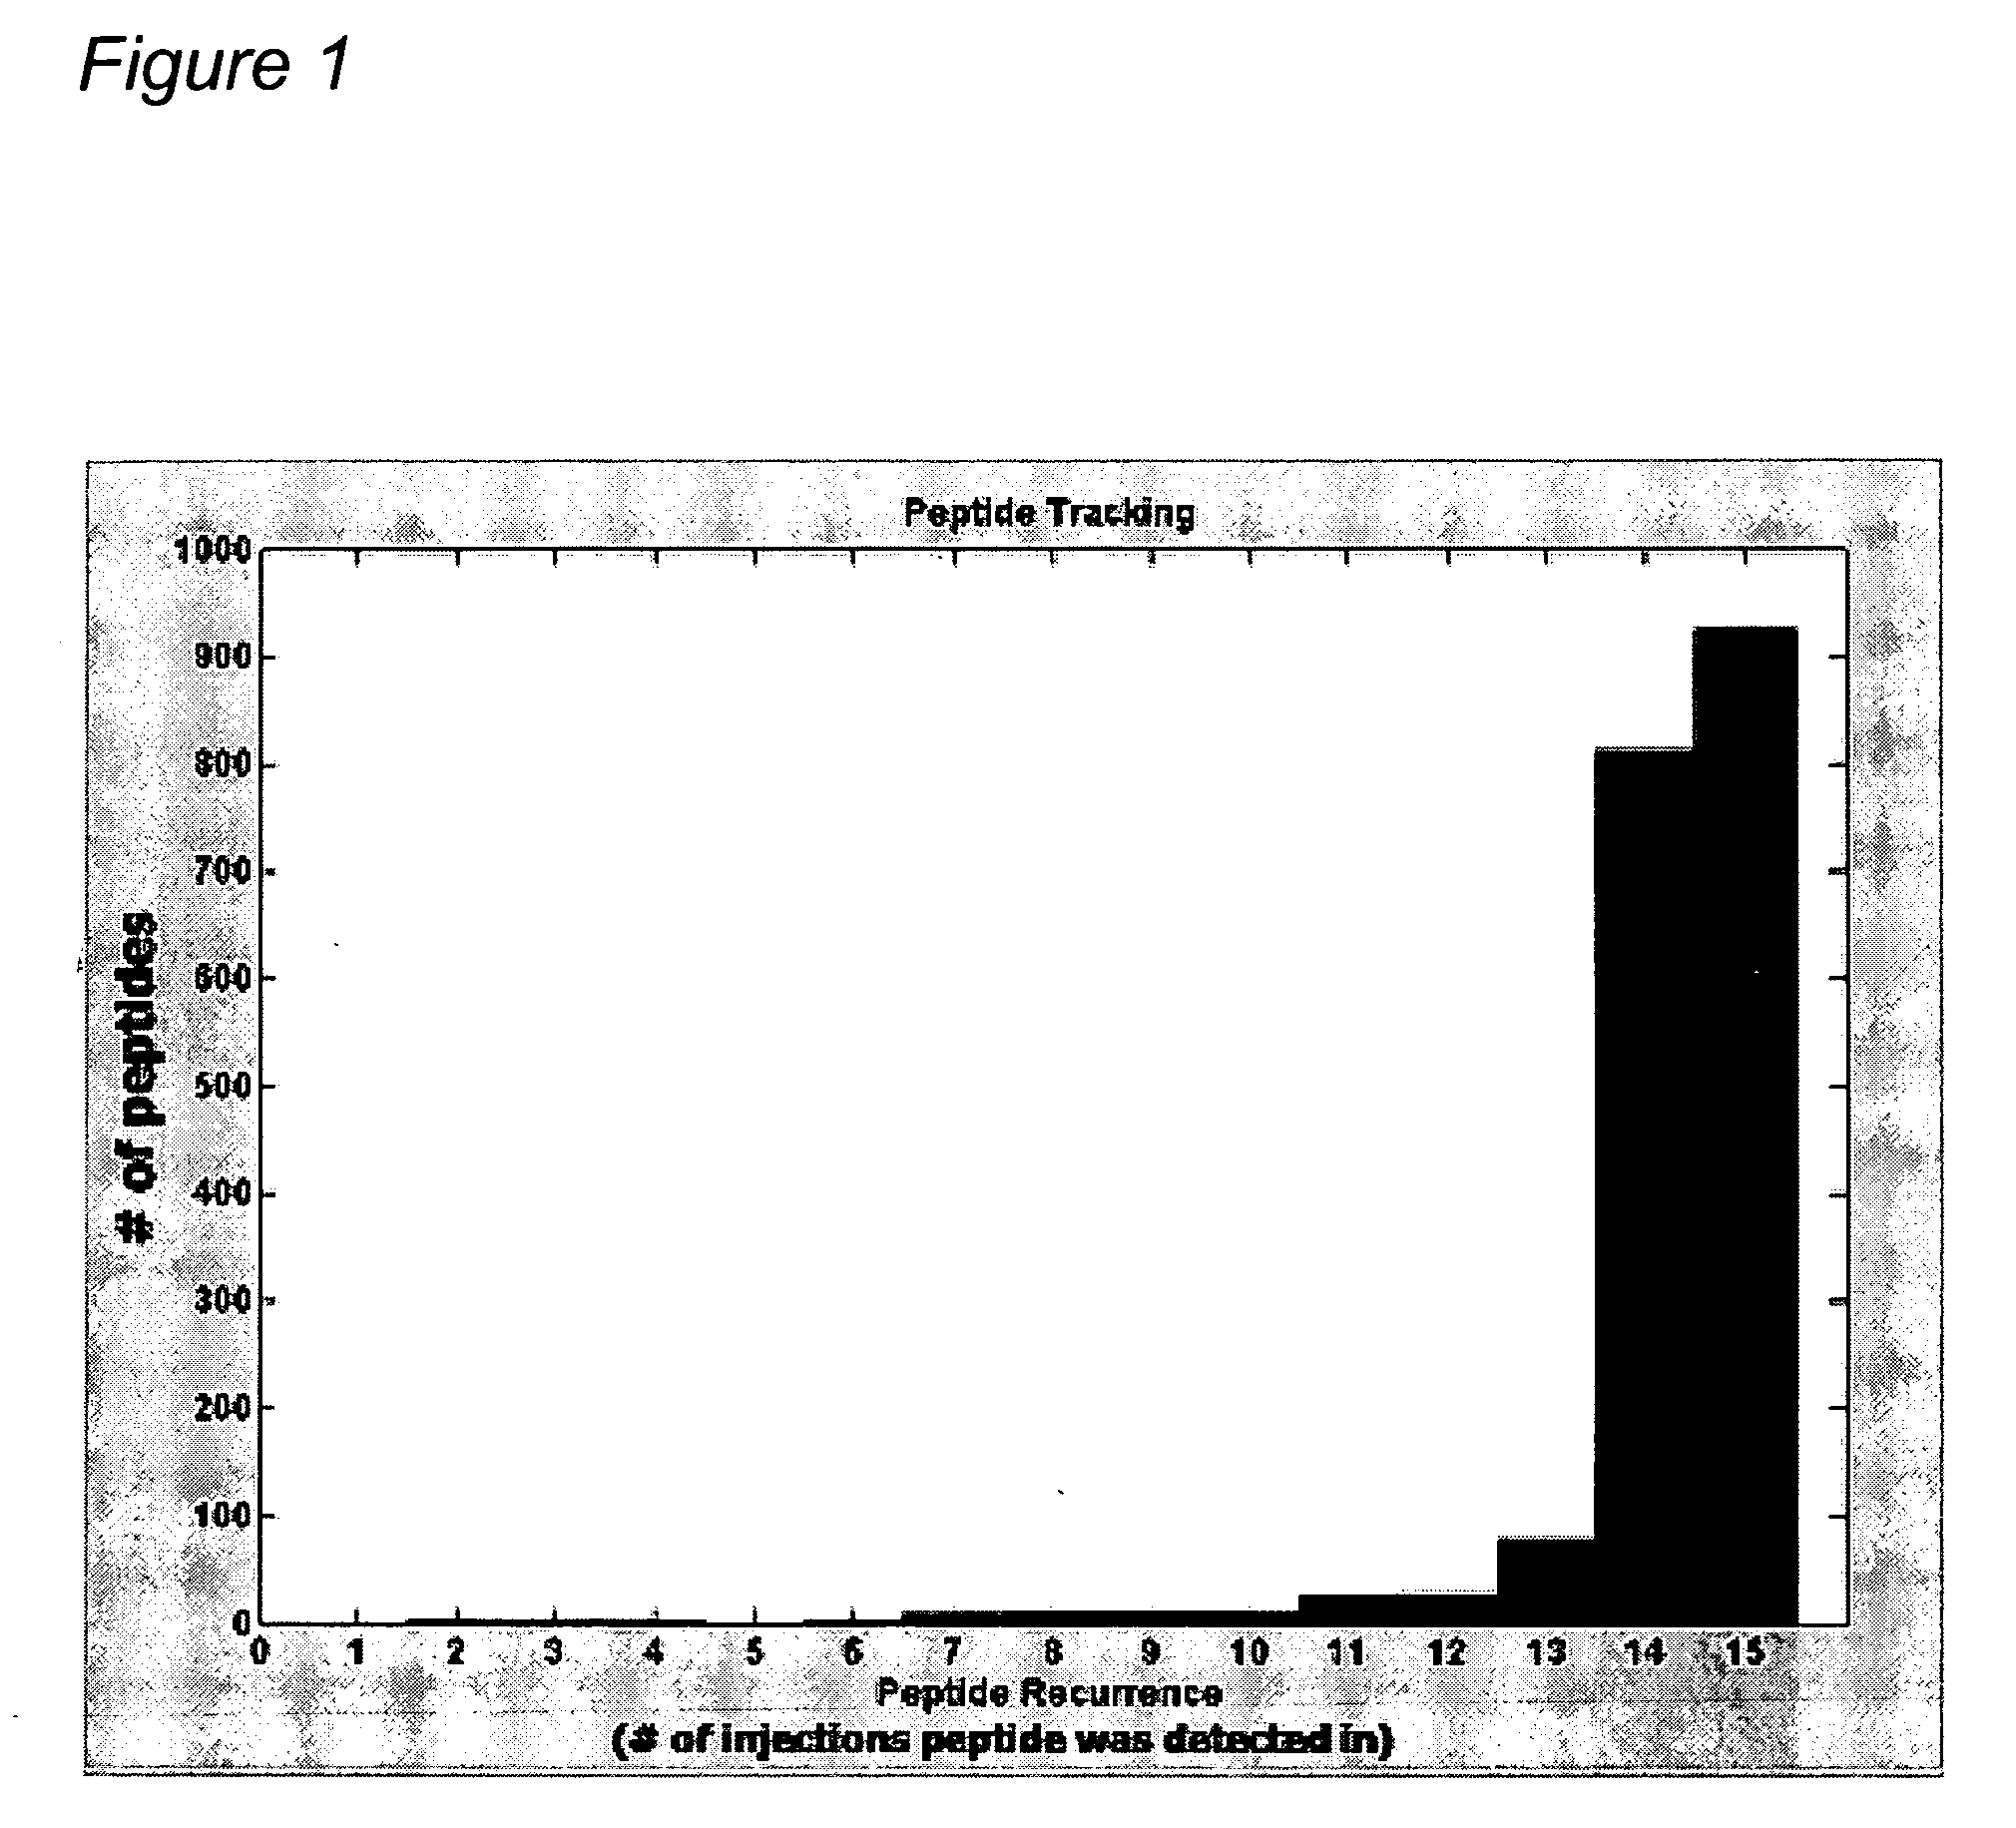
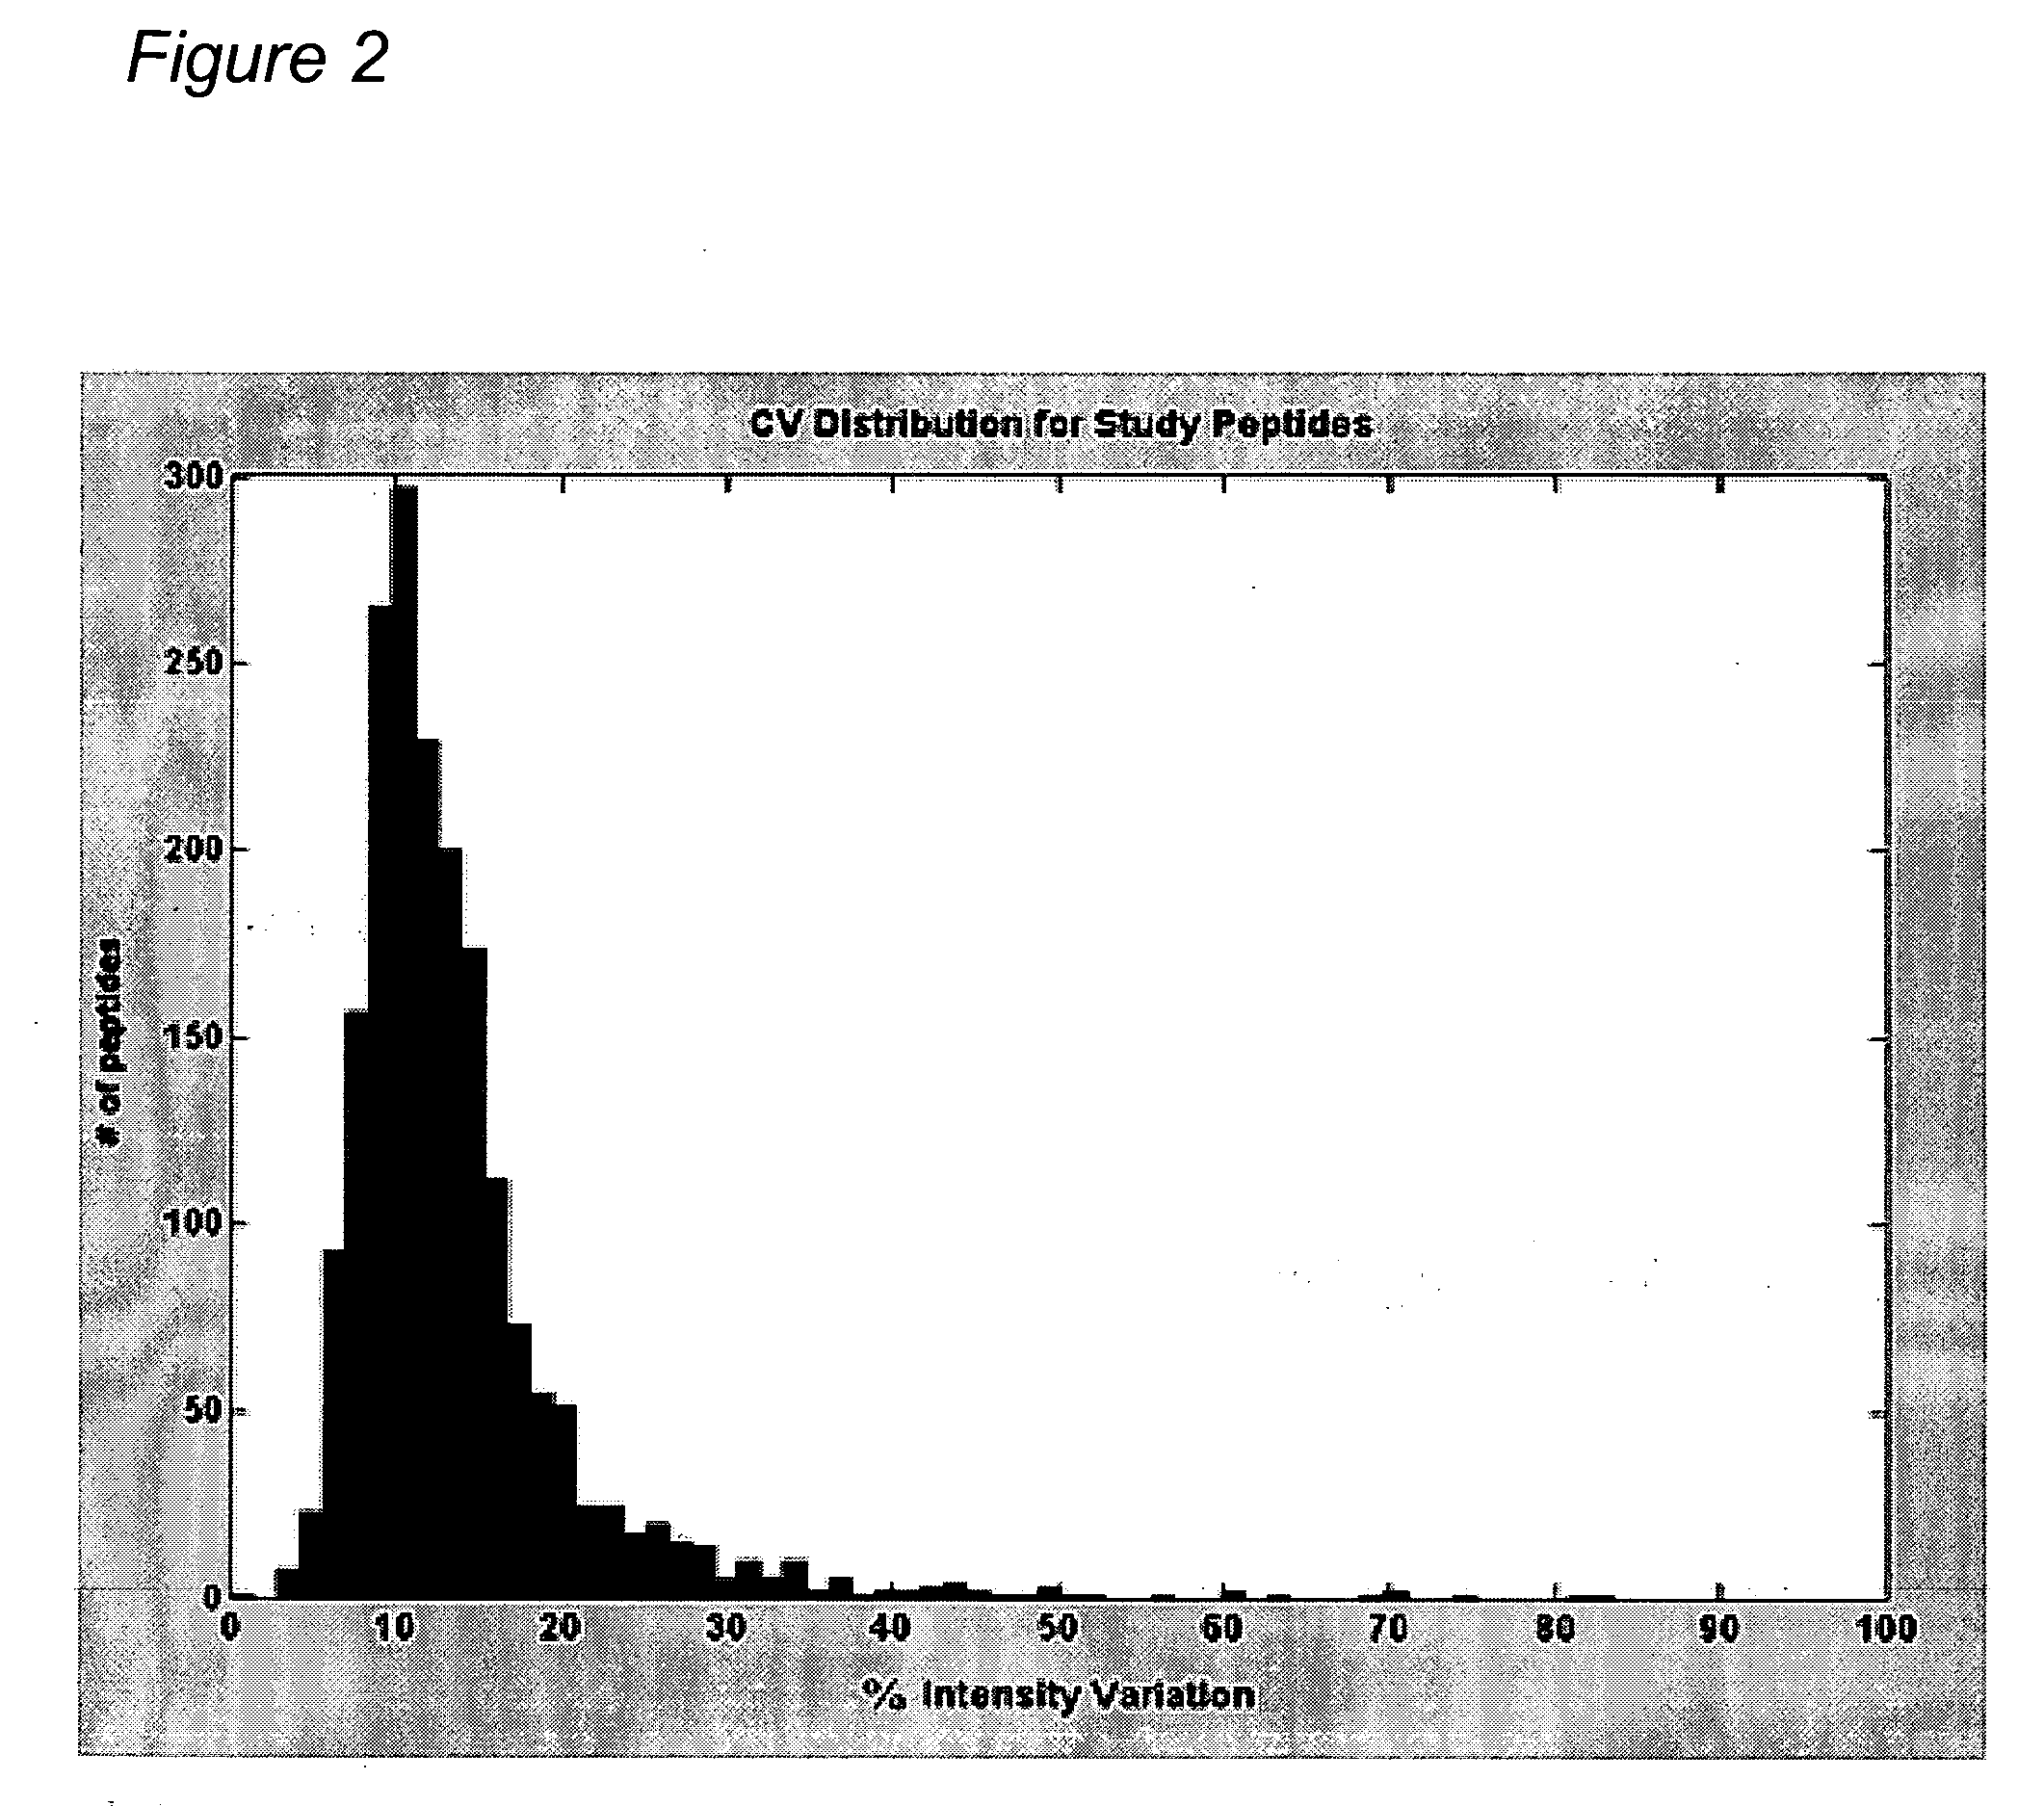
Reproducibility of Peptide Matching and Variance of Peptide Intensities
[0420] An experiment was conducted using a complex human tissue sample and the sample was processed (solubilized and fractionated by 1 D SDS polyacrylamide gel electrophoresis (PAGE)). The gels were cut into 24 equal bands and each band was digested with trypsin to obtain peptides for analysis by nano-liquid chromatography-mass spectrometry (LC-MS)) to provide a total of 15 injections into the mass spectrometer after pooling. Each peptide fraction was injected onto a reverse phase capillary nano-liquid chromatography C18 column, coupled by electrospray to a QTOF (quadrapole time of flight) mass spectrometer. Peptide maps were derived for each of the 15 LC-MS isotope maps and all pairwise alignments between peptide maps were performed according to methods found in “Constellation Mapping and Uses Thereof” (PCT publication number WO 2004 / 049385, U.S. patent application publication number 20040172200; hereinafter “C...
example 2
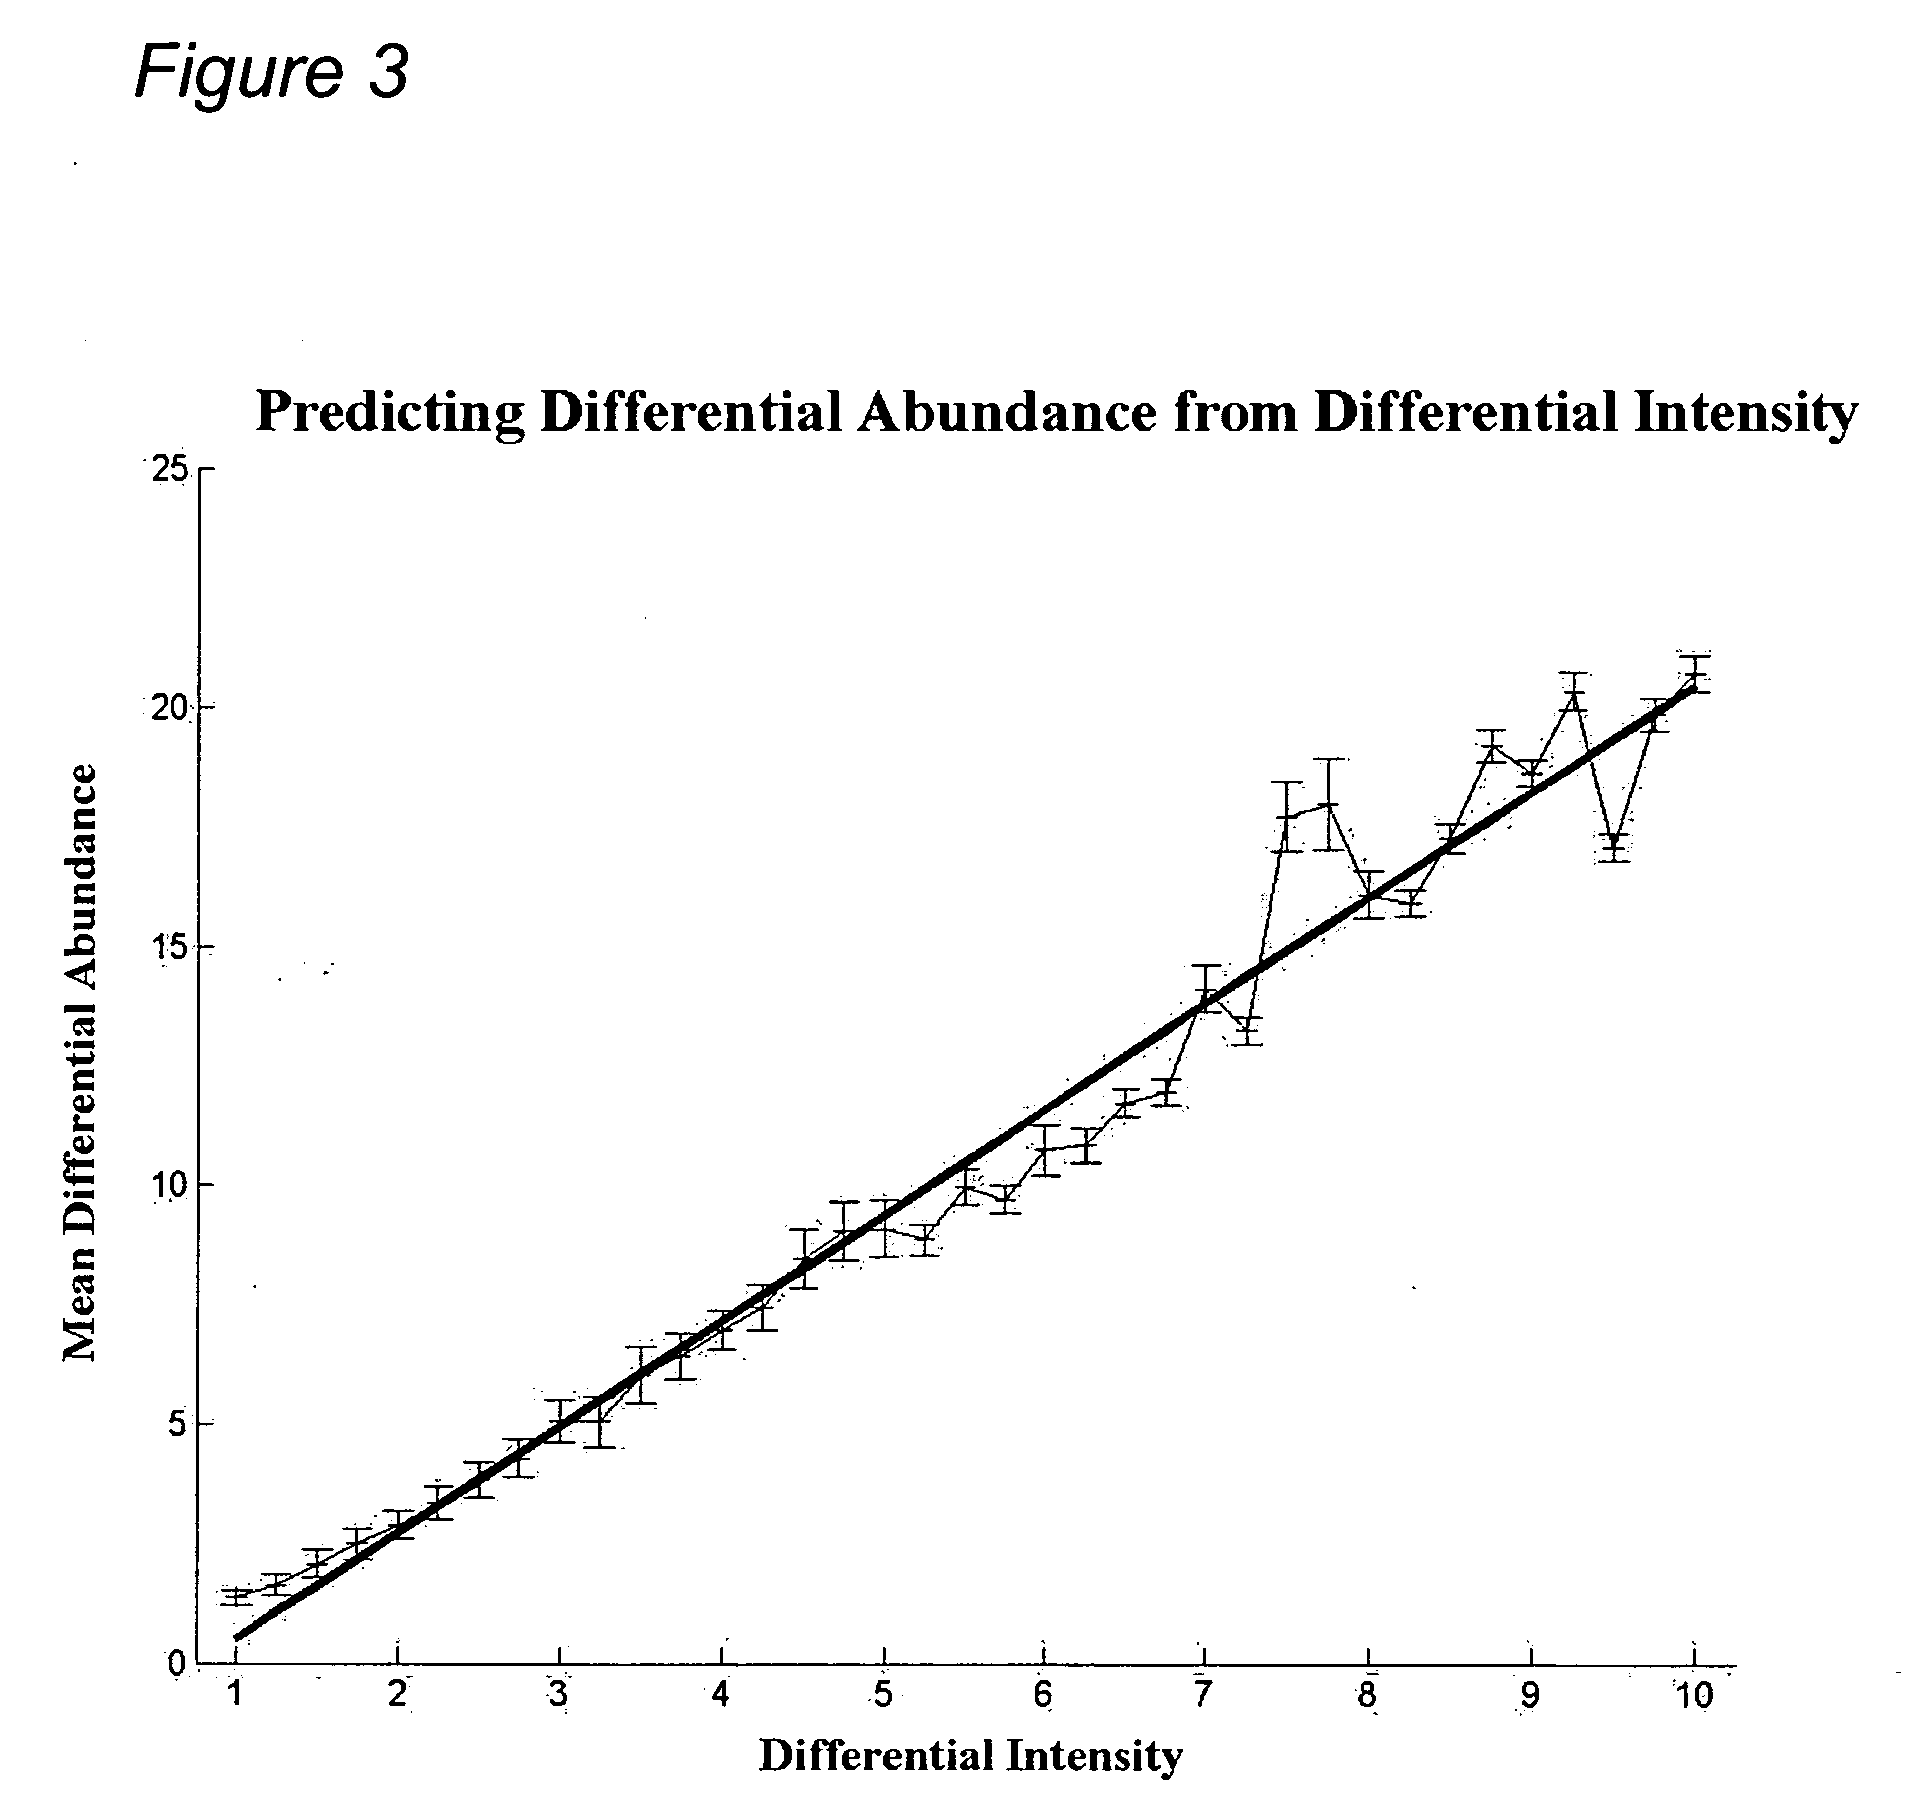
Predicting Differential Abundance from Differential Intensity
[0423] A controlled experiment was conducted where 3 proteins were spiked into a complex sample at 14 different concentrations, from 1.25 fmoles to 500 fmoles, each in triplicate yielding 42 samples that were analyzed by LC-MS. For each of the 3 proteins, 10 peptides were identified in each sample and their intensities recorded. Peptide intensity was derived from the height of the peptide peak within the LC-MS data.
[0424] All differential protein abundance (dA) ratios and corresponding differential peptide intensity (dl) ratios were obtained. FIG. 3 shows a plot of all such pairs where the mean differential abundance (black line) and standard deviations were plotted. Protein differential abundance (dA) was clearly predicted from peptide differential intensity (dl).
example 3
Predicting Protein Abundance from Peptide Abundance
[0425] Intensities were acquired from mouse plasma samples for three different hemoglobin tryptic peptides by mass spectrometry using Constellation Mapping and Mass Intensity Profiling System (PCT Publication No. WO 03 / 042774 and US Publication No. 20030129760; hereinafter “MIPS”) software. Briefly, proteins from the plasma samples were solubilized and fractionated by ID SDS-PAGE. Gels were cut into 24 equal bands and each band was digested by trypsin to obtain peptides for analysis by nano-LC-MS. Each peptide fraction was injected onto a reverse phase capillary nano-liquid chromatography C18 column, coupled by electrospray to a QTOF mass spectrometer.
[0426] Plasma samples were subjected, in parallel, to proteomics analysis through a pair-wise comparison of the samples using MIPS and Constellation Mapping softwares. The analyses yielded isotope maps (see Constellation Mapping) in which thousands of peptide ions were visible, separ...
PUM
| Property | Measurement | Unit |
|---|---|---|
| Fraction | aaaaa | aaaaa |
| Composition | aaaaa | aaaaa |
| Immunogenicity | aaaaa | aaaaa |
Abstract
Description
Claims
Application Information
 - R&D
- Intellectual Property
- Life Sciences
- Materials
- Tech Scout
- Unparalleled Data Quality
- Higher Quality Content
- 60% Fewer Hallucinations
Browse by: Latest US Patents, China's latest patents, Technical Efficacy Thesaurus, Application Domain, Technology Topic, Popular Technical Reports.
© 2025 PatSnap. All rights reserved.Legal|Privacy policy|Modern Slavery Act Transparency Statement|Sitemap|About US| Contact US: help@patsnap.com


