
System and methods for non-destructive analysis

a non-destructive analysis and system technology, applied in the field of non-destructive analysis of objects, can solve the problems of indexes having limitations in the range of use, in their inherent accuracy, and in their dependence on ancillary measurements, and achieve the effects of reducing uncertainties, reducing complexity, and improving accuracy

Inactive Publication Date: 2008-01-03
BOARD OF RGT UNIV OF NEBRASKA
View PDF1 Cites 16 Cited by
  • Summary
  • Abstract
  • Description
  • Claims
  • Application Information

AI Technical Summary

Benefits of technology

[0015] An additional advantage of the present invention is that because of the small number of wavelength bands needed and the relatively large bandwidth of those bands, the present system and methods will be generally cheaper to produce. The system of the present invention can be optimized for specific pigments causing a higher accuracy index and lower uncertainties.
[0016] Applications of the invention include determining the health and maturity of grain crops, wine grapes, forests, and grasslands. The technology described can help in detecting plant stress due to lack of water, nutrients, phosphorous, etc. It can help farmers and viticulturists determine the proper time to apply supplemental nutrients and to harvest the crop. Similarly, it can aid in predicting yield and fruit quality.
[0017] The present invention provides a generally highly accurate and simplified system and methods to determine many different pigments through the analysis of a small number of wavelength bands.
[0018] An index based on the reflectance of light at three specific wavelengths is determined such that the index value directly relates to the concentration of pigment in the object being observed. The index is computed in accord with the following equation which is the key element of the invention:Index=[R(λ1)−1−R(λ2)−1]×R(λ3)  (1) (the numbers in parentheses to the right of the equations in this application do not form a part of the equation but are provided for ease of reference.)
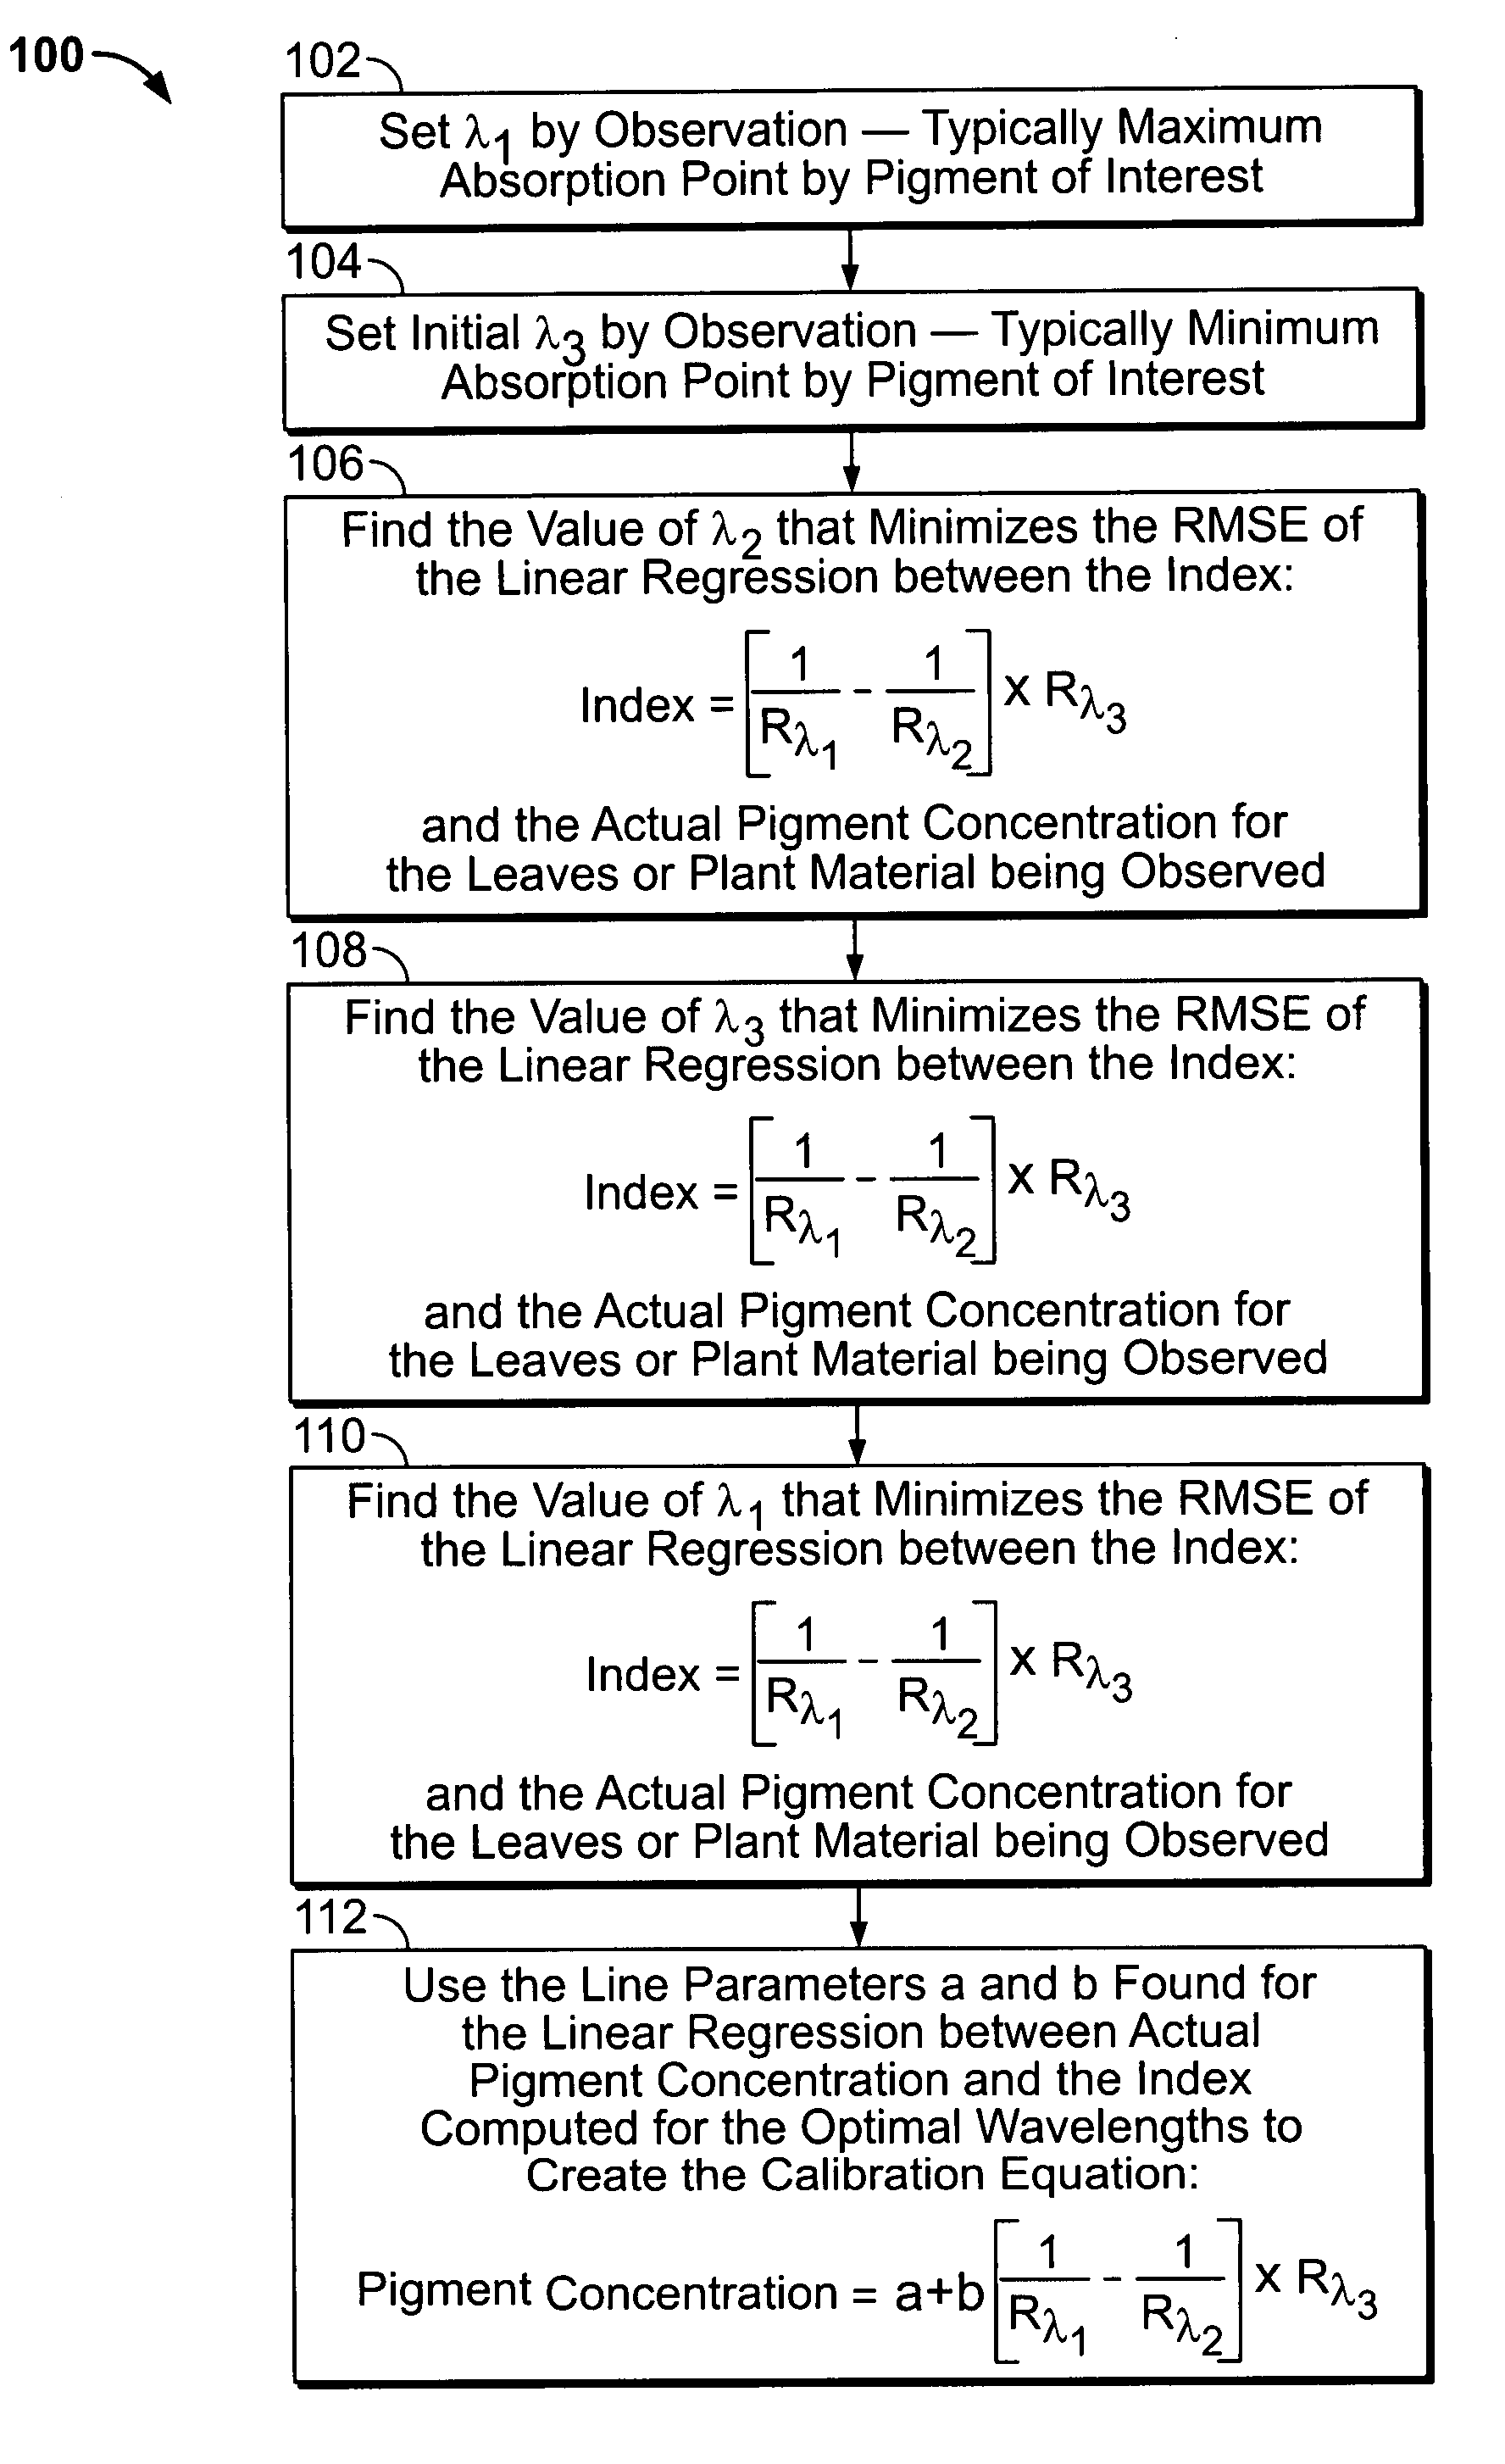
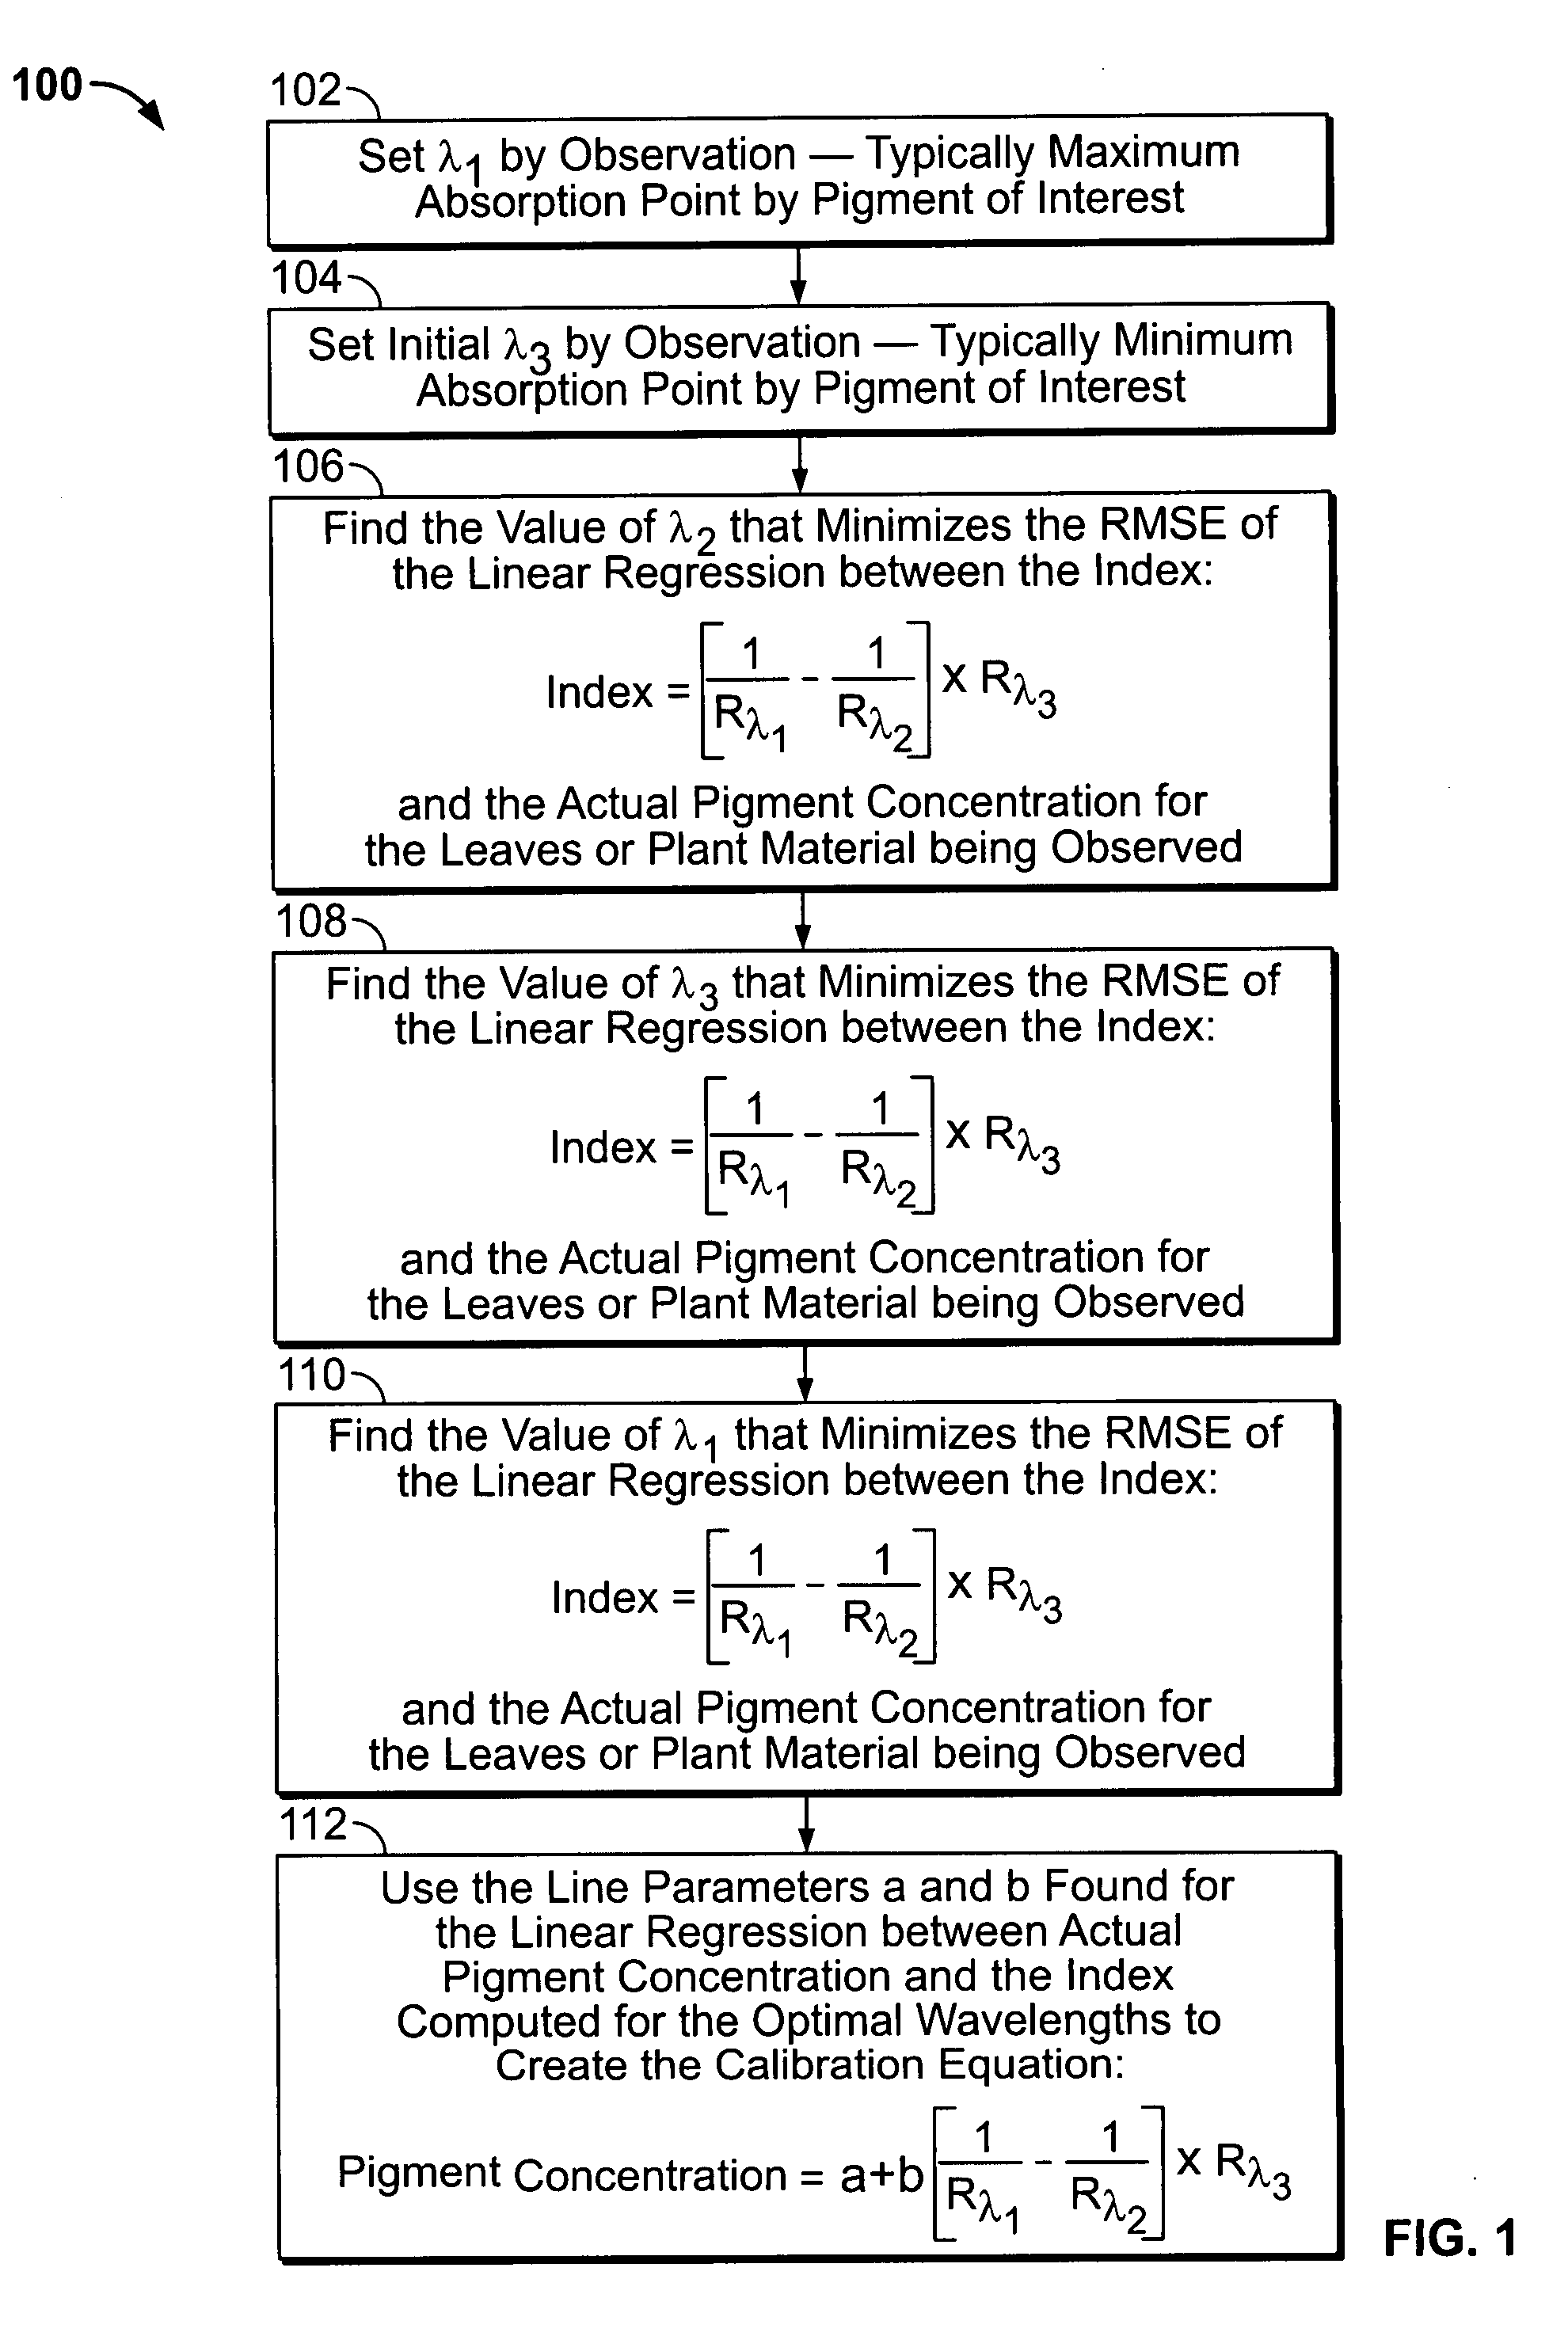
[0019] Identification of the wavelengths where the index value most accurately correlates with pigment concentration is accomplished through a step-wise refinement method. The principles are to identify a wavelength, represented by λ1, where the reflectance, and hence the derived index, varies with the concentration of the pigment of interest as well as the concentrations of all other pigments and variation in conditions. Then a second wavelength, represented by λ2, where the reflectance, and hence the derived index, varies with the concentrations of all pigments and conditions except the concentration of the pigment of interest. The inverses of the reflectances at these wavelengths, which are closely related to the absorbances at these wavelengths, are differenced. The result is a number which varies primarily just with the concentration of the pigment of interest. The reflectance at a third wavelength, represented by λ3, is used to compensate for the amount of light reflection due to conditions, such as substances or physical characteristics of that which is producing the reflectance, not associated with pigments.
[0020] In the process of determining how the index and the actual pigment concentration relate, a linear equation is derived, the calibration equation, which allows the index value to be converted directly into a measurement of the concentration of the pigment of interest. This equation may be written:Pigment Concentration=a+b[[R(λ1)−1−R(λ2)−1]×R(λ3)]  (2)

Problems solved by technology

These indices typically have limitations in the range of use, in their inherent accuracy, and in their dependence upon ancillary measurements.
This index has an intrinsic error which increases at high levels of non-vegetated or vegetated area.
In general, these instruments, however, are very complex and costly and use hundreds to thousands of wavelength bands in order to perform the analysis.
While contact or near-contact instruments—such as the Minolta SPAD and Carter CMI 2000—measure chlorophyll content in leaves, they are not optimized for chlorophyll (and may have inherent errors) and cannot be used for a variety of pigments.

Method used


Image

  • System and methods for non-destructive analysis
  • System and methods for non-destructive analysis
  • System and methods for non-destructive analysis

Examples


Embodiment Construction

[0034] The present invention is a system and methods by which the state or condition of an object may be determined through the analysis of spectral bands. One embodiment of the present invention automatically detects a first spectral band having an absorption that is highly sensitive to the color of the object, such as that produced through a colorant or a pigment of interest. The embodiment then may automatically detect a second spectral band having absorption sensitive to color resulting from other colorants or pigments other than the pigment of interest. A third spectral band may also be automatically detected that is sensitive to reflective differences caused by variation in conditions. Subtracting the absorption in the first band by the second band and multiplying the result by the amount of light reflected in the third band results in the index. The index can be highly correlated with the concentration of the colorant of interest.

[0035]FIG. 1 illustrates a flow chart 100 of ...


PUM

PropertyMeasurementUnit
optimal wavelengthaaaaaaaaaa
reflectanceaaaaaaaaaa
physicalaaaaaaaaaa

Abstract

A system and methods by which the state or condition of an object may be determined through the analysis of spectral bands. One embodiment of the present invention automatically detects a first spectral band having an absorption that is highly sensitive to the color of the object, such as that produced through a colorant or a pigment of interest. The embodiment then may automatically detect a second spectral band having absorption sensitive to color resulting from other colorants or pigments other than the pigment of interest. A third spectral band may also be automatically detected that is sensitive to reflective differences caused by variation in conditions. Subtracting the absorption in the first band by the second band and multiplying the result by the amount of light reflected in the third band results in the index. The index can be highly correlated with the concentration of the colorant of interest.

Description

[0001] This application claims the benefit of U.S. Provisional Application No. 60 / 811,978 filed Jun. 8, 2006.FIELD OF THE INVENTION [0002] The present invention relates generally to non-destructive analysis of objects, and in particular the present invention relates to analysis of objects based on coloration. Such coloration may be due to colorant or pigment. BACKGROUND OF THE INVENTION [0003] Light striking an object can produce a number of effects including absorption, reflection, and transmission. Light is absorbed by the object, reflected by the object, or transmitted through the object. The amount of absorption, reflection, and transmission vary in accord with the wavelength and the characteristics of the illuminated object. [0004] A variety of methods are known to determine the physical characteristics of an object. For example, there are many indices by which the physical characteristics of vegetation may be determined. These indices typically have limitations in the range of...

Claims


Application Information

Patent Timeline
Patent Type & Authority Applications(United States)
IPC IPC(8): G01N21/00G01N21/55
CPCG01N2021/8466G01N21/55
Inventor GITELSON, ANATOLYMERZYLAK, MARKRUNDQUIST, DONALD C.
Owner BOARD OF RGT UNIV OF NEBRASKA
Learn More