
Method and system for dynamic, three-dimensional network performance representation and analysis

a network performance and analysis technology, applied in the field of data network monitoring systems, can solve the problems of packet drop, time and expense of repairing the identified problems, and the difficulty of overcoming the lack of visibility into,

Inactive Publication Date: 2008-10-09
COMP ASSOC THINK INC
View PDF6 Cites 21 Cited by
  • Summary
  • Abstract
  • Description
  • Claims
  • Application Information

AI Technical Summary

Benefits of technology

[0012]Techniques for dynamic, three-dimensional network performance and quality of service presentation and analysis are here provided that overcome or substantially eliminate limitations associated with prior methods and systems.

Problems solved by technology

Once a performance problem is identified, a next hurdle to overcome is lack of visibility into the root cause of the problem or even where the problem occurred.
Then, there is the time and expense of repairing the identified problems.
Over-utilization of interface and backplane resources also can lead to packet drop, route flapping, reduction of data throughput, and device instability.
Another significant contributor to network performance issues concerns the existence of errors in networking equipment due to hardware / software malfunction or configuration errors.
Presently, the methods and systems for dynamically viewing or otherwise sensing network performance are limited.
Generally, such systems, while perhaps being capable of performing dynamic reporting and visualization, are two-dimensional, providing graphs and charts of network performance, and may fail to portray a clear view for all concerned with network performance analysis.
Also, because of the large amount of network performance data that may be generated across a large enterprise network, it is simply not possible, using known systems to extract all meaningful data that network performance system may provide.

Method used


Image

  • Method and system for dynamic, three-dimensional network performance representation and analysis
  • Method and system for dynamic, three-dimensional network performance representation and analysis
  • Method and system for dynamic, three-dimensional network performance representation and analysis

Examples


Embodiment Construction

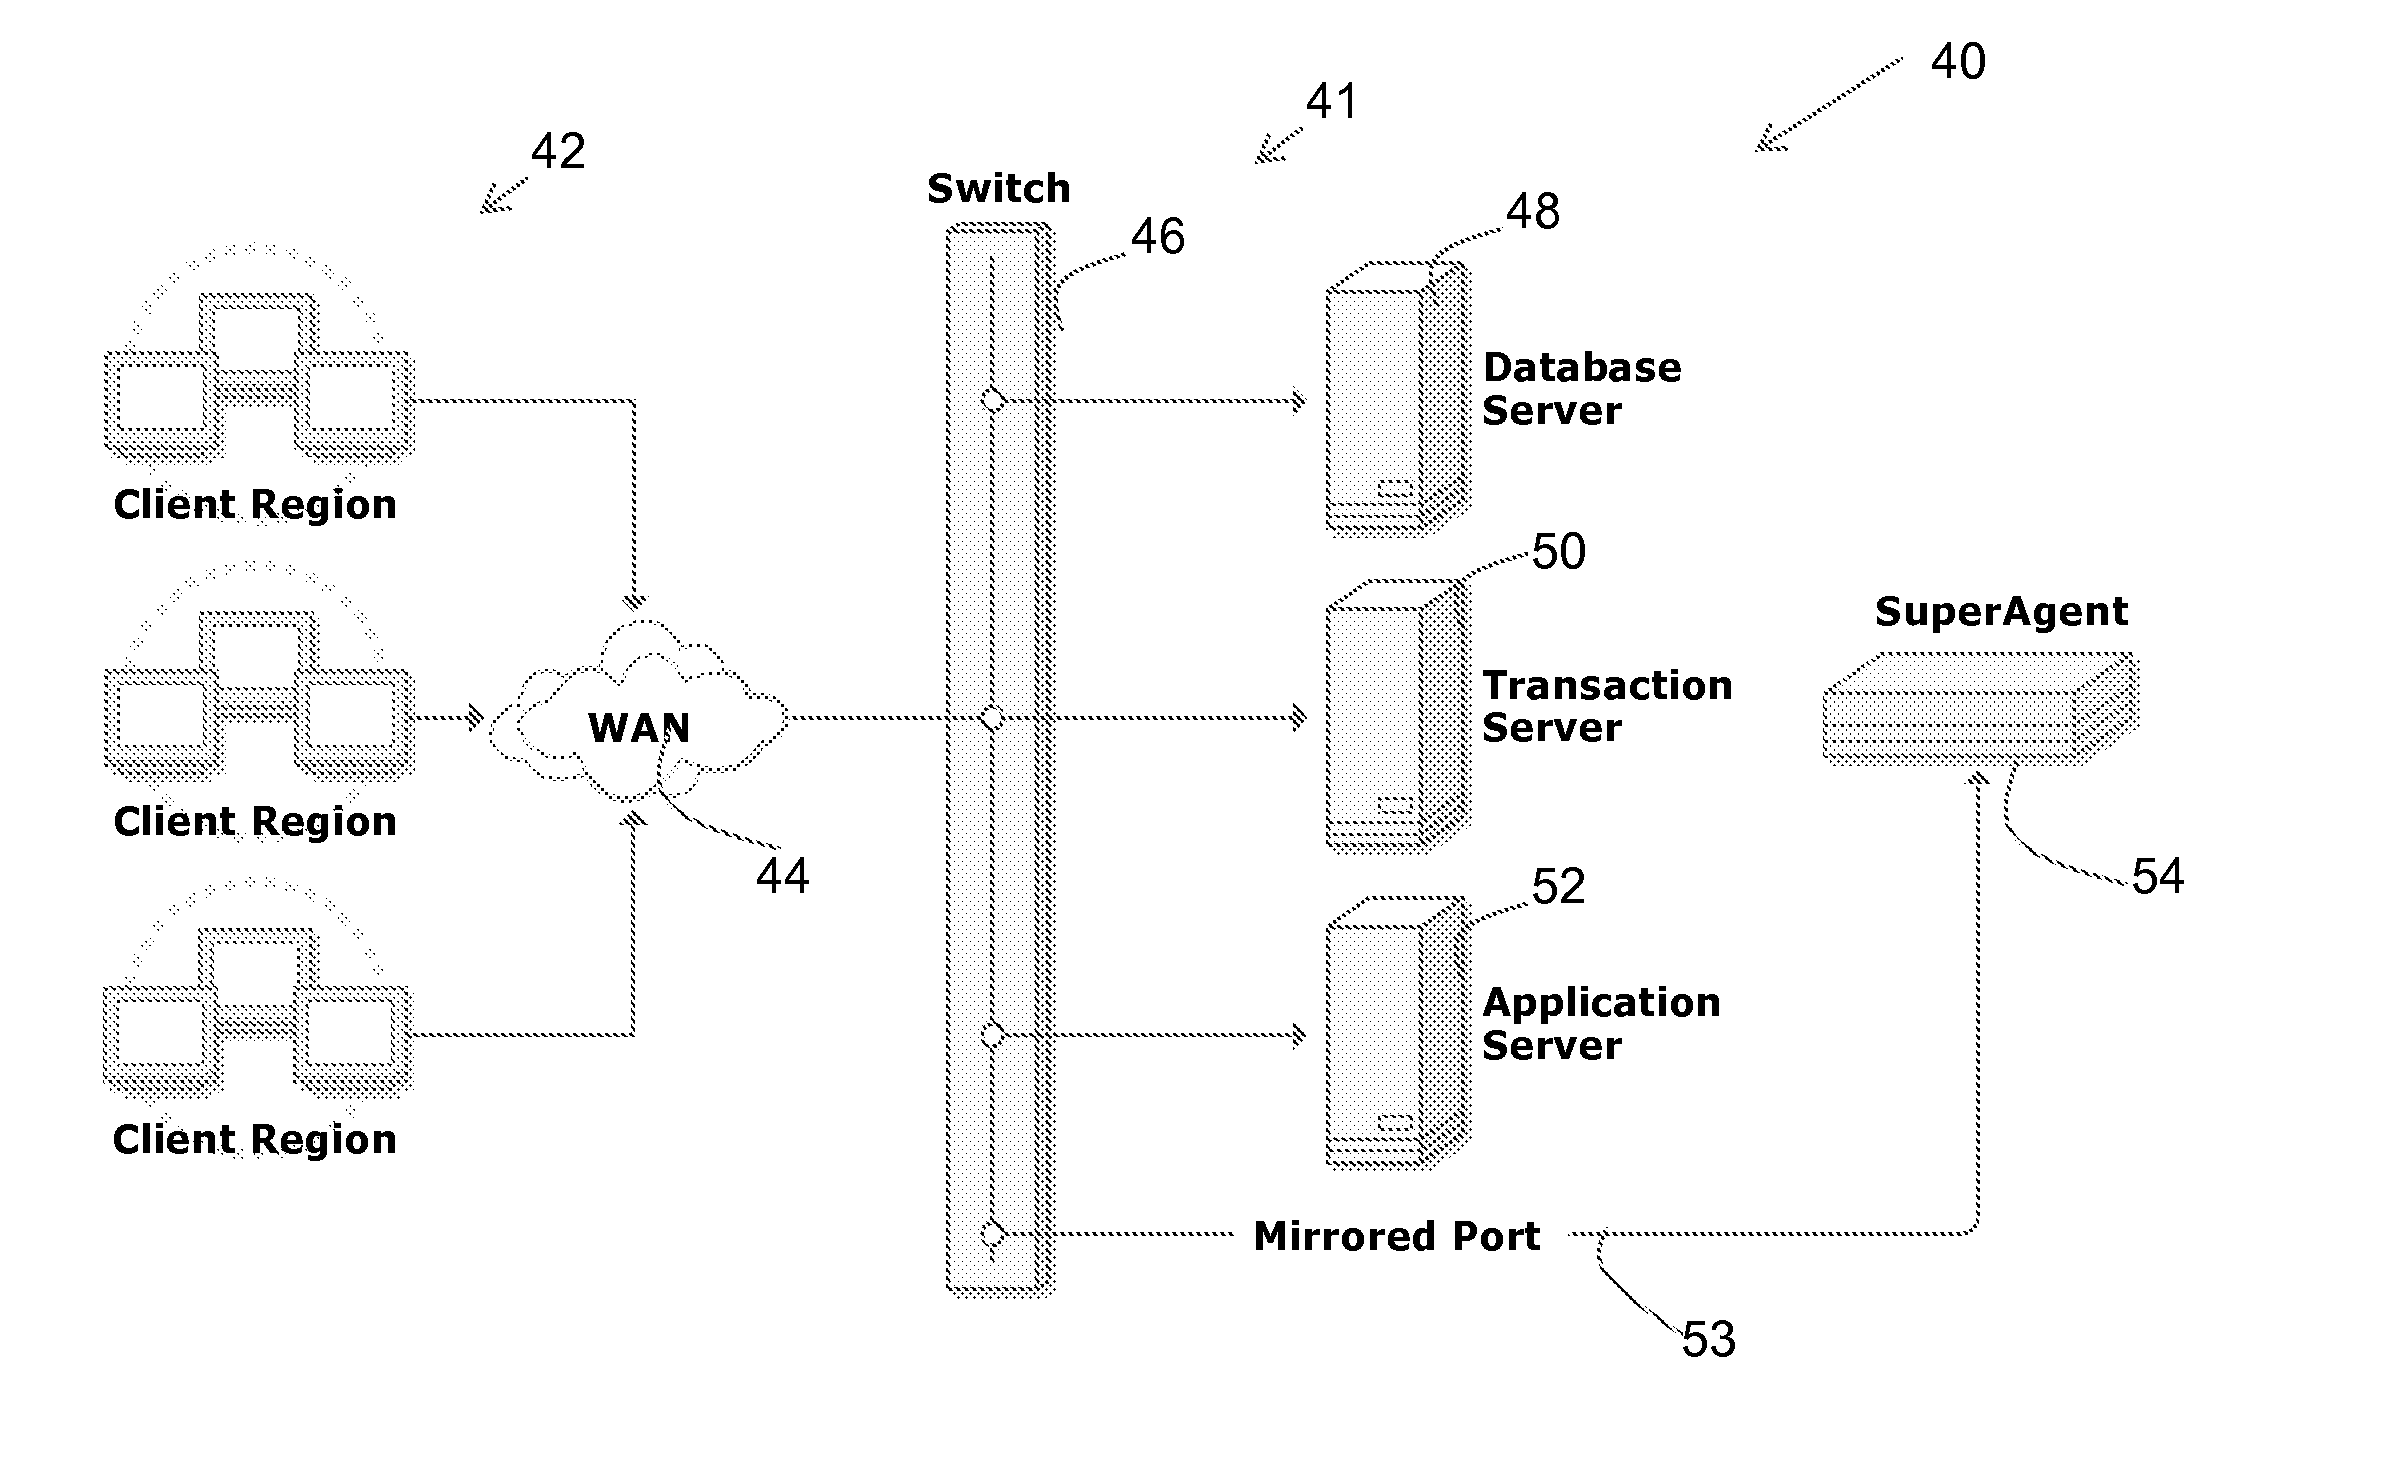
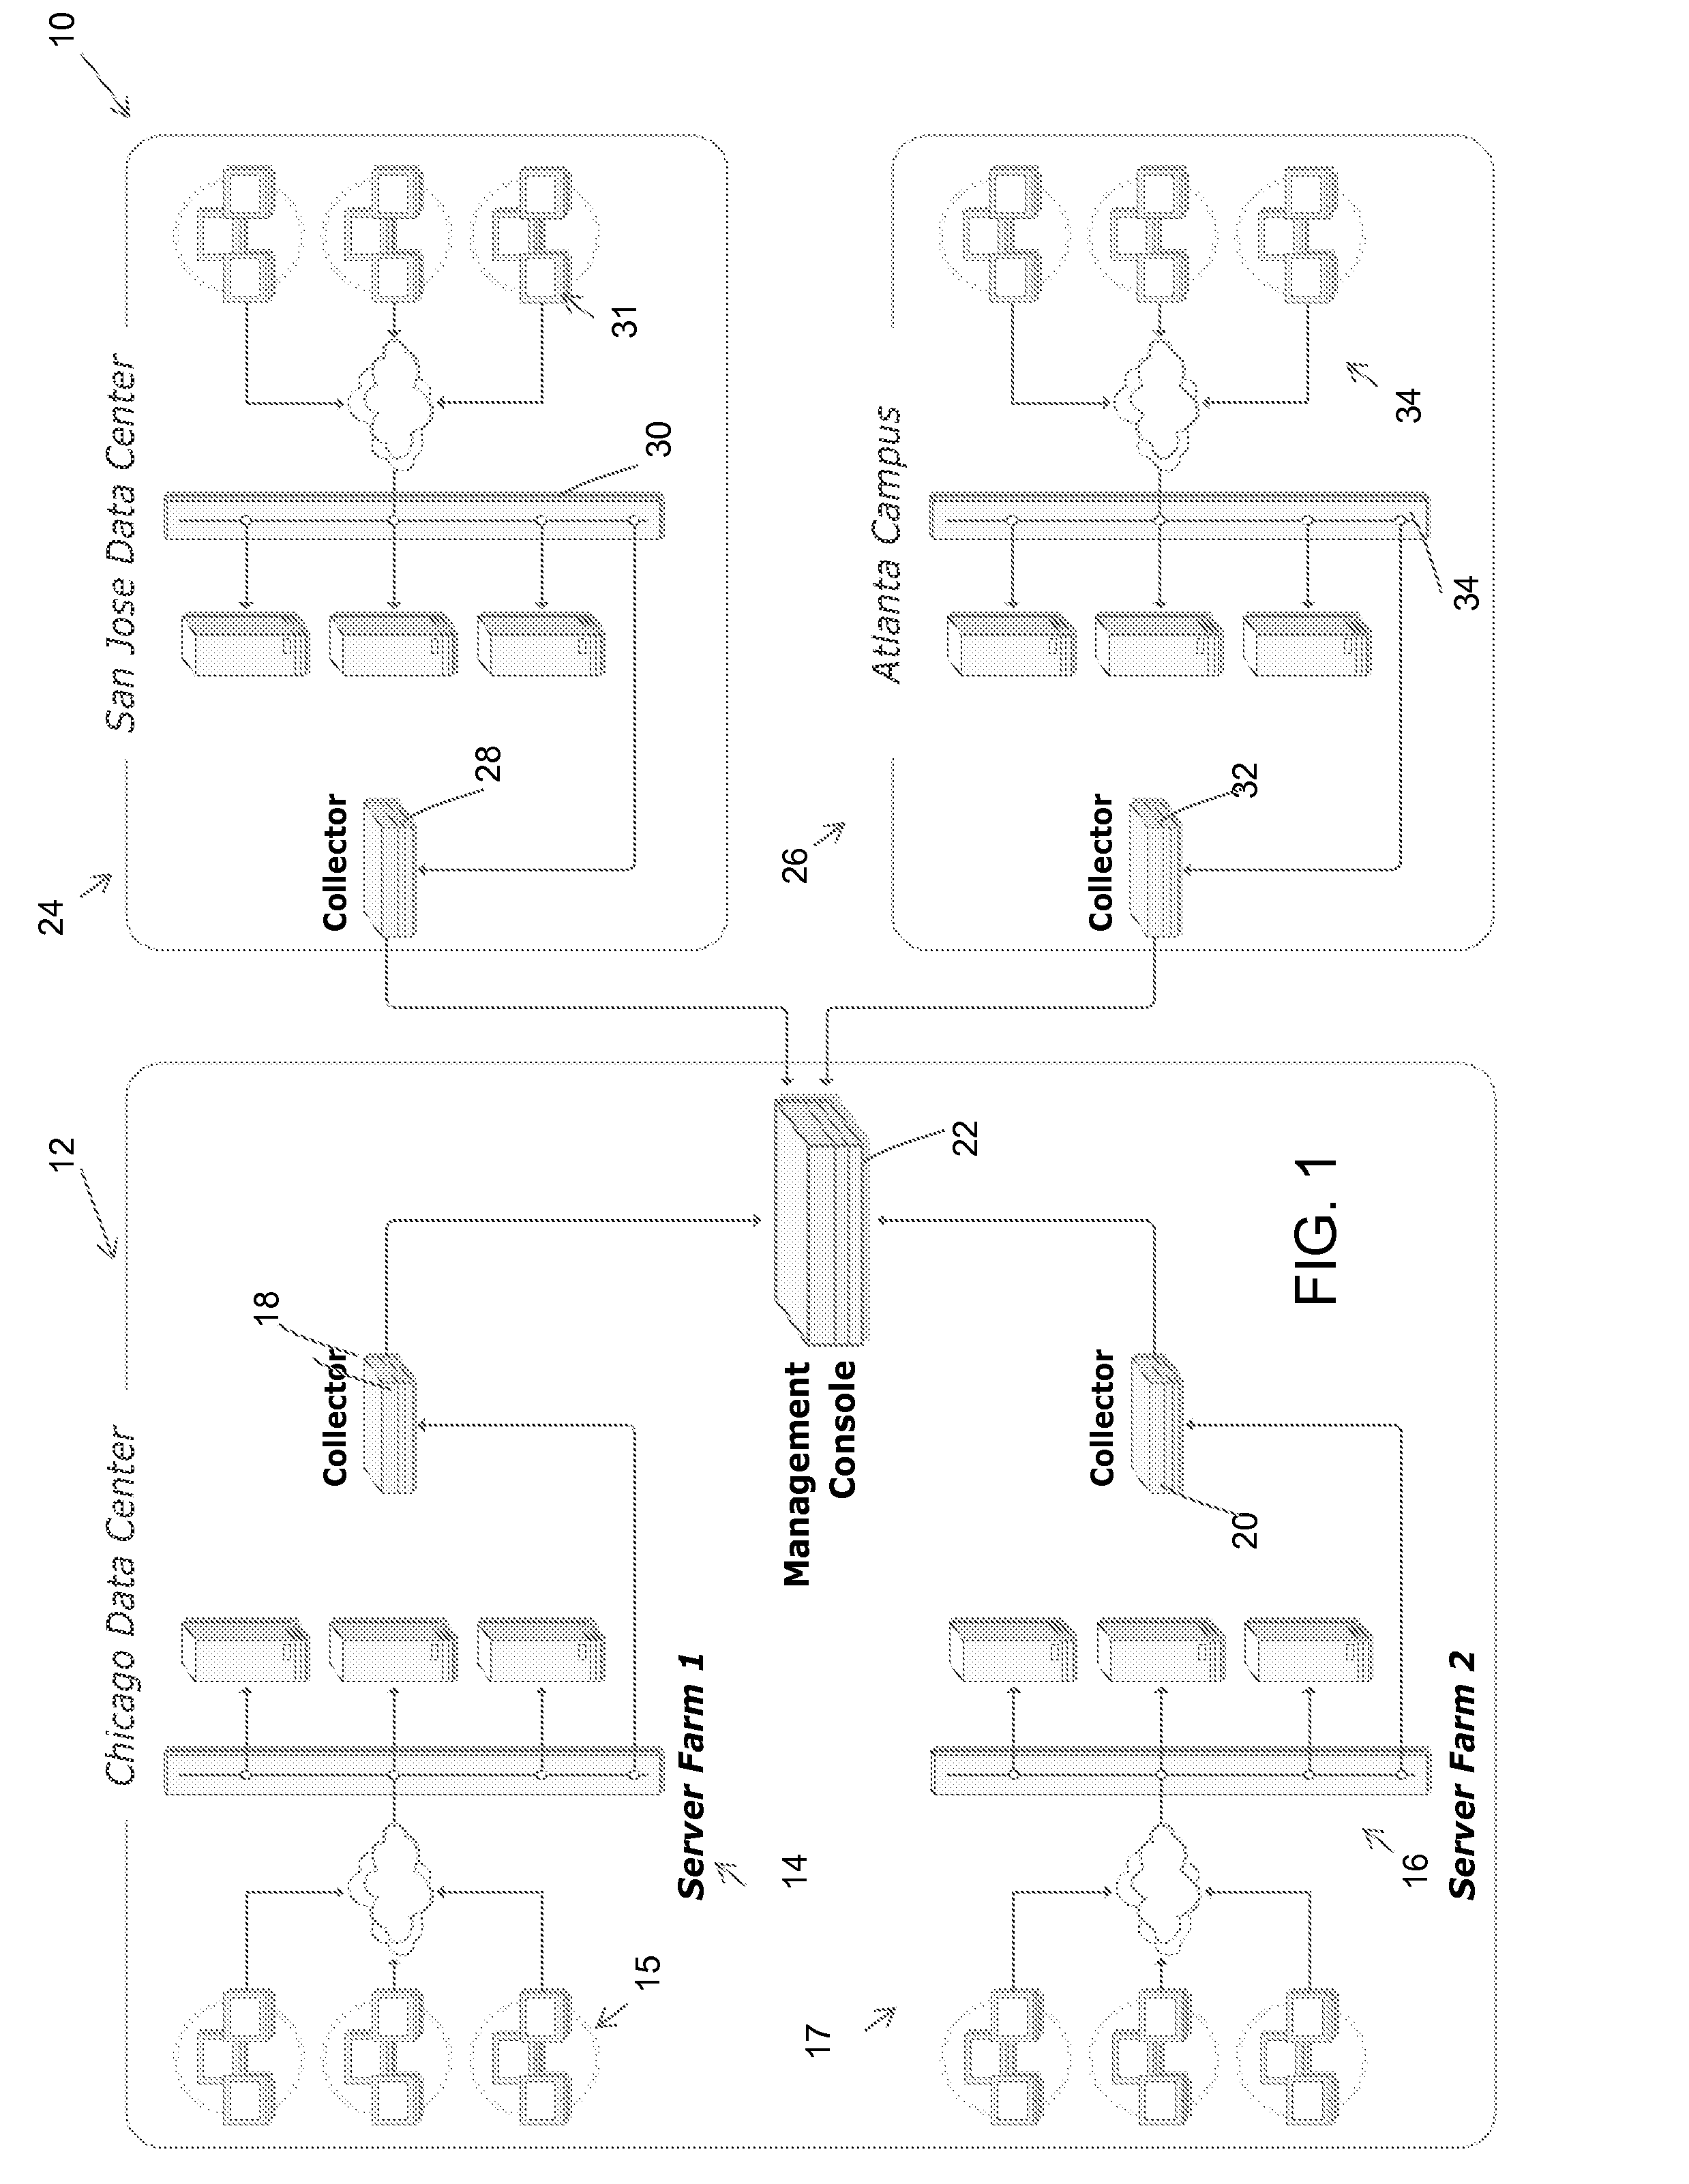
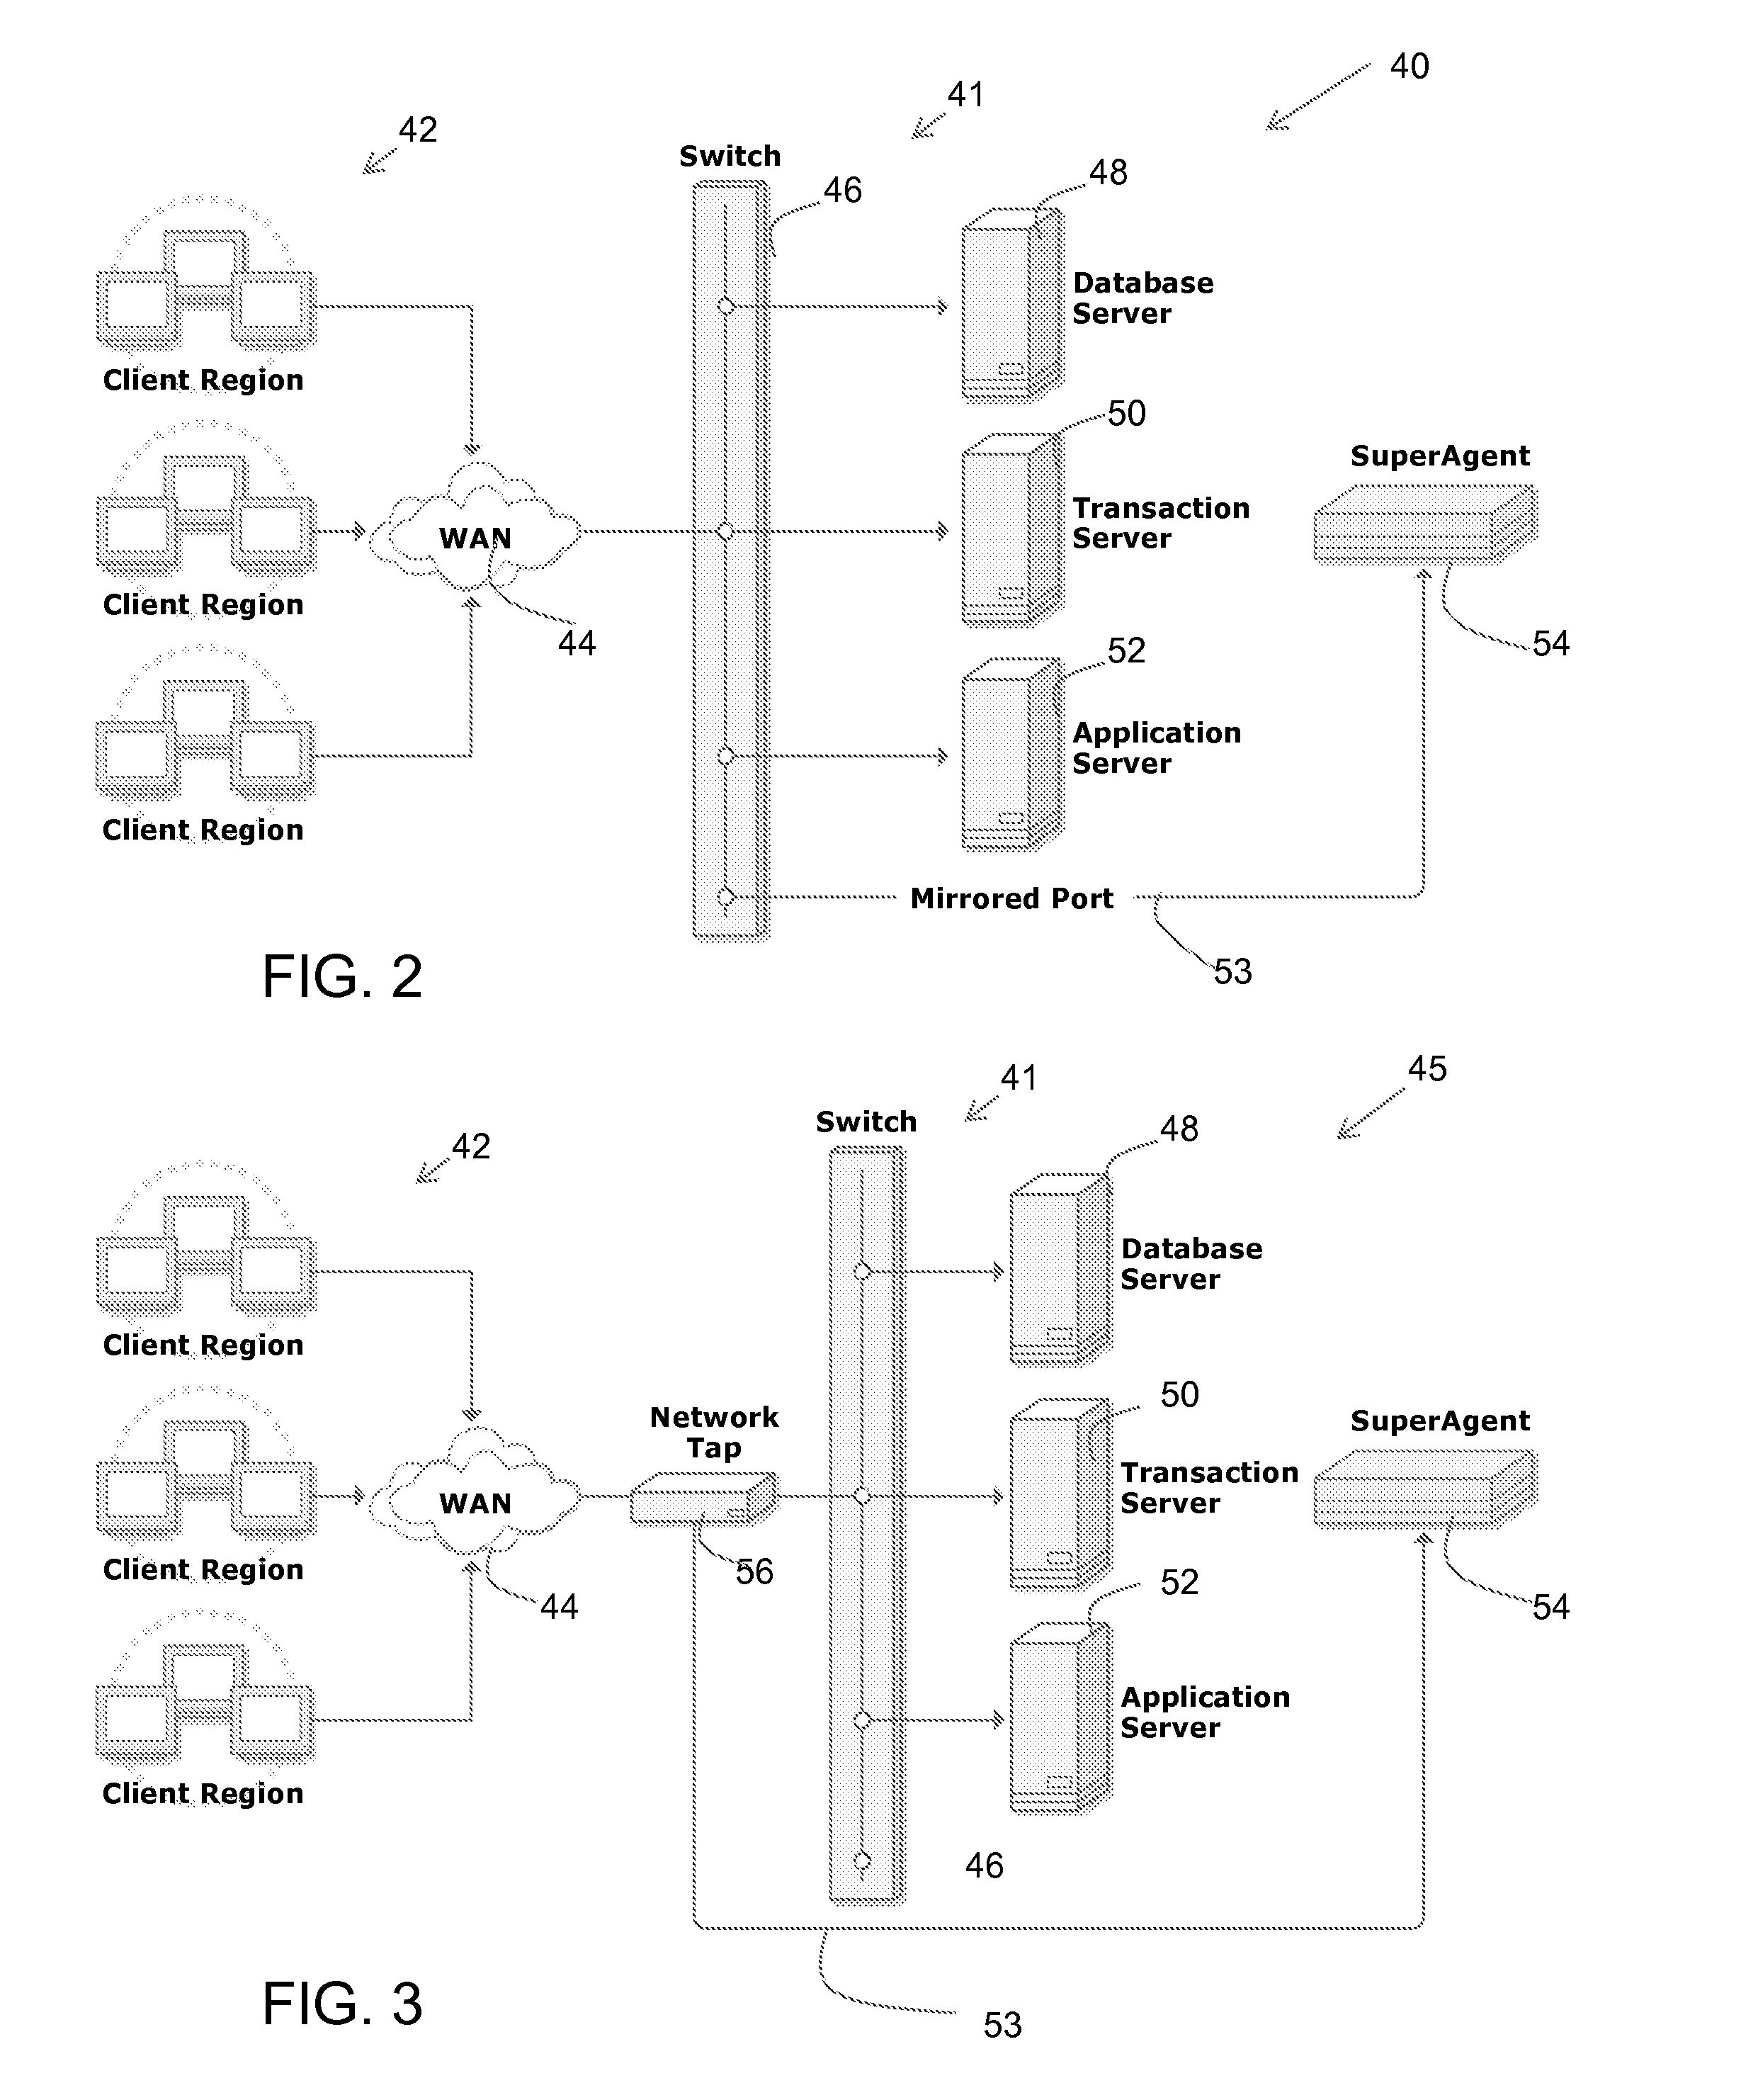
[0027]The disclosed subject matter provides data center appliance that passively monitors end-to-end performance for all users accessing local server farm services. The present disclosure provides, in particular, a dynamic three-dimensional, visual representation of end-user response time and identifies network, server, and application components for measuring user throughputs, loss rates, byte rates, session refusals, and other metrics. In certain embodiments, the present disclosure dynamically provides visual and auditory representations of network performance metrics, which metrics representations are highly user controllable. As a result, the present disclosure allows a user to automatically detect and investigate performance issues in real time. Using the dynamic three dimensional representation of the present disclosure, both availability and performance SLAs to document consistent levels of service quality for internal and external use.

[0028]The disclosed subject matter techn...


PUM


Abstract

Techniques for representing data network performance characteristics from many different sources shows in three-dimensions client stations representations, server station(s) representations, and various forms of data transmission representations a video animation subsystem. Operational characteristics representations associate with the client stations, server system, data transmission representations forming a dynamic, three-dimensional representation of the network for displaying operational characteristics of the client stations, server system(s), and data transmission. The dynamic, three-dimensional representation of the network interfaces with a network performance analysis system for further analyzing perceived operational characteristics with reference to a plurality of network performance metrics from the network performance analysis system.

Description

FIELD[0001]The disclosed subject matter relates to data network monitoring systems and processes such as may find use in network performance reporting and analysis. More particularly, this disclosure relates to a novel and improved method and system for dynamically generating and presenting three-dimensional, time-based video images representing network performance and quality of service across data networks of a wide variety of sizes located in myriad geographic locations worldwide.DESCRIPTION OF THE RELATED ART[0002]Network diagnostics provide requisite visibility for managing network performance to avoid unexpected and costly consequences of failing to have key diagnostic information. Visibility is so important that it stands alone as a sentence in any document, text, or presentation on network performance. Imagine attempting to manage network performance across an enterprise without knowing who is using the network, when they are using the network, and without knowing if the rou...

Claims


Application Information

Patent Timeline
IPC IPC(8): G06F3/048
CPCG06F3/04815G06F3/0486H04L41/22H04L41/5009H04L43/045H04L43/0829H04L43/0864H04L43/0894H04L43/16
Inventor JOHNS, MICHAEL CHARLES
Owner COMP ASSOC THINK INC
Learn More