Selecting spectral elements and components for optical analysis systems

Active Publication Date: 2009-08-27
HALLIBURTON ENERGY SERVICES INC
View PDF6 Cites 61 Cited by
  • Summary
  • Abstract
  • Description
  • Claims
  • Application Information

AI Technical Summary

Benefits of technology

[0030]The system components in this aspect may include a plurality of detectors, and the optimal signal-to-noise ratio may be determined by evaluating expected signal levels and using a noise equivalent power of the detectors as a noise level.
[0031]The system components in this aspect may include a plurality of detectors and the optimal signal-to-noise ratio may be determined by evaluating an expected signal level and using photon-limited noise where photon noise associated with the signal level is sufficiently high to overwhelm detector noise.
[0032]Further in this aspect of the disclosure, the method may include ranking the system components relative to each other to select an optimal system. The method may also include manufacturing the optimal system.
[0033]According to another aspect of the disclosure, a method of selecting spectral elements and system components for a multivariate optical analysis system may include providing spectral calibration data for a sample of interest; identifying a plurality of combinations of system components; modeling performance of a pilot system with one of the combinations of system components; determining optimal characteristics of the pilot system; and selecting optimal system components from among the combinations of system components. In this aspect,

Problems solved by technology

In general, a simple measurement of light intensity is difficult to convert to information because it likely contains interfering data.
It is often impossible to adequately measure the data relating to one of these factors since the contribution of the other factors is unknown.
Depending on the circumstances, however, the estimate may be unacceptably inaccurate since factors other than eth

Method used


Image

  • Selecting spectral elements and components for optical analysis systems
  • Selecting spectral elements and components for optical analysis systems
  • Selecting spectral elements and components for optical analysis systems

Examples


example 1

[0081]The breadboard system 210 introduced above with respect to FIG. 6 was used to measure concentrations of various sample mixture S. The system 210 was configured based on the mixture S being tested. An exemplary configuration of the system 210 included:

[0082]Illumination: 20 w GILWAY lamp

[0083]Spectral elements: 5 mm deuterium oxide (D2O), 5 mm Germanium

[0084]Optical window: fiber optic probe

[0085]Detector: InAr detector from Judson

[0086]MOE: specific to test

example 2

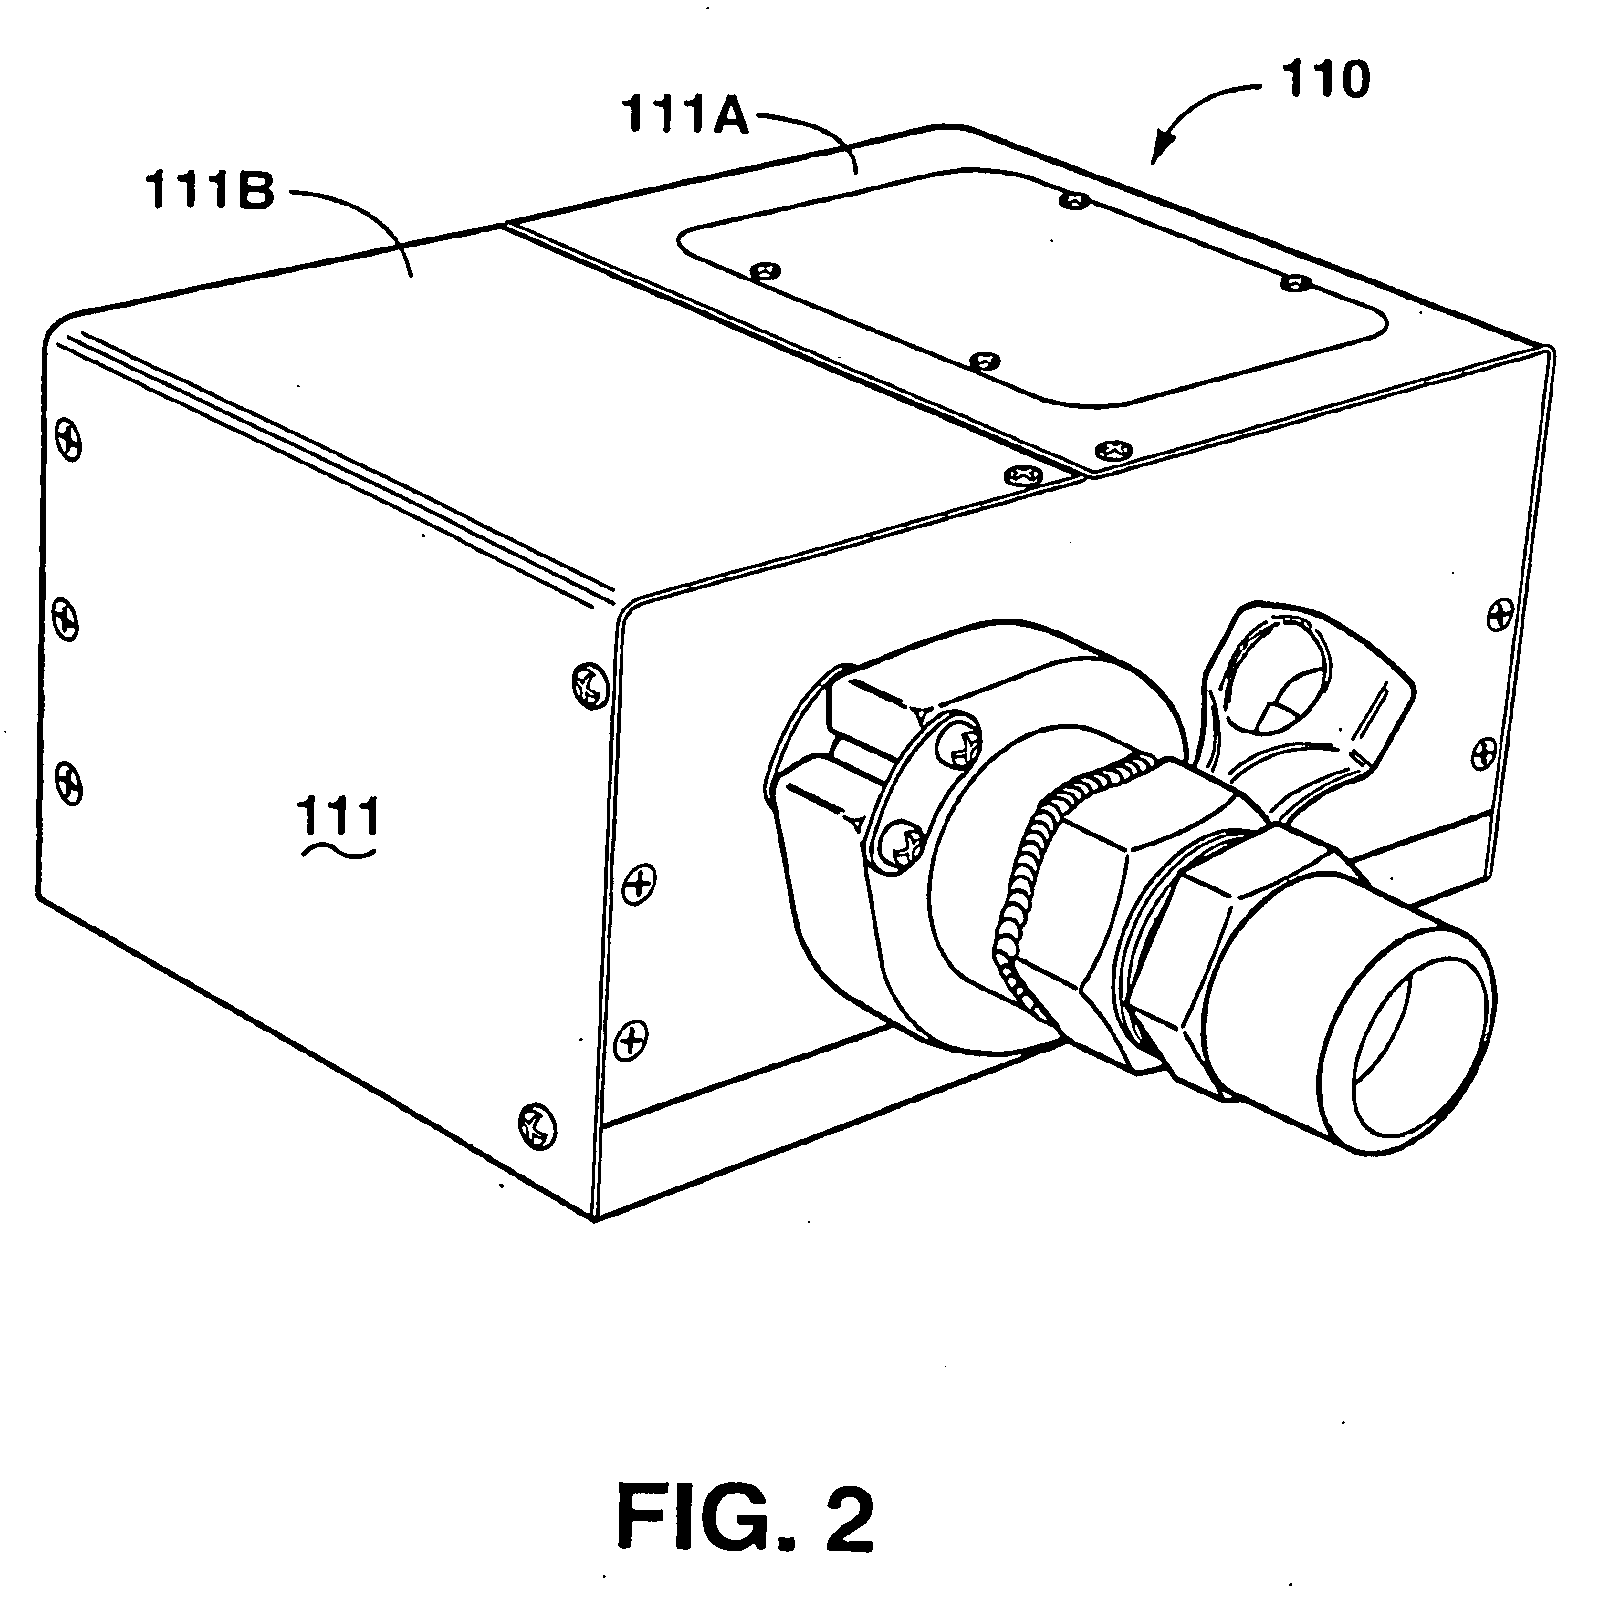
[0087]The system 110 introduced above with respect to FIG. 2 was used to make measurements on a mixture of aspirin and lactose as well as various other sample mixture S. The system 110 was configured based on the mixture being tested. The aspirin / lactose testing was performed using static testing in which the powdered sample with a known composition was placed in a dish and the system light beam was focused on the powdered sample. The output of the detectors was monitored and recorded. The aspirin / lactose samples covering the range of 100% aspirin to 100% lactose were tested. An exemplary configuration of the system 110 included:

[0088]Illumination: 20 w GILWAY lamp

[0089]Spectral elements: 5 mm D2O, 5 mm Germanium

[0090]Optical window: none

[0091]Detector: PbS detector from New England Photoconductor

[0092]MOE: specific to test conditions

example 3

[0093]The system 110 was used again to make measurements on a mixture of aspirin and lactose. The system 110 was configured based on the mixture being tested. The aspirin / lactose testing was performed using dynamic conditions in which the lactose powder was placed in the bowl of a mixer and the measurement system was attached to the bowl using a Swagelok® brand connector / fitting. A sapphire window was used to contain the powder in the bowl and allow the system 110 to interrogate the powder. With the mixer turning, known amounts of aspirin were added and the system output signal was monitored and recorded. Aspirin was added in several allotments to about 37% final aspirin concentration. The configuration of the system 110 used in this example included:

[0094]Illumination: 20 w Gilway lamp

[0095]Spectral elements: 5 mm D2O, 5 mm Germanium

[0096]Optical window: sapphire window

[0097]Detector: PbS detector from New England Photoconductor

[0098]MOE: specific to test conditions


PUM


Abstract

Methods of selecting spectral elements and system components for a multivariate optical analysis system include providing spectral calibration data for a sample of interest; identifying a plurality of combinations of system components; modeling performance of a pilot system with one of the combinations of system components; determining optimal characteristics of the pilot system; and selecting optimal system components from among the combinations of system components.

Description

CROSS-REFERENCE TO RELATED APPLICATIONS[0001]This application claims benefit of and priority to U.S. Provisional Patent Application Ser. No. 60 / 740,044, filed Nov. 28, 2005; incorporated herein by reference in its entirety.BACKGROUND OF THE DISCLOSURE[0002]Light conveys information through data. When light interacts with matter, for example, it carries away information about the physical and chemical properties of the matter. A property of the light, for example, its intensity, may be measured and interpreted to provide information about the matter with which it interacted. That is, the data carried by the light through its intensity may be measured to derive information about the matter. Similarly, in optical communications systems, light data is manipulated to convey information over an optical transmission medium, for example fiber optic cable. The data is measured when the light signal is received to derive information.[0003]In general, a simple measurement of light intensity is...

Claims


Application Information

Patent Timeline
IPC IPC(8): G01J3/06G06F15/00
CPCG01J3/02G01J3/0208G01J3/021G01J3/0232G01J3/0286G01J3/0291G06F17/5086G01J3/28G01N21/274G01N21/31G06F17/5009G06F17/50G06F17/18G01J3/08G06F30/00G06F30/17G06F30/20
Inventor PRIORE, RYAN J.FREESE, ROBERT P.MYRICK, MICHAEL L.BLACKBURN, JOHN C.
Owner HALLIBURTON ENERGY SERVICES INC
Why Eureka
Try Eureka