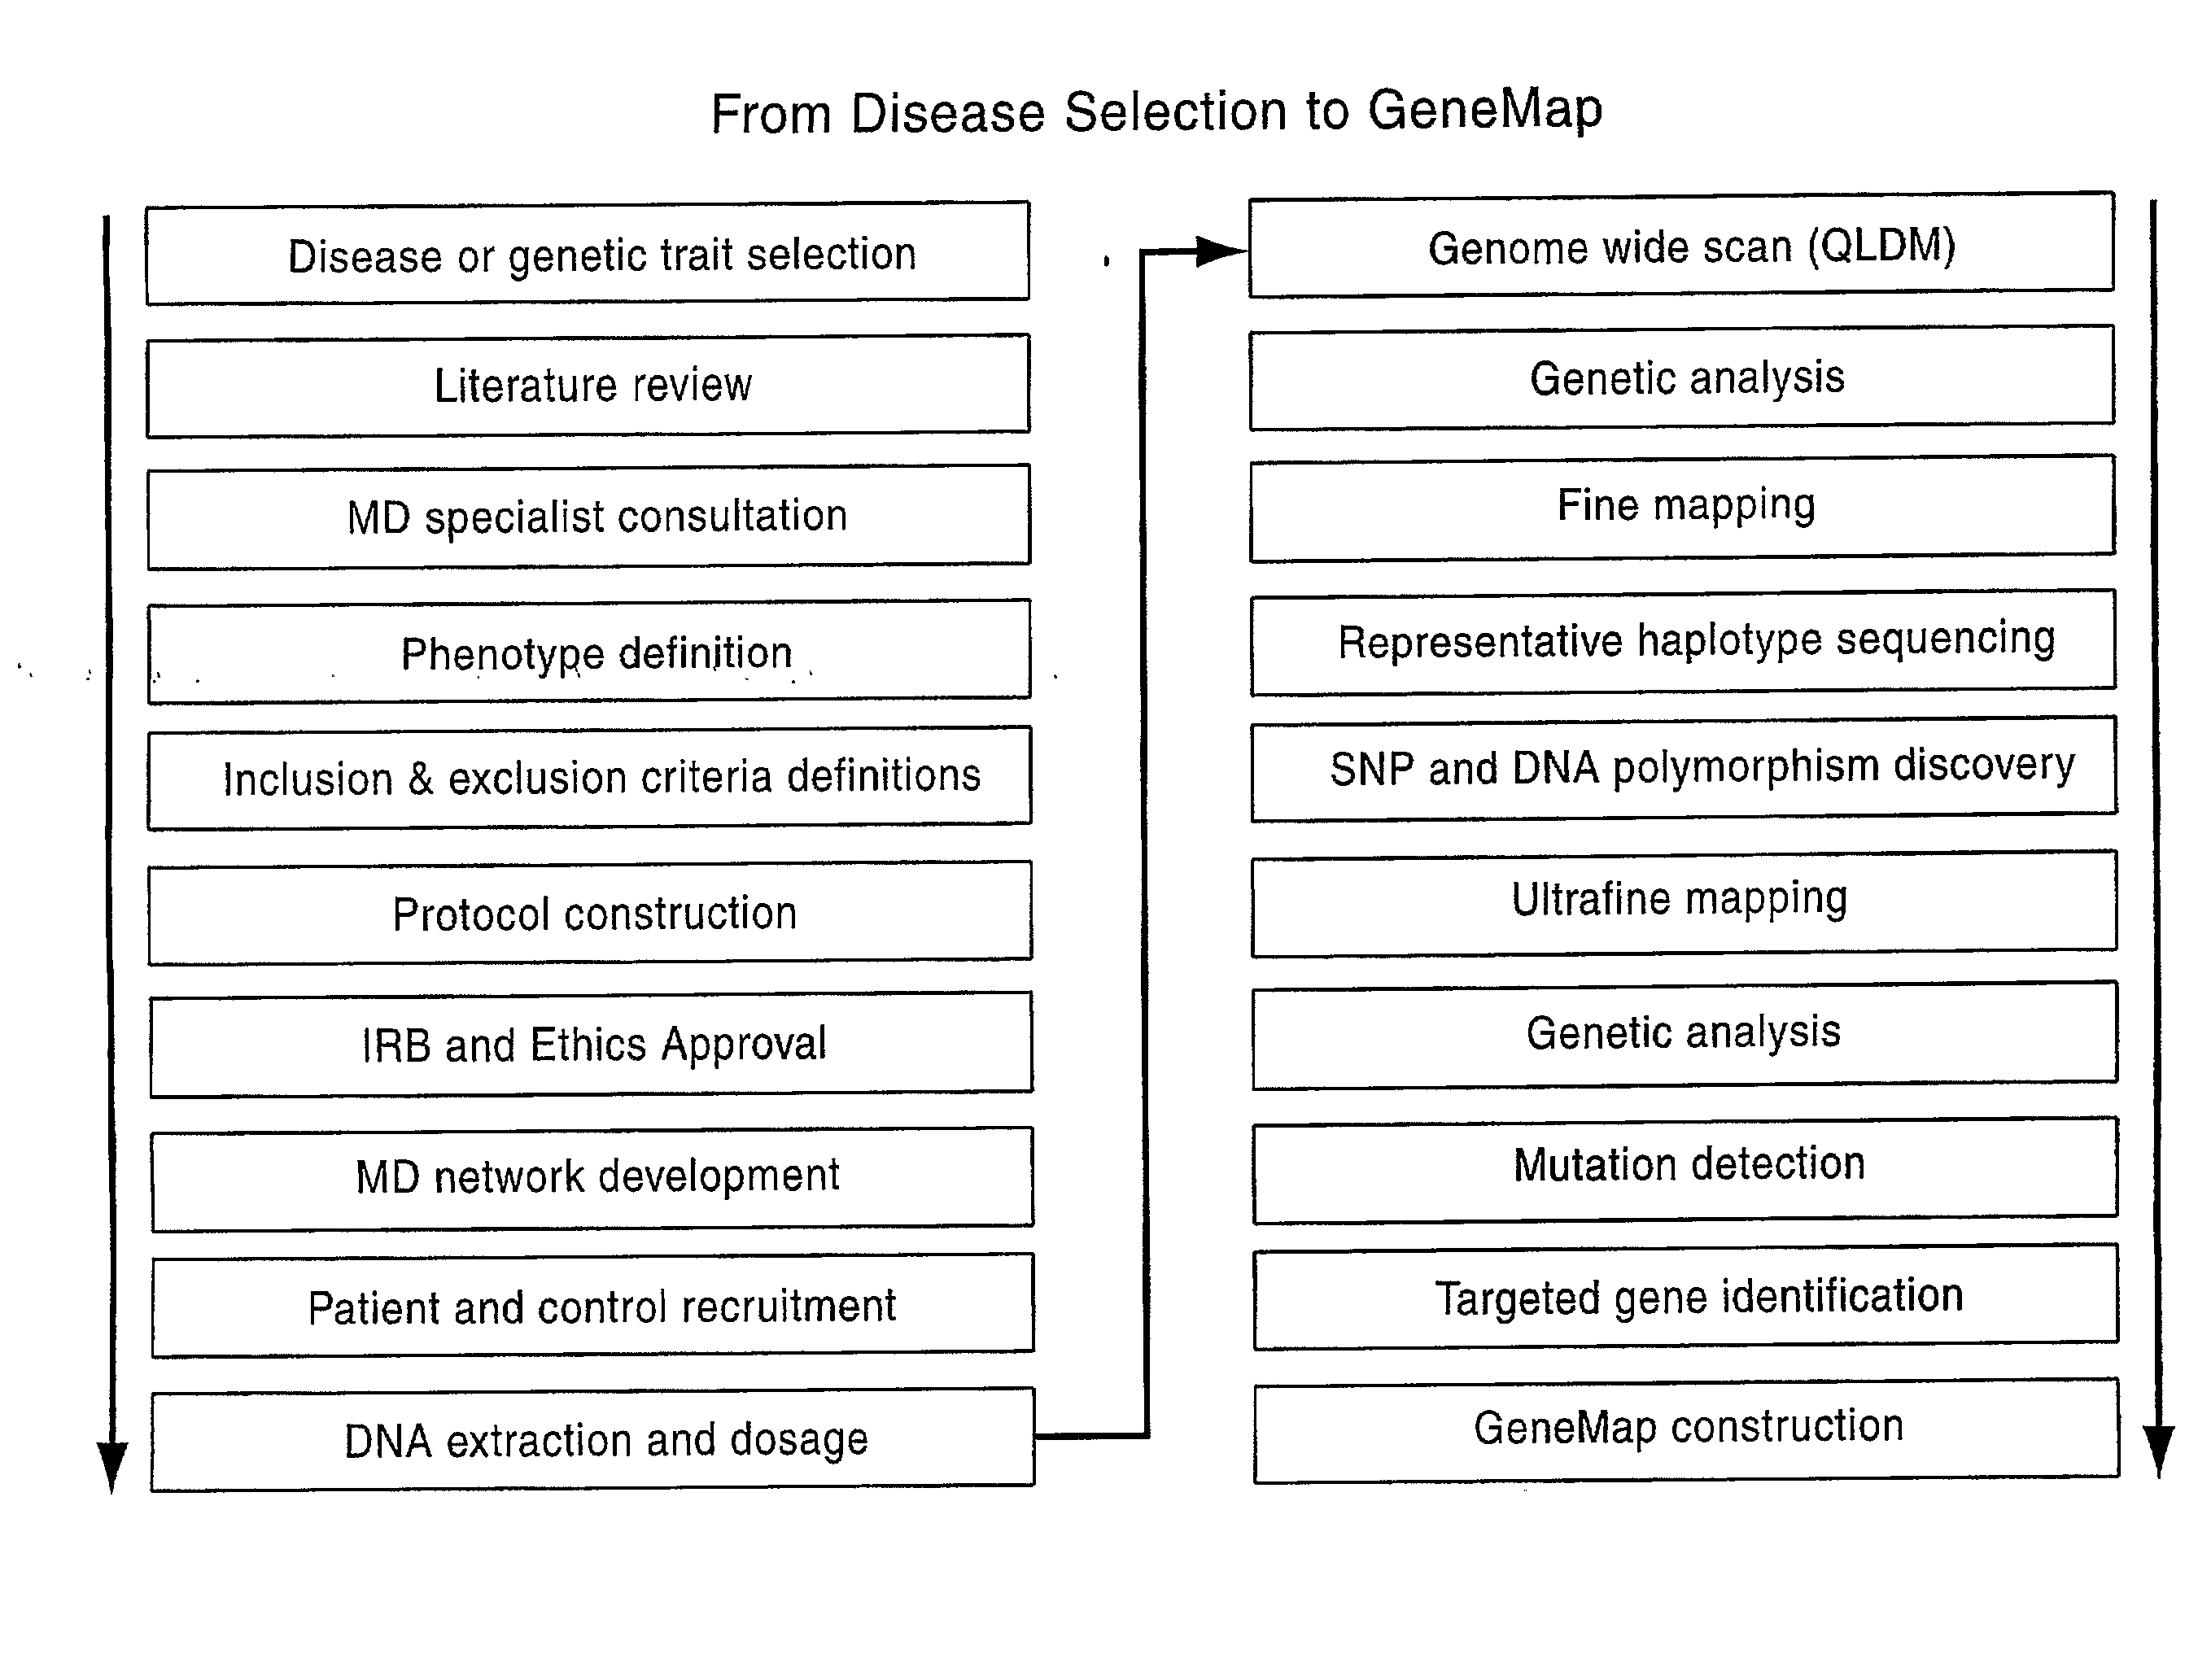
Genemap of the human genes associated with longevity
a human gene and gene mapping technology, applied in the field of gene mapping of human genes associated with longevity, can solve the problems of not being repeated, unable to detect any particular gene, and difficult to detect low relative risk alleles
- Summary
- Abstract
- Description
- Claims
- Application Information
AI Technical Summary
Problems solved by technology
Method used
Image
Examples
example 1
Identification of Cases and Controls
[0199]All individuals were sampled from the Quebec founder population (QFP). Membership in the founder population was defined as having four grandparents with French Canadian family names who were born in the Province of Quebec, Canada or in adjacent areas of the Provinces of New Brunswick and Ontario or in New England or New York State. The Quebec founder population has two distinct advantages over general populations for LD mapping. Because it is relatively young, about 12 to 15 generations from mid-17th century to present, and because it has a limited but sufficient number of founders, approximately 2600 effective founders (Charbonneau et al. 1987), the Quebec population is characterized both by extended LD and by decreased genetic heterogeneity. The increased extent of LD allows the detection of genes affecting the trait using a reasonable marker density, while still allowing the increased meiotic resolution of population-based mapping. The nu...
example 2
Genome Wide Association
[0205]Genotyping was performed using Perlegen Life Sciences ultra-high-throughput platform. Loci of interest were amplified and hybridized to wafers containing arrays of oligonucleotides. Allele discrimination was performed through allele-specific hybridization. In total, 248,535 SNPs, spread over 3 microarrays, were genotyped. This set of markers contained the QLDM (Quebec LD Map), a map created specifically for the Quebec founder population, which possesses a base density of one marker per 40 kb and up to one marker per 10 kb in low-LD regions, the lower the LD is in a given area, the higher the marker density will be. The QLDM markers and other markers were selected from various databases including the ˜1.6 million SNP database of Perlegen Life Sciences (Patil, 2001), the hapmap consortium database and dbSNP at NCBI. The SNPs were chosen to maximize uniformity of genetic coverage and as much as possible, with a minor allele frequency of 10% or higher.
[0206]...
example 3
[0207]The raw data generated by the GWS approach (Example 2 herein) was analyzed by various means to identify candidate regions (see also Confirmatory Mapping and Fine Mapping described in Example 5).
Raw Data Analysis by Perlegen
[0208]The data analysis process compares the relative fluorescence intensities of features corresponding to the reference allele of a given SNP with those corresponding to the alternate allele, to calculate a p-hat value. The latter is proportional to the fluorescence signal from perfect match features for the reference allele divided by the sum of fluorescence signals from perfect match features for the reference plus the alternate alleles. P-hat assumes values close to 1 (typically 0.9) for pure reference samples and close to 0 (typically 0.1) for pure alternate samples, and can be used as a measured estimate of the reference allele frequency of a SNP in a DNA pool. The difference between case and control pools, delta p-hat, is calculated u...
PUM
| Property | Measurement | Unit |
|---|---|---|
| disorder | aaaaa | aaaaa |
| cell composition | aaaaa | aaaaa |
| frequency | aaaaa | aaaaa |
Abstract
Description
Claims
Application Information
 - R&D
- Intellectual Property
- Life Sciences
- Materials
- Tech Scout
- Unparalleled Data Quality
- Higher Quality Content
- 60% Fewer Hallucinations
Browse by: Latest US Patents, China's latest patents, Technical Efficacy Thesaurus, Application Domain, Technology Topic, Popular Technical Reports.
© 2025 PatSnap. All rights reserved.Legal|Privacy policy|Modern Slavery Act Transparency Statement|Sitemap|About US| Contact US: help@patsnap.com


