Method for selecting statistically validated candidate genes
Active Publication Date: 2010-08-12
SYNGENTA PARTICIPATIONS AG
View PDF2 Cites 21 Cited by
Summary
Abstract
Description
Claims
Application Information
AI Technical Summary
This helps you quickly interpret patents by identifying the three key elements:
Problems solved by technology
Method used
Benefits of technology
Problems solved by technology
However, the regions identified using linkage analysis are still far too broad to identify candidate genes associated with the trait.
Even with the more narrowly defined linkage region, the number of genes to validate is still unreasonably large.
This approach is problematic because it is limited to what is currently known about genes.
Often, such knowledge is limited and subject to interpretation.
As a result, researchers are often led astray and do not identify the genes affecting the trait.
Method used
Image
Click on the blue label to locate the original text in one second.
Reading with bidirectional positioning of images and text.
[0127]NAM is performed using SMR and MMR in combination with the permutation method described below to determine the LOD threshold for NAM.
Single Marker Regression (SMR):
[0128]The linear model to describe the relationship between trait values and marker genotypes is:
yij=μ+xija+giui+eij (model 1)
where yij is the phenotypic value of the individual j in the subpopulation i; μ is the overall mean; a is the additive effect of QTL; gi is the indicator variable of the subpopulation i; ui is the effect of the subpopulation i; eij is the residual error; and, wherein xij is defined as 1 if the individual j carries the allele from the common parent and −1 if the individual j carries the allele from the other parent.
[0129]The definition is based on the fact of there are only two distinct alleles for each marker. To exploit the simplicity of regression, the genetic background effect ui is assumed to be a fixed effect. Its inclusion into the model i...
[0137]With the advent of 'omics, identifying key candidates among the thousands of genes in a genome that play a role in a phenotype or a complex biological process has paradoxically become one of the main hurdles. Indeed, contrary to some early concerns that a lack of sufficient global data would still be a limiting factor, it is precisely the opposite, a bounty of information that now poses a challenge to scientists. This has translated into a need for sophisticated tools to mine, integrate and prioritize massive amounts of information. The present invention will help prioritize the candidate leads identified by Genome wide association mapping (using, for example, sequences from Solexa technology) for further validation and implementation in marker assisted breeding.
[0140]Experimental Design and Preparation of Phenotypic and Genotypic Data
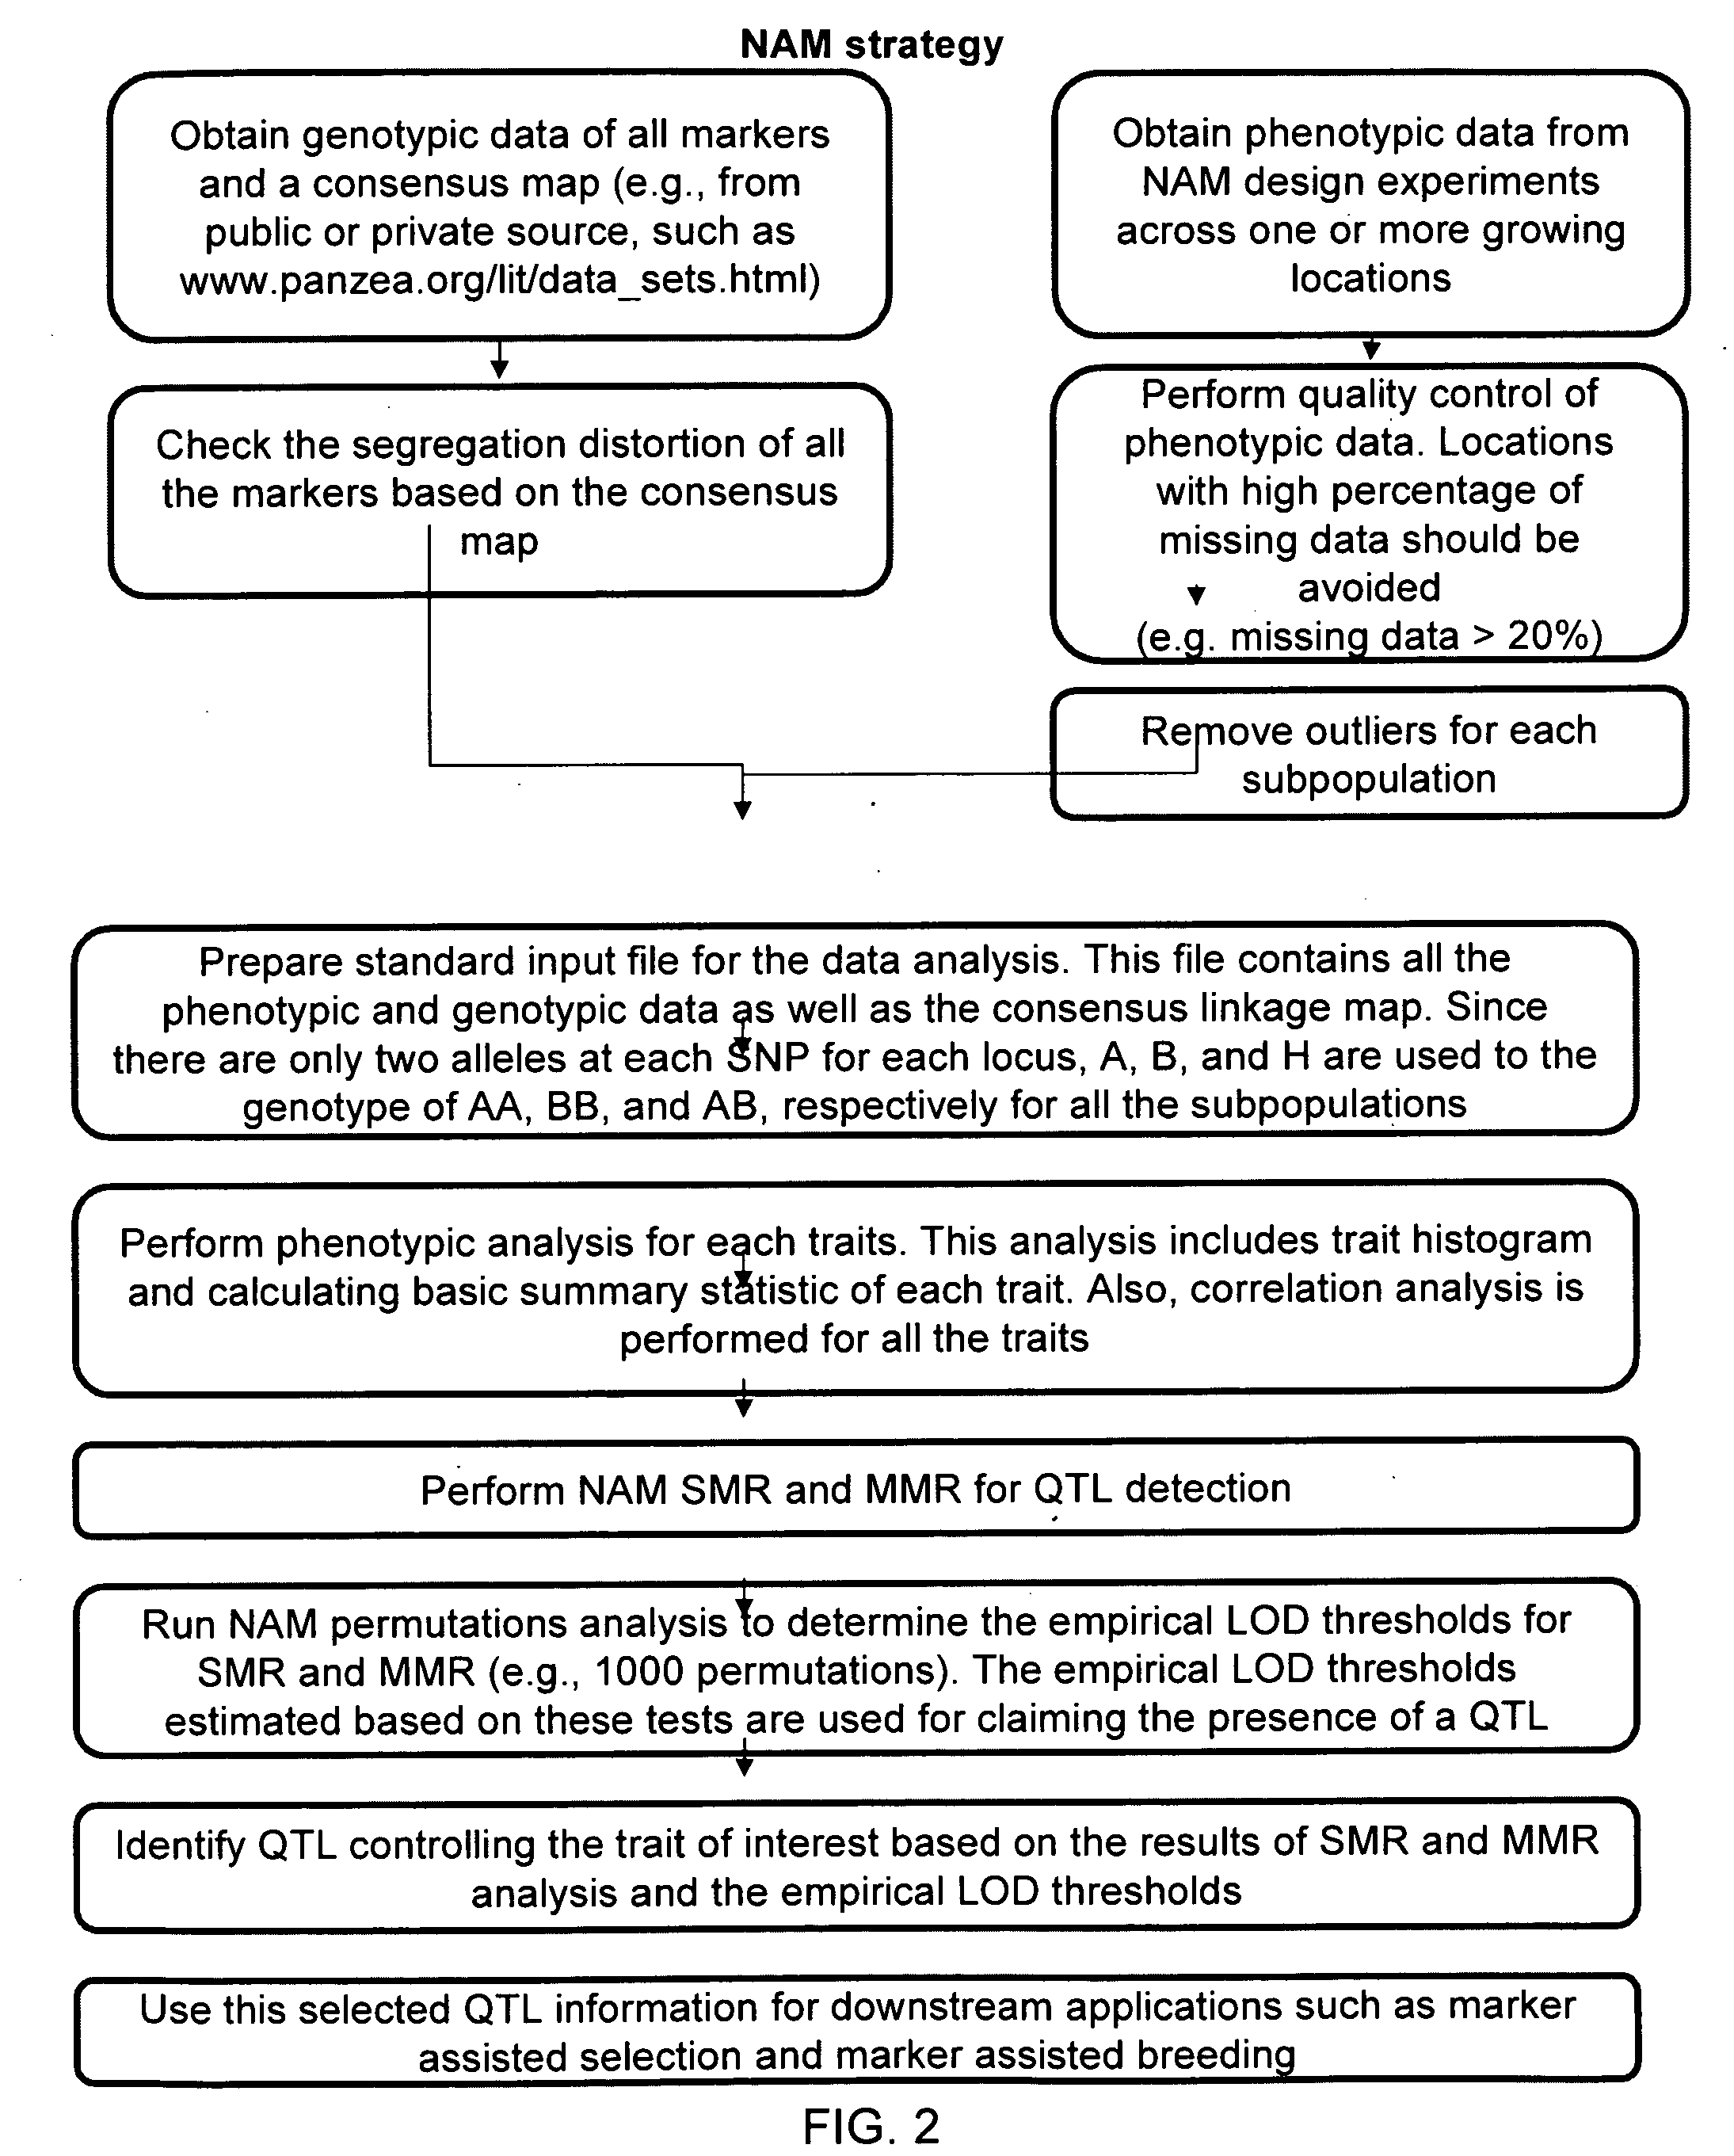
[0141]The NAM RIL lines were planted across five locations within two years. The traits of interest, mainly including starch and protein in corn ethanol project, were evaluated across the locations and years. The phenotypic data from each location is unbalanced. The unbalanced data structure indicates that it is necessary to obtain the corresponding genotypic data for those lines. To do so, the genotype data was downloaded for all the markers (www.panzea.org / lit / data sets.html) and the genotypic information was extracted for the NAM lines evaluated. Also, to perform SMR and MMR, a consensus linkage map was found from the same website and downloaded for the further use.
[0143]NAM SMR and MMR were used to detect the QTL responsible for starch and protein in corn. The details of these methods are described in Example 1. Both SMR and MMR are used for...
PUM
Abstract
Provided herein are methods for evaluating associations between candidate genes and a trait of interest in a population. The methods include a combination of genome-wide association analysis and one or more of nested association mapping (NAM), expression QTL analysis (eQTL), and allele epistastic analysis (AEA). Markers are selected or prioritized if they are shown to be positively-correlated with a trait of interest using GWA and a combination of one or both of NAM and eQTL. Also provided are models for evaluating the association between a candidate marker and a trait in a nested population of organisms. These methods include single marker regression and multiple marker regression models. Markers identified using the methods of the invention can be used in marker assisted breeding and selection, as genetic markers for constructing linkage maps, for gene discovery, for identifying genes contributing to a trait of interest, and for generating transgenic organisms having a desired trait.
Description
FIELD OF THE INVENTION[0001]This invention relates molecular genetics, particularly to methods for evaluating an association between a genetic marker and a phenotype in a population.BACKGROUND OF THE INVENTION[0002]Multiple experimental paradigms have been developed to identify and analyze quantitative trait loci (QTL) (see, e.g., Jansen (1996) Trends Plant Sci 1:89). A quantitative trait locus (QTL) is a region of the genome that codes for one or more proteins and that explains a significant proportion of the variability of a given phenotype that may be controlled by multiple genes. The majority of published reports on QTL mapping in crop species have been based on the use of the bi-parental cross. Typically, these paradigms involve crossing one or more parental pairs, which can be, for example, a single pair derived from two inbred strains, or multiple related or unrelated parents of different inbred strains or lines, each of which exhibits different characteristics relative to th...
Claims
Application Information
Patent Timeline
Application Date:The date an application was filed.
Publication Date:The date a patent or application was officially published.
First Publication Date:The earliest publication date of a patent with the same application number.
Issue Date:Publication date of the patent grant document.
PCT Entry Date:The Entry date of PCT National Phase.
Estimated Expiry Date:The statutory expiry date of a patent right according to the Patent Law, and it is the longest term of protection that the patent right can achieve without the termination of the patent right due to other reasons(Term extension factor has been taken into account ).
Invalid Date:Actual expiry date is based on effective date or publication date of legal transaction data of invalid patent.

