Mass Spectrometer

a mass spectrometer and mass spectrometer technology, applied in the field of mass spectrometers, can solve the problems of inefficiency and time consumption, inability to specifically discern, and troublesome and complex procedures for operators, and achieve the effects of reducing the time required for the process, improving work efficiency, and high intensities

Inactive Publication Date: 2011-06-02
SHIMADZU CORP
View PDF7 Cites 23 Cited by
  • Summary
  • Abstract
  • Description
  • Claims
  • Application Information

AI Technical Summary

Benefits of technology

[0037]In one mode of the mass spectrometers according to the first and second aspects of the present invention, a distribution image drawing means for drawing an m / z distribution image showing the spatial distribution of a given m / z value or m / z range based on the MS spectrum data is provided so that the operator can use the m / z distribution image when selecting one or more substances of interest or m / z value thereof by means of the substance-of-interest selection means. In this case, while visually checking the m / z distribution image, the operator (user) can select a substance of interest having a unique spatial distribution on the sample or m / z value thereof. Then, based on the previously collected NS spectrum data, the area extraction means one or more micro areas in which the substance of interest is present.
[0038]In a preferable configuration of the present invention, the area extraction means determines that the substance of interest is present in a given micro area when the spectrum intensity at the m / z value of the substance of interest in the MS spectrum of the given micro area is equal to or higher than a predetermined threshold level. By this configuration, one or more micro areas where an amount of the substance of interest equal to or greater than a certain quantity is likely to exist can be extracted. Although the aforementioned threshold being used as the criteria for the spectrum intensity may be uniquely determined, it is more preferable to provide a means for allowing a user to appropriately set the threshold. This is because the number of micro areas to be extracted by the area extraction means changes depending on the threshold level; this number affects the SIN ratio of the average MS / MS spectrum to be obtained and hence the identification accuracy of the substance of interest.
[0039]In the mass spectrometer according to the first aspect of the present invention, the average spectrum calculation means calculates an average MS / MS spectrum using MS / MS spectrum data previously collected for each of the micro areas extracted in the previously described manner. On the other hand, in the mass spectrometer according to the first aspect of the present invention, the MS / MS analysis conducting means performs an MS / MS analysis for each of the micro areas extracted in the previously described manner, after which the average spectrum calculation means calculates an average MS / MS spectrum using all the MS / MS spectrum data obtained by the MS / MS analysis. Accordingly, the mass spectrometer according to the first aspect of the present invention performs MS / MS analysis on the micro areas that will not be reflected in the average MS / MS spectrum, whereas the mass spectrometer according to the second aspect of the present invention performs MS / MS analysis only on the micro areas that will be reflected in the average MS / MS spectrum.
[0040]In any of the mass spectrometers according to the first and second aspects of the present invention, a plurality of micro areas for calculating an average MS / MS spectrum can be set automatically or only by simple operations; the operator only needs to do extremely simple tasks to identify the substance of interest. Thus, the work efficiency is improved and the time required for the process is shortened. Since the average MS / MS spectrum is calculated using only the MS / MS spectrum data of the micro areas in which the substance of interest is present, the ions originating from the substance of interest appears with high intensities on the average MS / MS is increased, while the intensities of unwanted noised are lowered. Thus, the SIN ratio of the average MS / MS spectrum is improved, so that the substance of interest can be identified with higher levels of accuracy and reliability.
[0041]Furthermore, in the mass spectrometer according to the second aspect of the present invention, the number of MS / MS analyses to be performed is directly reduced since no MS / MS analysis is performed for the micro areas that will not be reflected in the average MS / MS spectrum of the substance of interest. This is advantageous for shortening the time from the initiation of the analysis to the completion of identification.

Problems solved by technology

Therefore, although an operator can recognize a certain substance as the substance to be observed (which is hereinafter called the substance of interest) but cannot specifically discern the kind of the substance of interest.
The previously described procedure is troublesome and complex for an operator, and hence inefficient and time consuming.
Furthermore, since the range specified by the ROI frame on the optical image or mapping image cannot be reduced to an adequately small size, the MS / MS spectrums used for the calculation of the average MS / MS spectrum inevitably include many peaks originating from unwanted substances other than the substance of interest.
These noises deteriorate the S / N ratio of the MS / MS spectrums, making it difficult to improve the identification accuracy.

Method used


Image

  • Mass Spectrometer
  • Mass Spectrometer
  • Mass Spectrometer

Examples


Embodiment Construction

[0078]The configuration and operation of an imaging mass spectrometer as one embodiment of the mass spectrometer according to the present invention is hereinafter described with reference to the attached drawings.

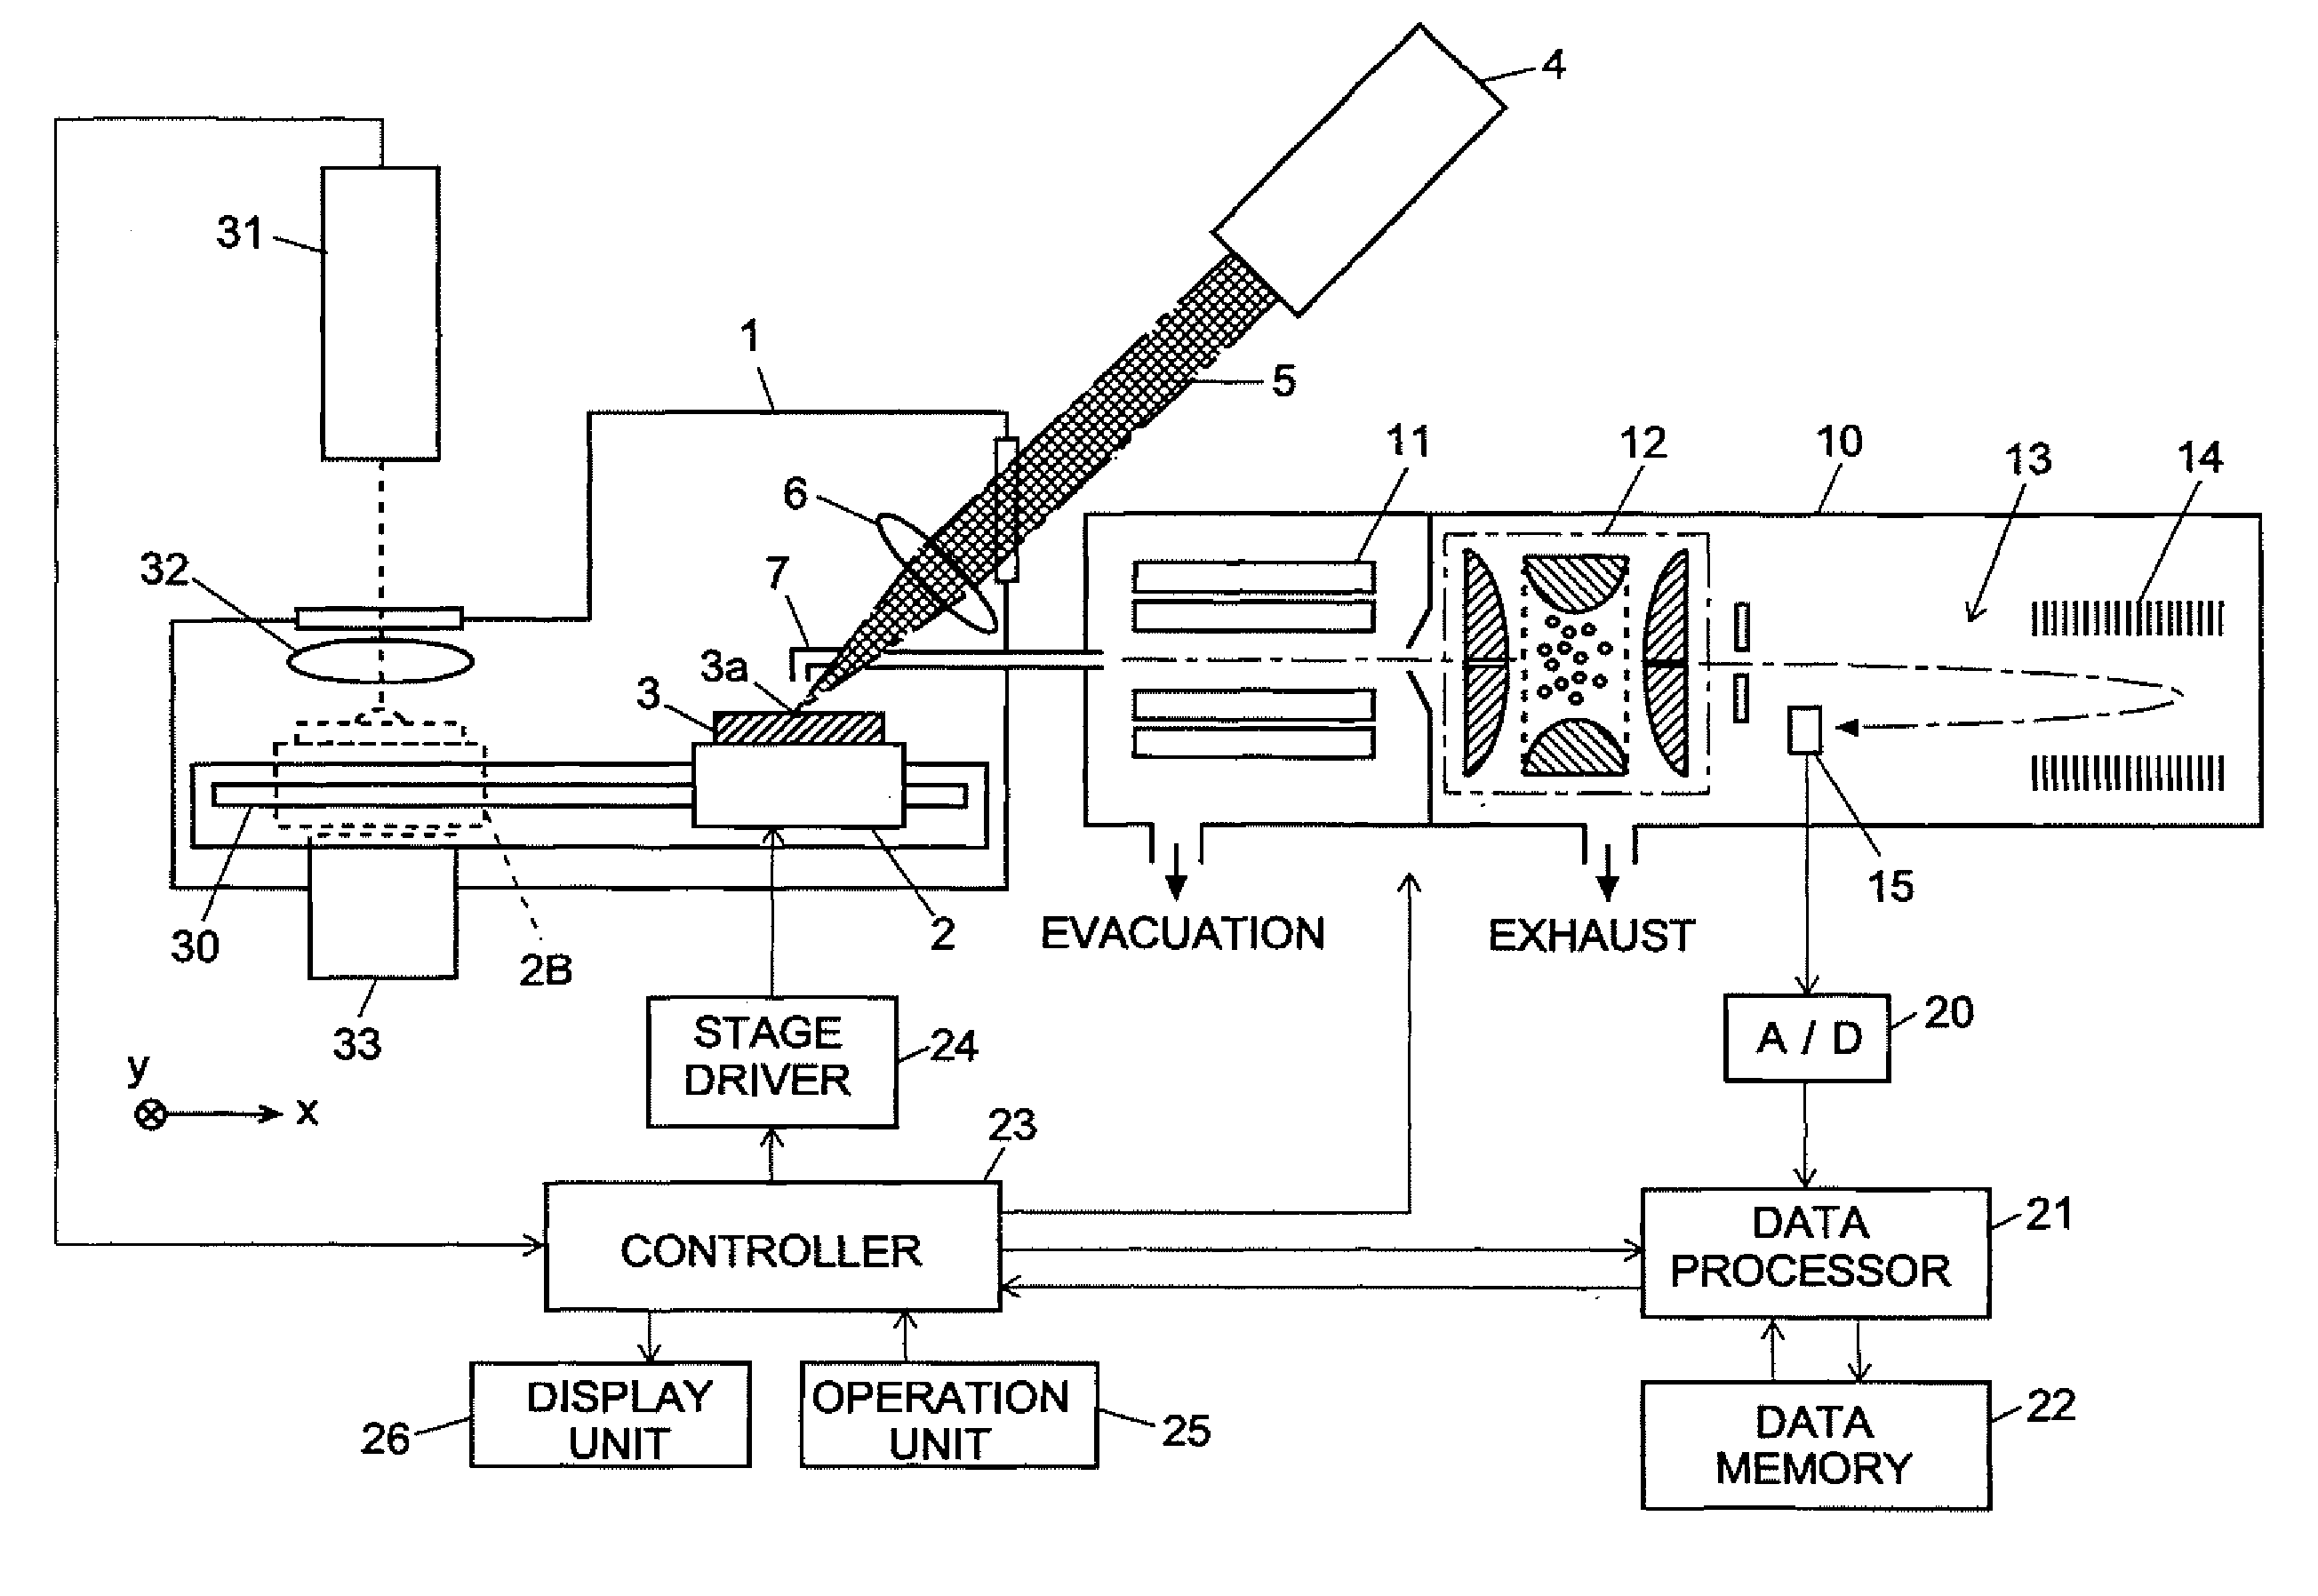
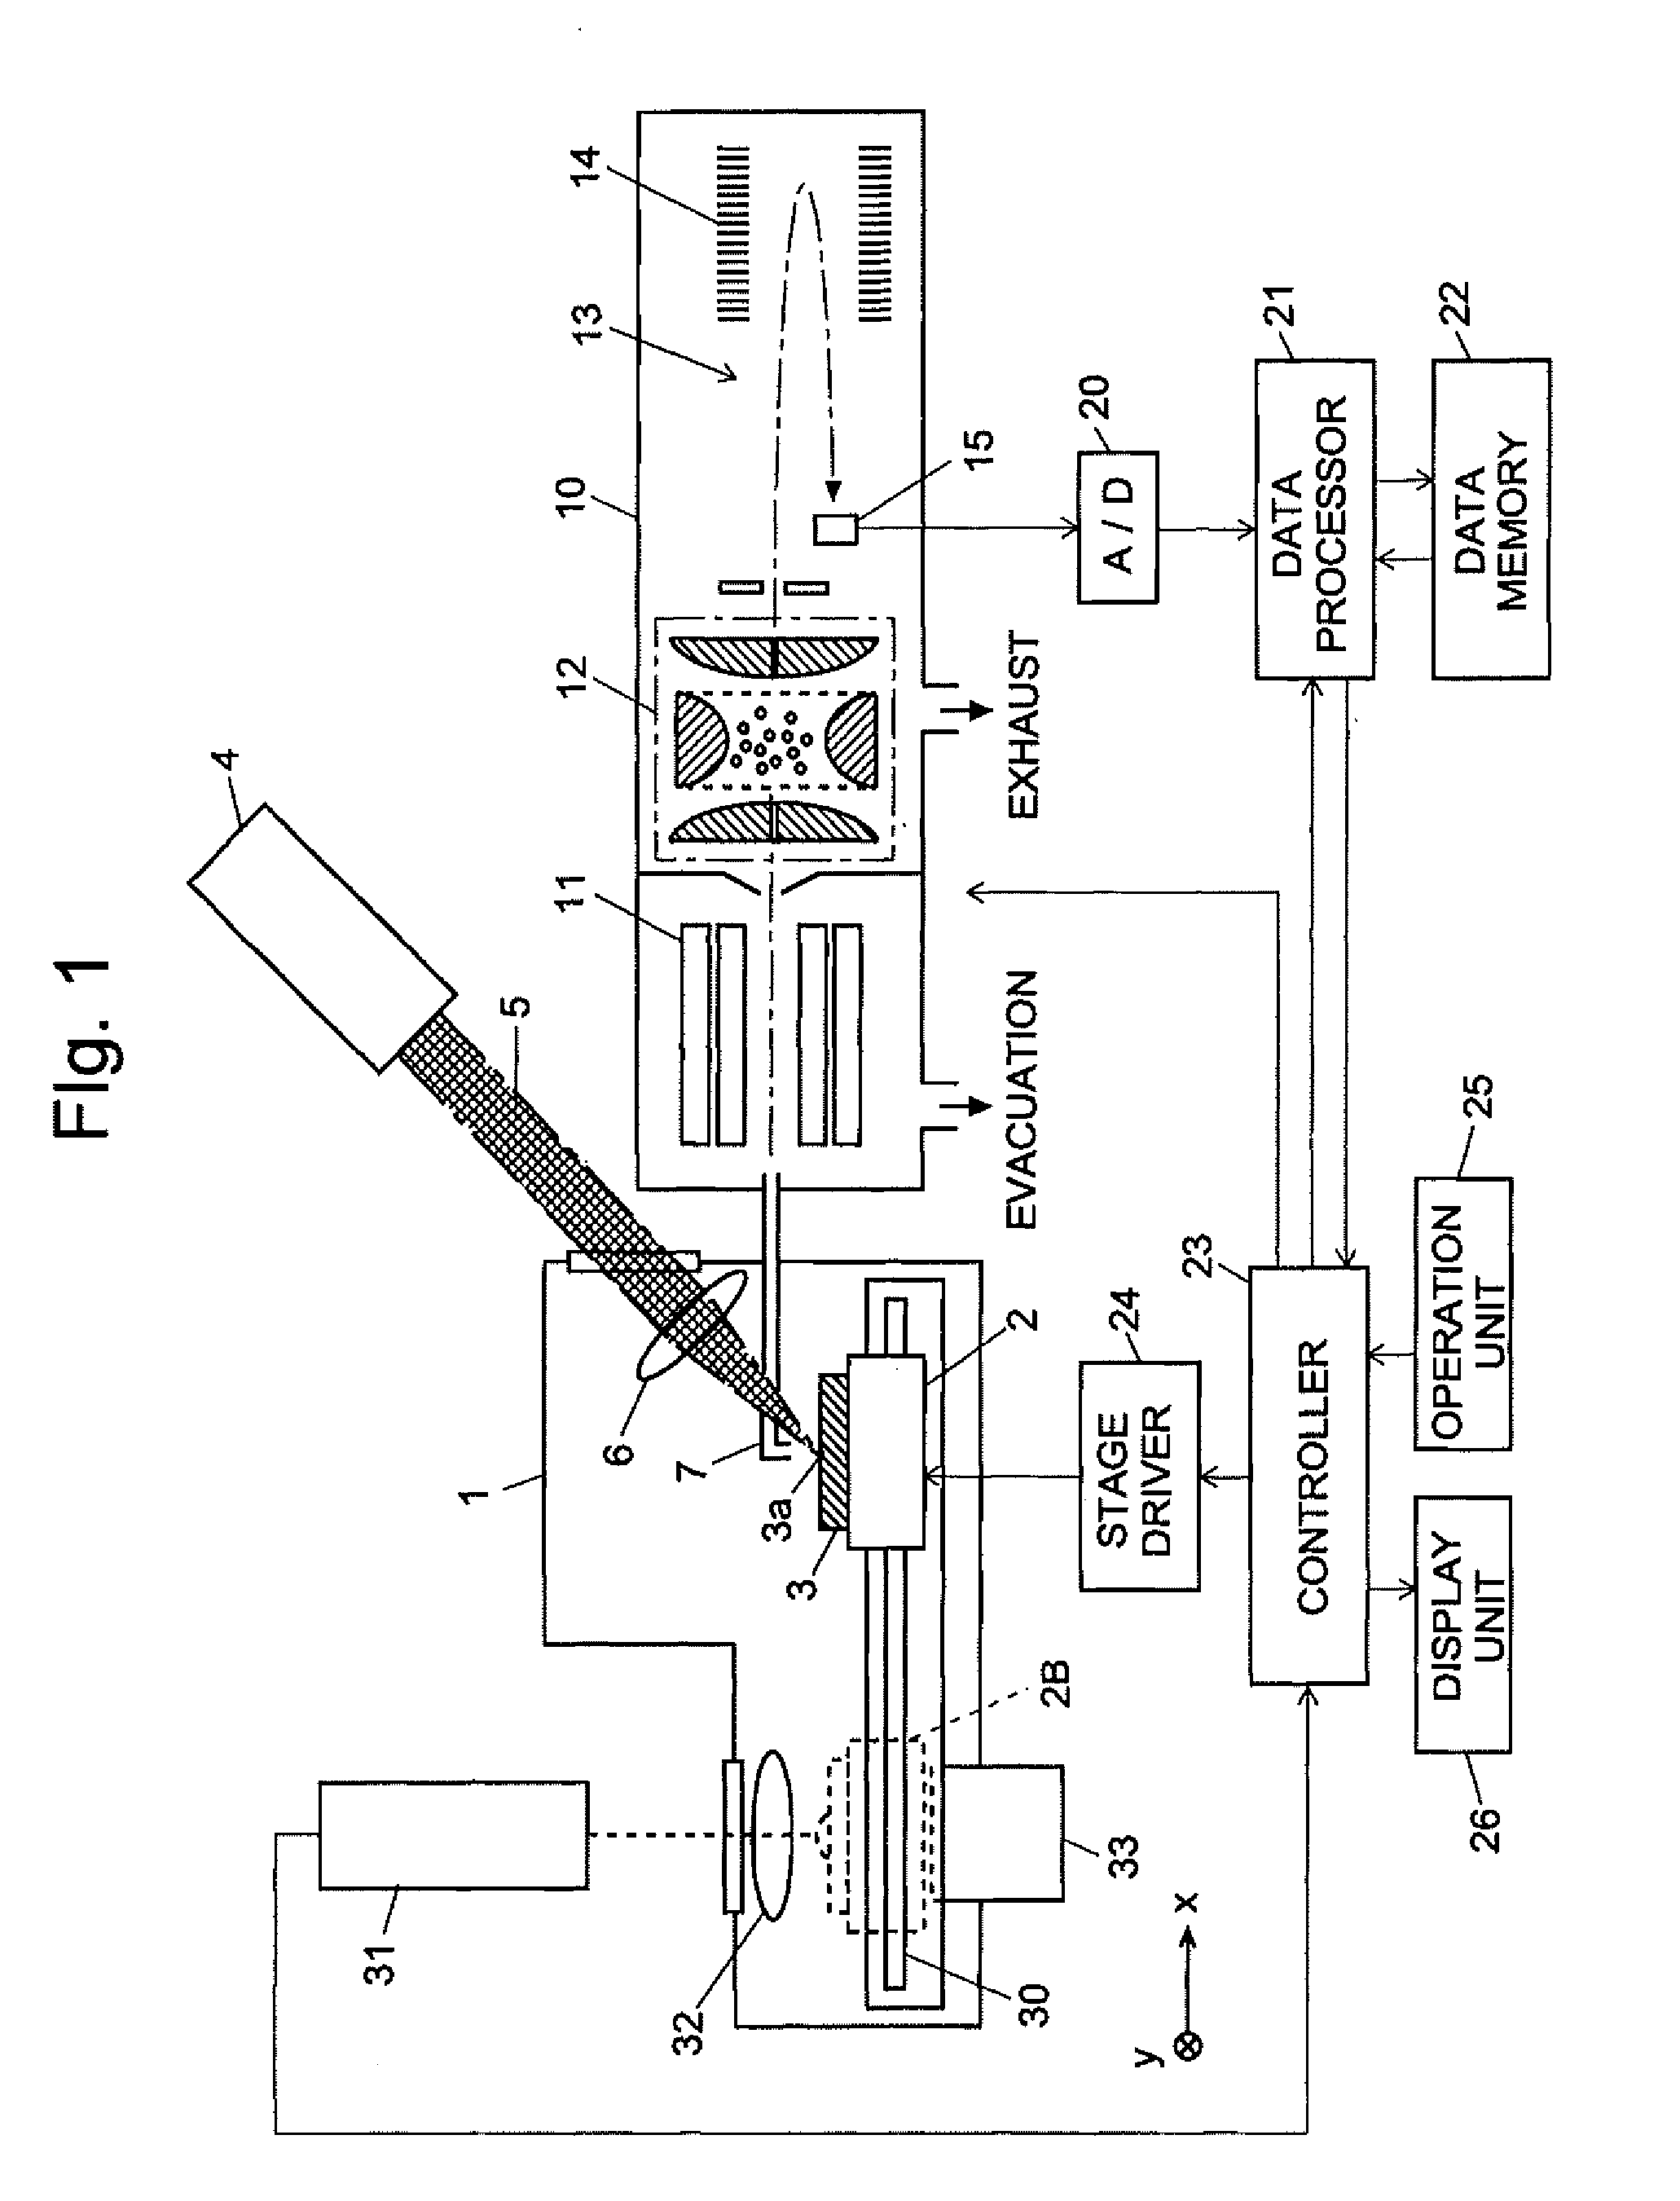
[0079]FIG. 1 is a configuration diagram of the main components of the imaging mass spectrometer according to the present embodiment. This imaging mass spectrometer includes an air-tight chamber 1 maintained at approximately atmospheric pressure, in which an ionization unit for ionizing a sample by an atmospheric pressure MALDI (AP-MALDI) method and a microscopic observation unit for microscopically observing a sample are provided. A sample 3 is placed on a sample stage 2, which can be moved at least in two directions, i.e. the x-axis and y-axis directions, by a stage driver 24. When the sample stage 2 is at a position indicated by the solid line in FIG. 1, a laser beam 5, which is emitted from a laser irradiation unit 4 and focused by a lens 6, hits the upper surface of the...


PUM


Abstract

An MS analysis is performed for each micro area within a specified mass analysis area on a sample. Based on the data obtained by this analysis, a distribution image of a specified m / z ratio of m / z range is created and displayed on a display screen (S10-S14).When an operator selects a substance of interest on the displayed image and indicates its m / z (S15), one or more micro areas in which the MS spectrum intensity at the specified m / z is equal to or higher than a threshold are extracted, and an MS / MS analysis using the m / z of the substance of interest as the precursor is performed on the extracted micro areas (S26 and S27). An average MS / MS spectrum is calculated from the MS / MS spectrum data obtained for those micro areas (S28), and the substance of interest is identified based on the information relating to the peaks appearing on the average MS / MS spectrum (S19).

Description

TECHNICAL FIELD[0001]The present invention relates to a mass spectrometer for performing a mass analysis on each micro area included in a two-dimensional area on a sample and for analyzing and processing the obtained data More specifically, it relates to a mass spectrometer capable of an MS / MS analysis in which a specific ion is dissociated into one or more product ions and subjected to mass analysis.BACKGROUND ART[0002]In recent years, structural and functional analyses of proteins in living tissues have been rapidly promoted as post-genome research. As one method for such structural and functional analyses of proteins (proteome analysis), the methods that involve using a mass spectrometer for the expression analysis or primary structure analysis of a protein have been widely used in recent years. One of these commonly known methods uses a mass spectrometer capable of MSn analysis (n≧2) including the operations of selecting and dissociating a specific ion. According to this method,...

Claims


Application Information

Patent Timeline
Patent Type & Authority Applications(United States)
IPC IPC(8): H01J49/00
CPCH01J49/0004H01J49/004H01J49/0031
Inventor KAJIHARA, SHIGEKI
Owner SHIMADZU CORP
Why Eureka
Try Eureka