Markers associated with soybean rust resistance and methods of use therefor
a technology of soybean rust and markers, which is applied in the field of markers associated with soybean rust (sbr) resistance, can solve the problems of sbr having the potential to cause significant yield loss in the u.s., significant agricultural losses, and early leaf drop that inhibits pod s
- Summary
- Abstract
- Description
- Claims
- Application Information
AI Technical Summary
Benefits of technology
Problems solved by technology
Method used
Image
Examples
example 1
SNP Analysis
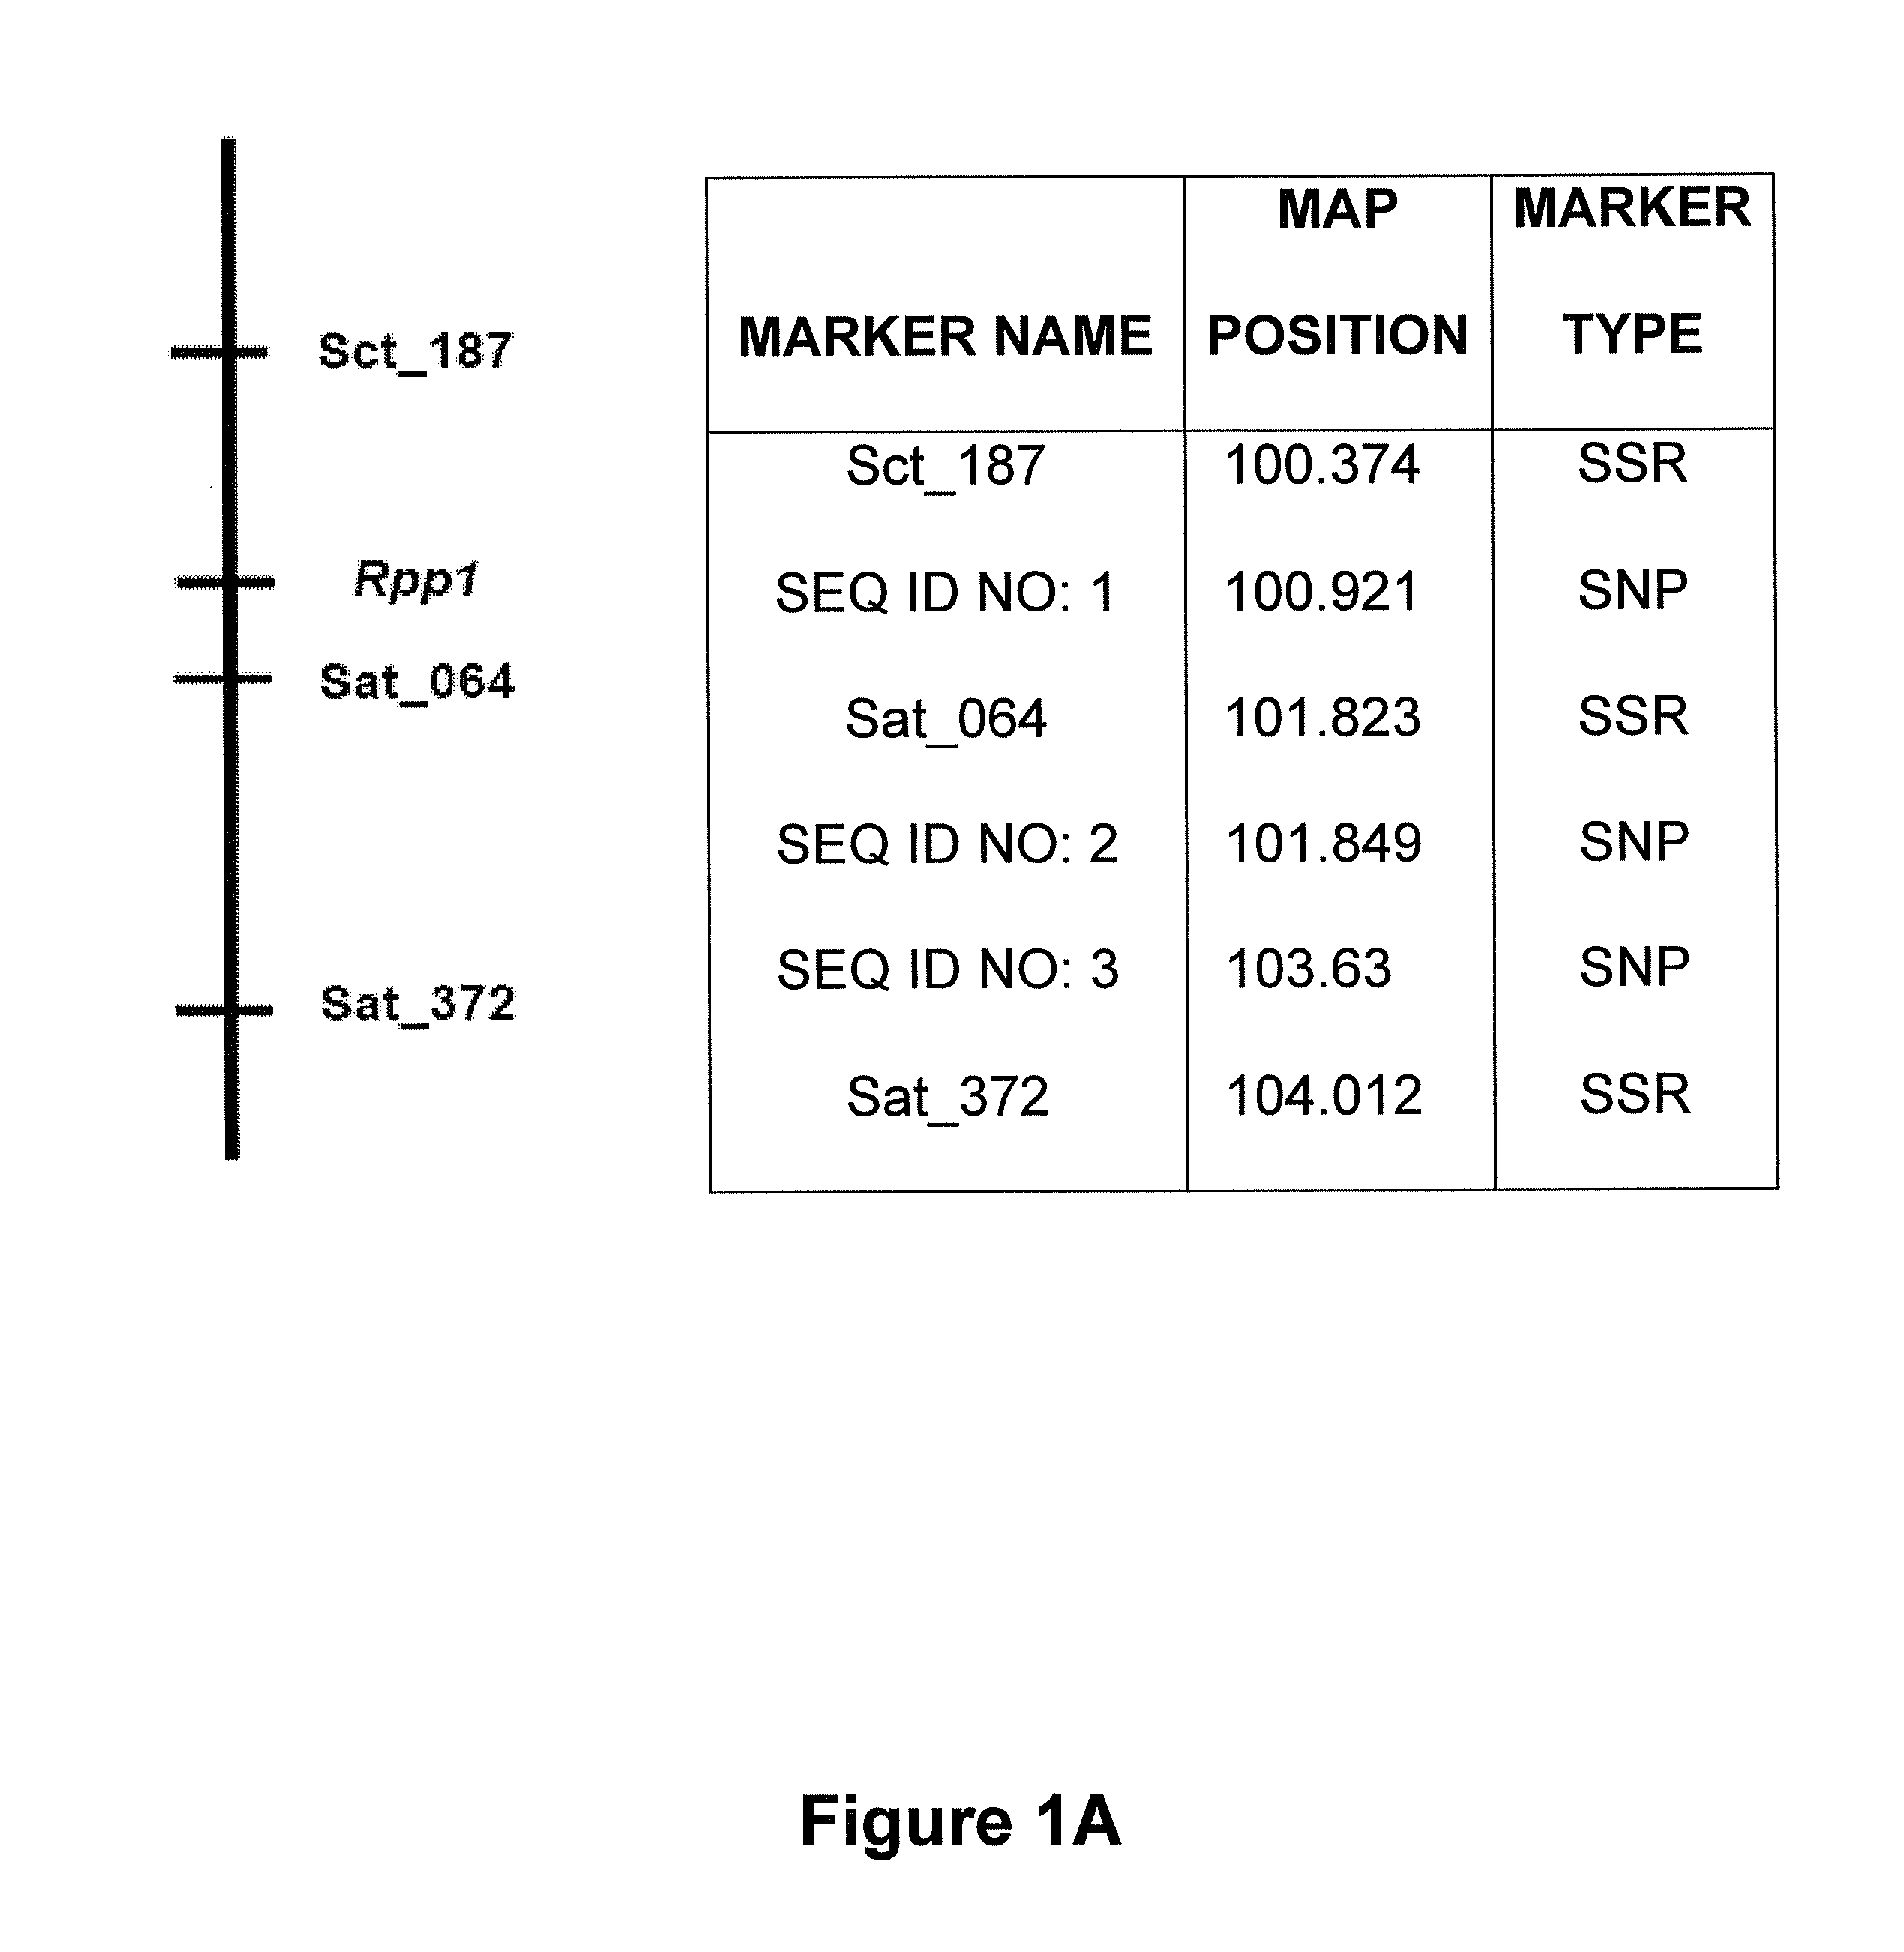
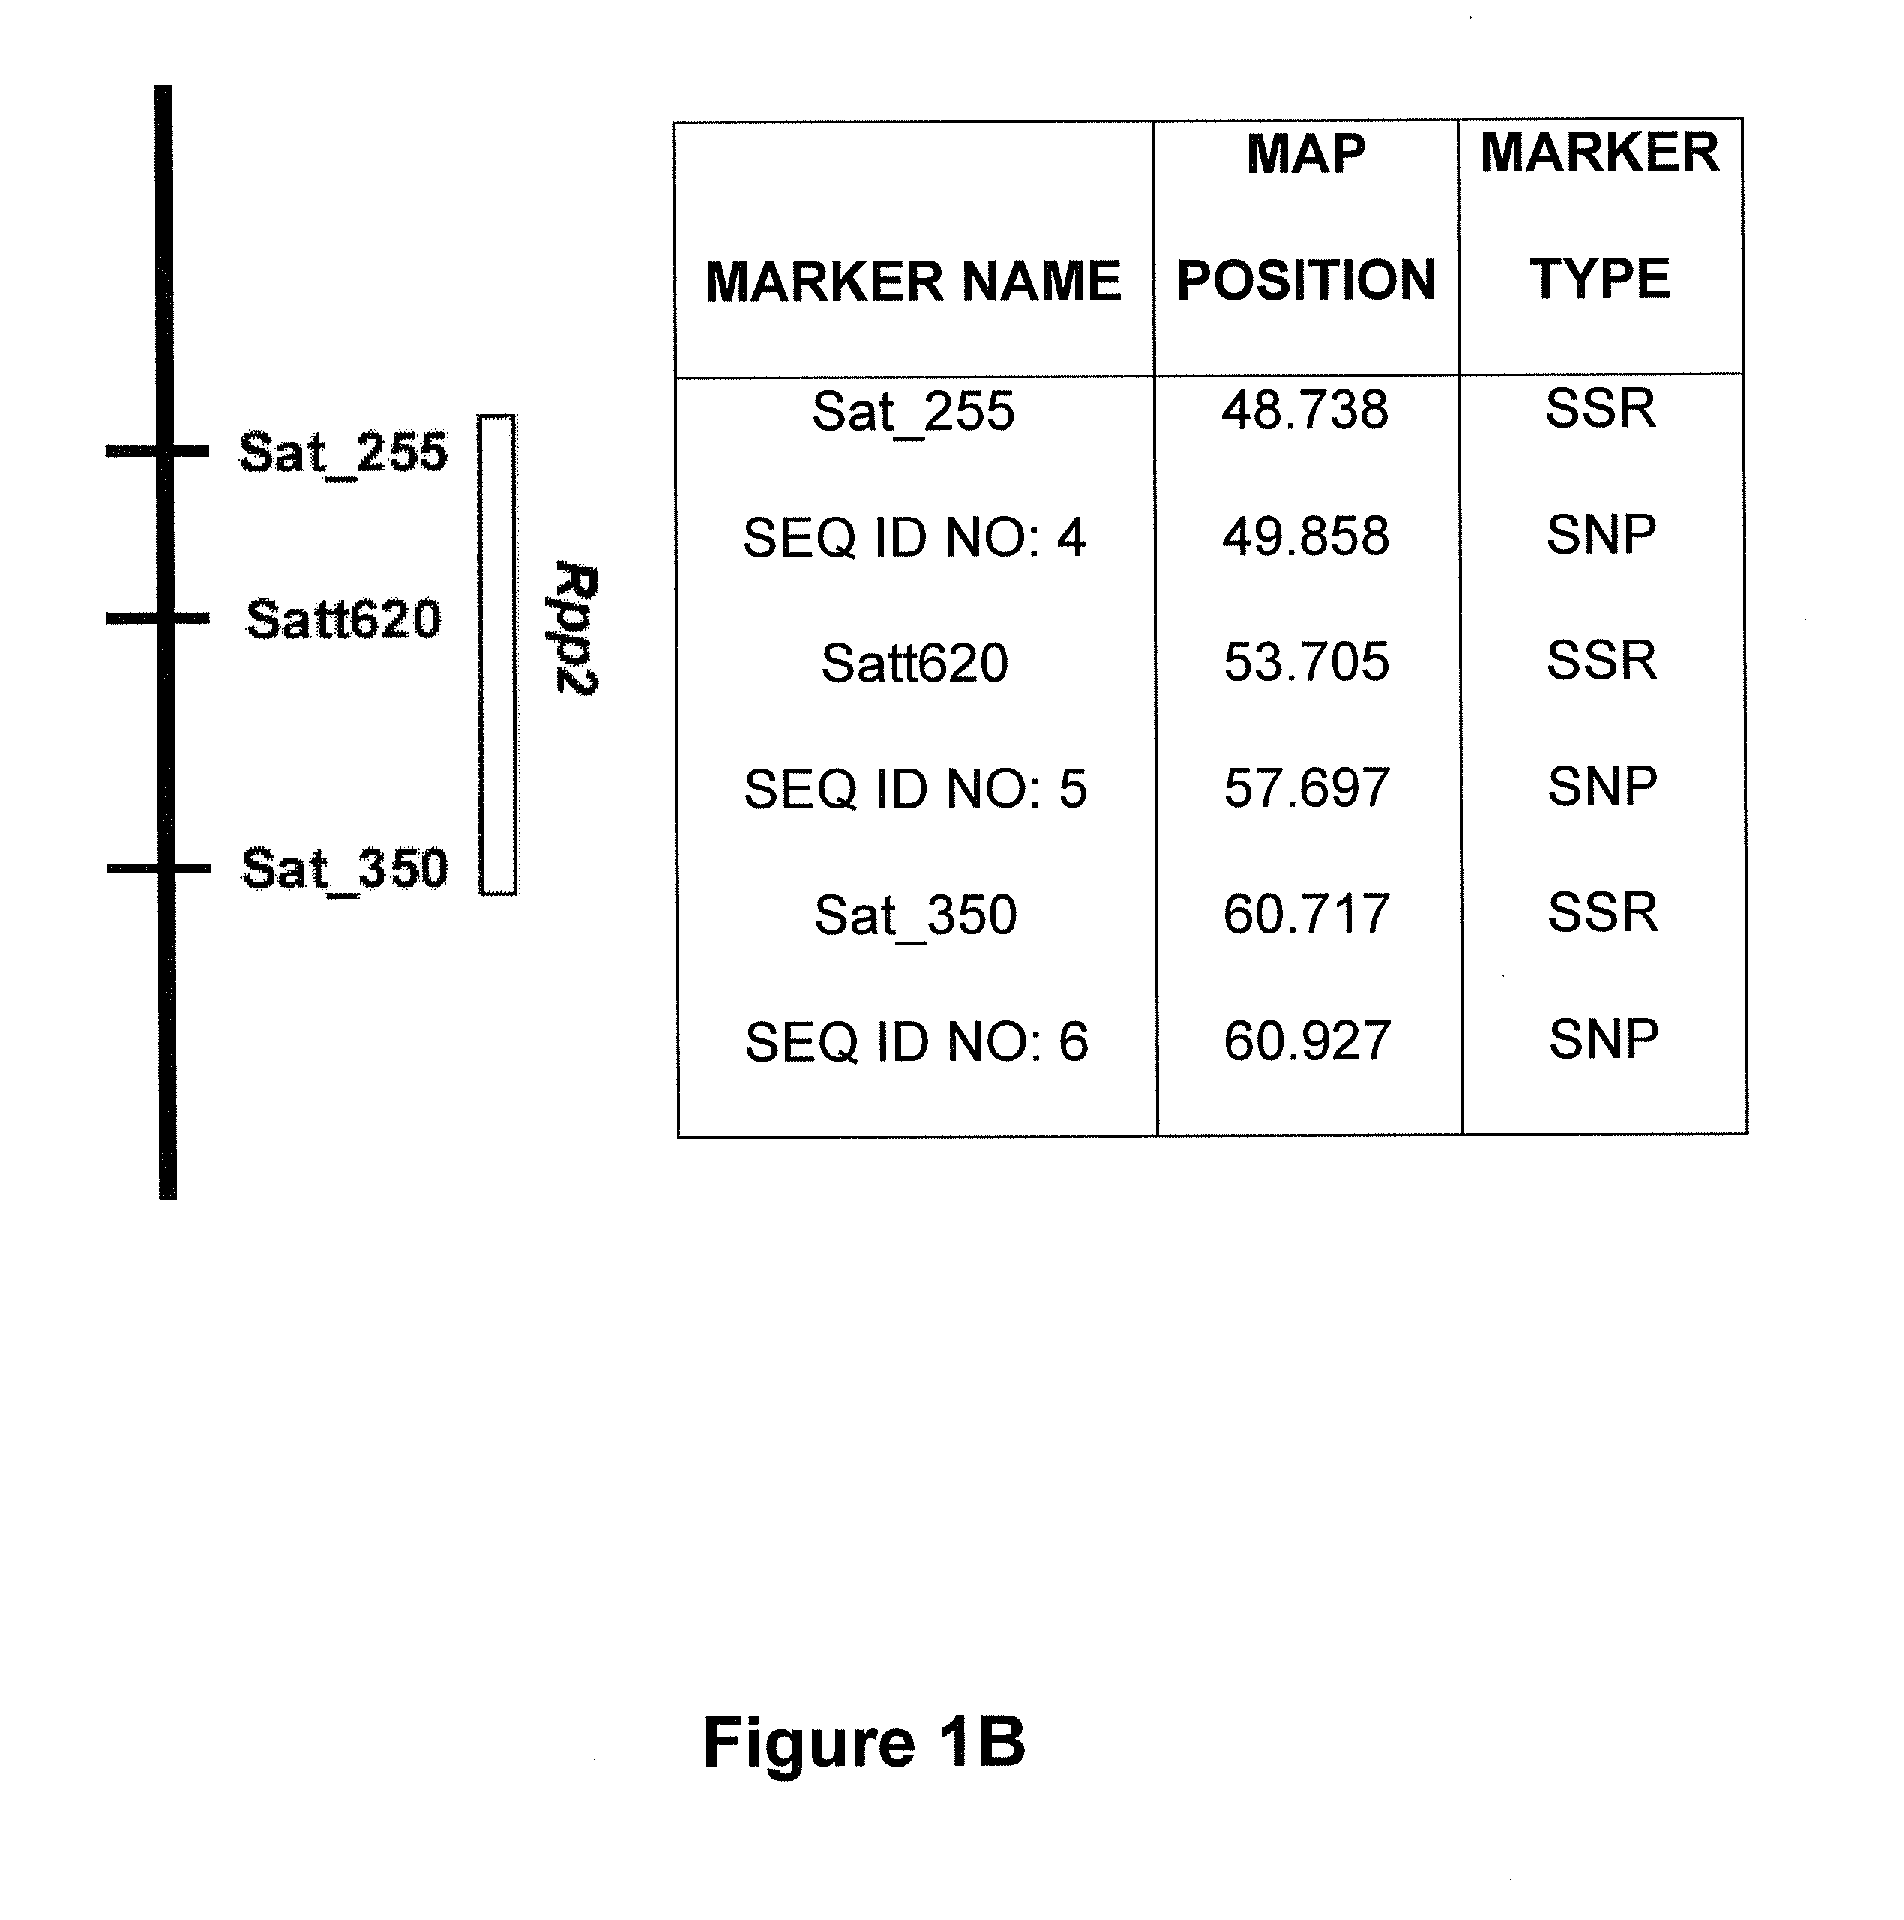
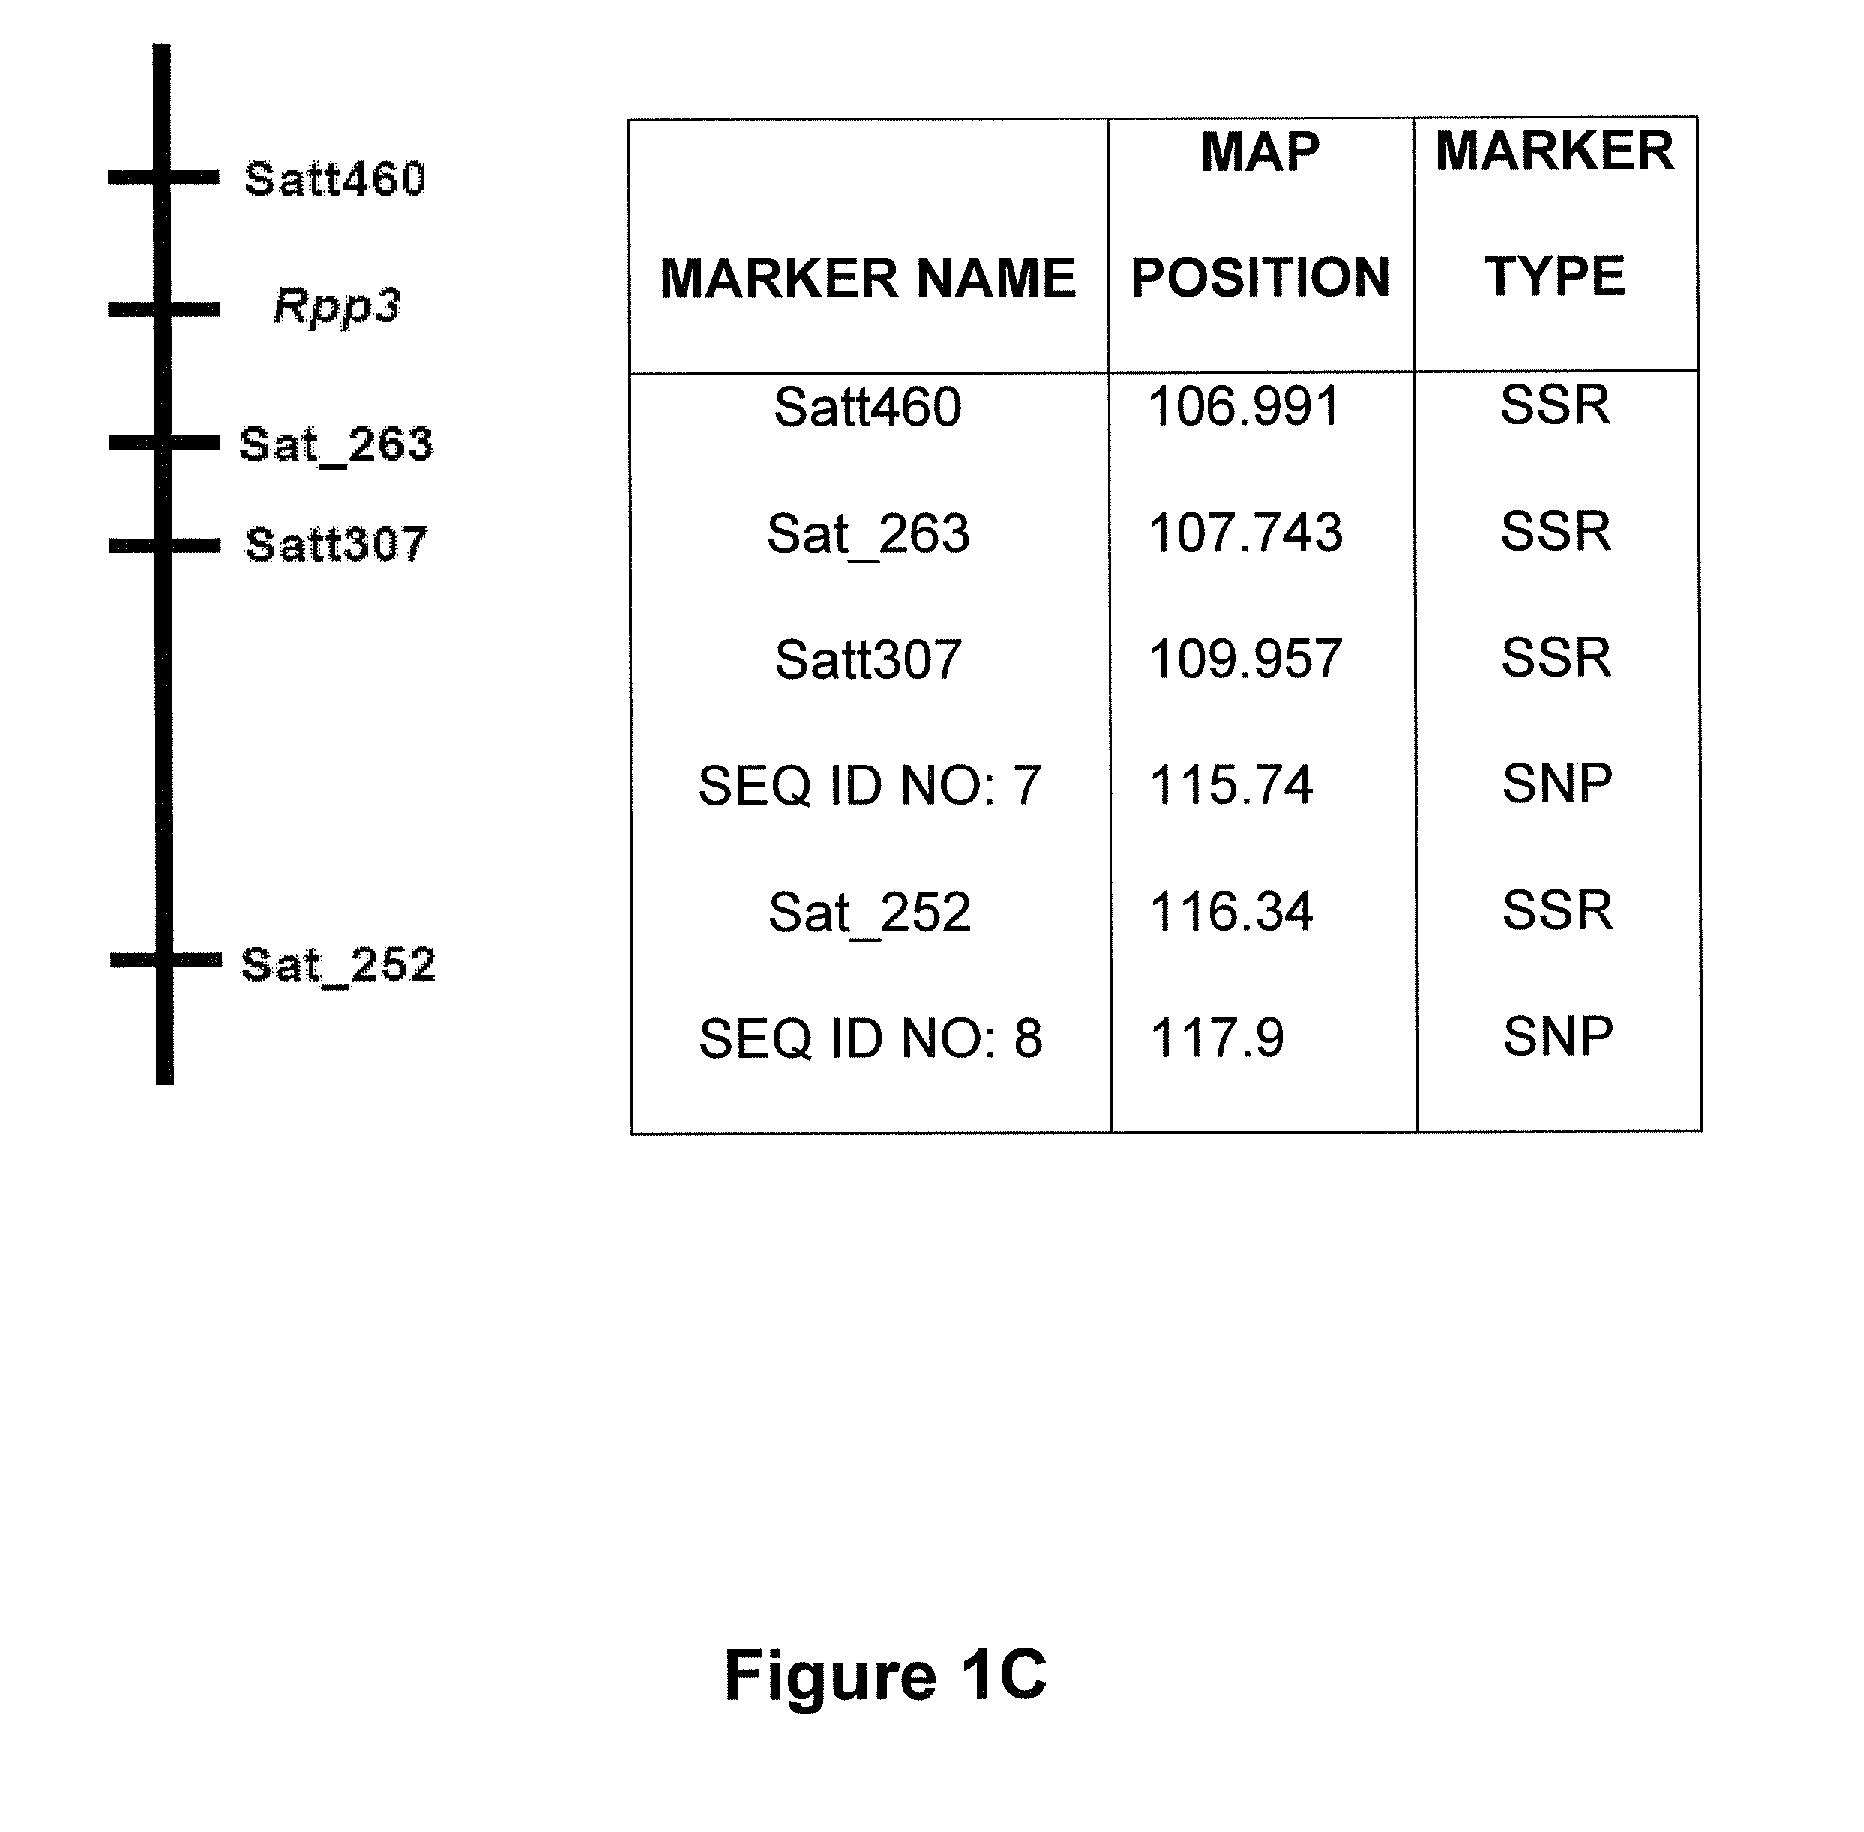
There are SSR markers which are associated with soybean rust resistant qualitative and quantitative genes Rpp1, Rpp2, Rpp3, Rpp4, and Rpp5. This SSR information was employed to identify SNP markers that map to the regions of qualitative genes and quantitative trait loci (QTL) regions defined for each of the Rpp1, Rpp2, Rpp3, Rpp4, and Rpp5 genes. The identified SNPs were validated on soybean rust resistant and susceptible lines. Analyses indicated that these SNPs mapped more closely and showed better associations to the Rpp gene than did the SSRs. The information of validated SNPs for soybean rust is new and is used for appropriate breeding programs.
example 2
SNP Genotyping Data
Molecular markers were identified for the Rpp1, Rpp2, Rpp3, Rpp4, and Rpp5 genes, and the resistance gene first identified in the Japanese cultivar, Hyuuga. Hyten et al., 2007 used PI200492 to map Rpp1 to linkage group (LG) G between the SSR markers Sct—187 and Sat—064. Rpp2 was mapped in PI230970 to the region on LG J between Sat—255 and Satt620. Rpp4 was mapped in PI459025 on LG G between SSR Satt288 and RFLP marker A885—1 (Silva et al. 2008, supra). The cultivar Hyuuga (PI506764) was once thought to contain Rpp3 (the resistance gene contained in PIs 462312 and 459025B), but it is now believed that there are 2 separate rust resistance genes located near each other on LG C2, flanked by SSRs Satt460 and Sat—263. Rpp5 was recently identified in several lines (PI200487, PI200526, PI471904, PI200456) by Garcia et al., 2008, and mapped to LG N in a region flanked by the SSRs Sat—275 and Sat—280. The approximate positions of these genes and various markers are depicted...
example 3
Allelic Discrimination Assays
In allelic discrimination assays, a PCR assay included a forward and reverse primer and a specific, fluorescent, dye-labeled probe for each of two alleles for a given SNP. The probes contained different fluorescent reporter dyes (VIC®; Applied Biosystems, Inc., Foster City, Calif., United States of America; and 6-carboxyfluorescein-aminohexyl amidite (FAM), or N-TET-6-Aminohexanol (TET) and FAM) to differentiate the amplification of each allele. A non-fluorescent quencher on each probe suppressed the fluorescence until amplification by PCR. During PCR, each probe annealed specifically to complementary sequences between the forward and reverse primer sites. Taq polymerase then cleaved the probes that were hybridized to each allele. Cleavage separated the reporter dye from the quencher, which resulted in increased fluorescence by the reporter dye.
Thus, the fluorescent signals generated by PCR amplification indicated that one or both alleles were present in...
PUM
| Property | Measurement | Unit |
|---|---|---|
| Tm | aaaaa | aaaaa |
| temperature | aaaaa | aaaaa |
| temperature | aaaaa | aaaaa |
Abstract
Description
Claims
Application Information
 - R&D
- Intellectual Property
- Life Sciences
- Materials
- Tech Scout
- Unparalleled Data Quality
- Higher Quality Content
- 60% Fewer Hallucinations
Browse by: Latest US Patents, China's latest patents, Technical Efficacy Thesaurus, Application Domain, Technology Topic, Popular Technical Reports.
© 2025 PatSnap. All rights reserved.Legal|Privacy policy|Modern Slavery Act Transparency Statement|Sitemap|About US| Contact US: help@patsnap.com


