Method for the mapping of the local at/gc ratio along DNA

a technology of at/gc ratio and mapping method, which is applied in the field of mapping method of local at/gc ratio along dna, can solve the problems of inability to use and limit the mapping method, and achieve the effects of low cost, simple method, and short preparation and measurement tim

Active Publication Date: 2011-08-18
TEGENFELDT JONAS +2
View PDF1 Cites 38 Cited by
  • Summary
  • Abstract
  • Description
  • Claims
  • Application Information

AI Technical Summary

Benefits of technology

[0006]The invention relates to a method wherein it for the first time is possible to obtain a pattern that corresponds to the map of the local AT / GC ratio along the DNA in a simple manner and with short preparation and measurement times. The resulting map of the local AT / GC ratio constitutes a “barcode” pattern along the DNA that can be used to identify patches of interest along genomic DNA and thereby identify structural variations such as deletions, translocations, insertions, inversions and copy number variations on a scale ranging from roughly 1 kbp and up, which is especially relevant in light of recent awareness of the significance of these types of variations. The method is thus limited to mapping and cannot be used to directly sequence the DNA by imaging one nucleotide at the time. The technique complements existing clinical techniques for DNA analysis (chromosomal analysis, FISH, micro arrays, sequencing) through its simplicity, low cost, high speed and lack of any necessary specific labels. The length scales that can be probed exceed what has been studied using existing melting mapping procedures and can apply to DNA molecules ranging at least from kbp to Mbp or even longer with dedicated channel designs and stretching schemes. In a first aspect the invention relates to a method for the mapping of the local AT / GC ratio along the DNA, providing DNA having a length of 1 kbp or more, staining said DNA with a fluorescent dye, denaturating said DNA and obtaining a pattern showing the distribution of the nucleotides.

Problems solved by technology

The method is thus limited to mapping and cannot be used to directly sequence the DNA by imaging one nucleotide at the time.

Method used


Image

  • Method for the mapping of the local at/gc ratio along DNA
  • Method for the mapping of the local at/gc ratio along DNA
  • Method for the mapping of the local at/gc ratio along DNA

Examples


example

Example 1

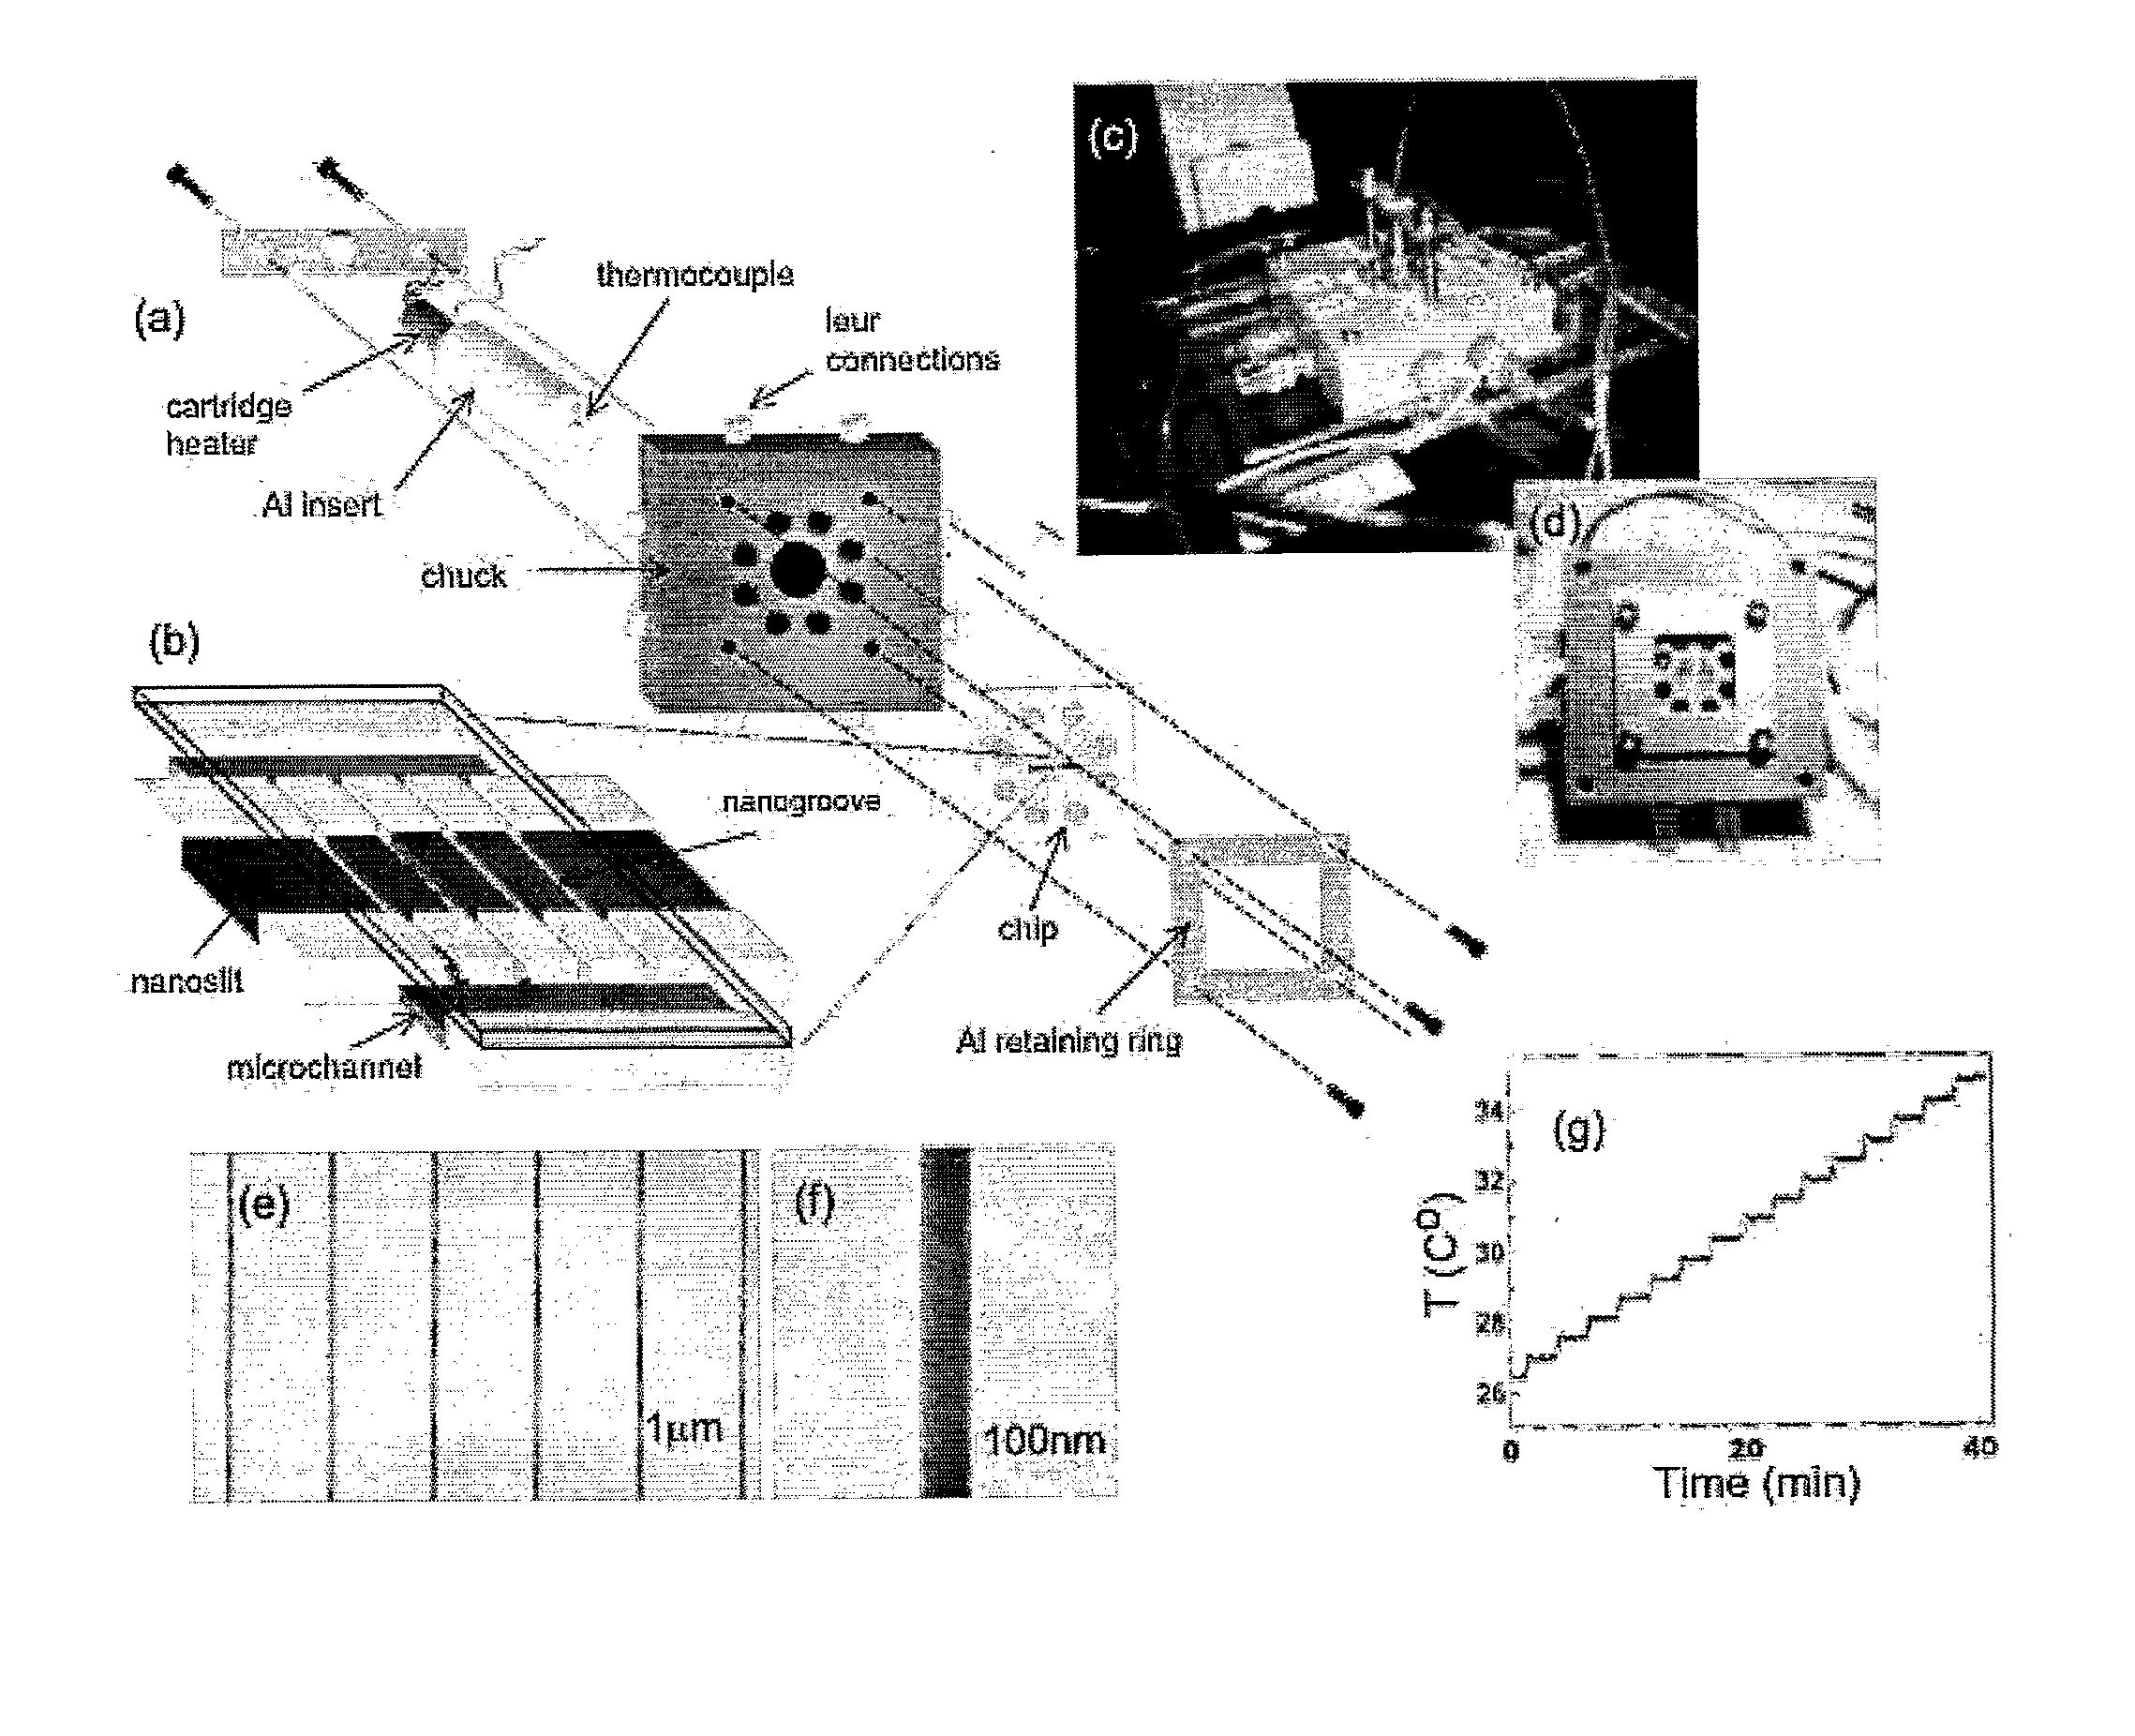
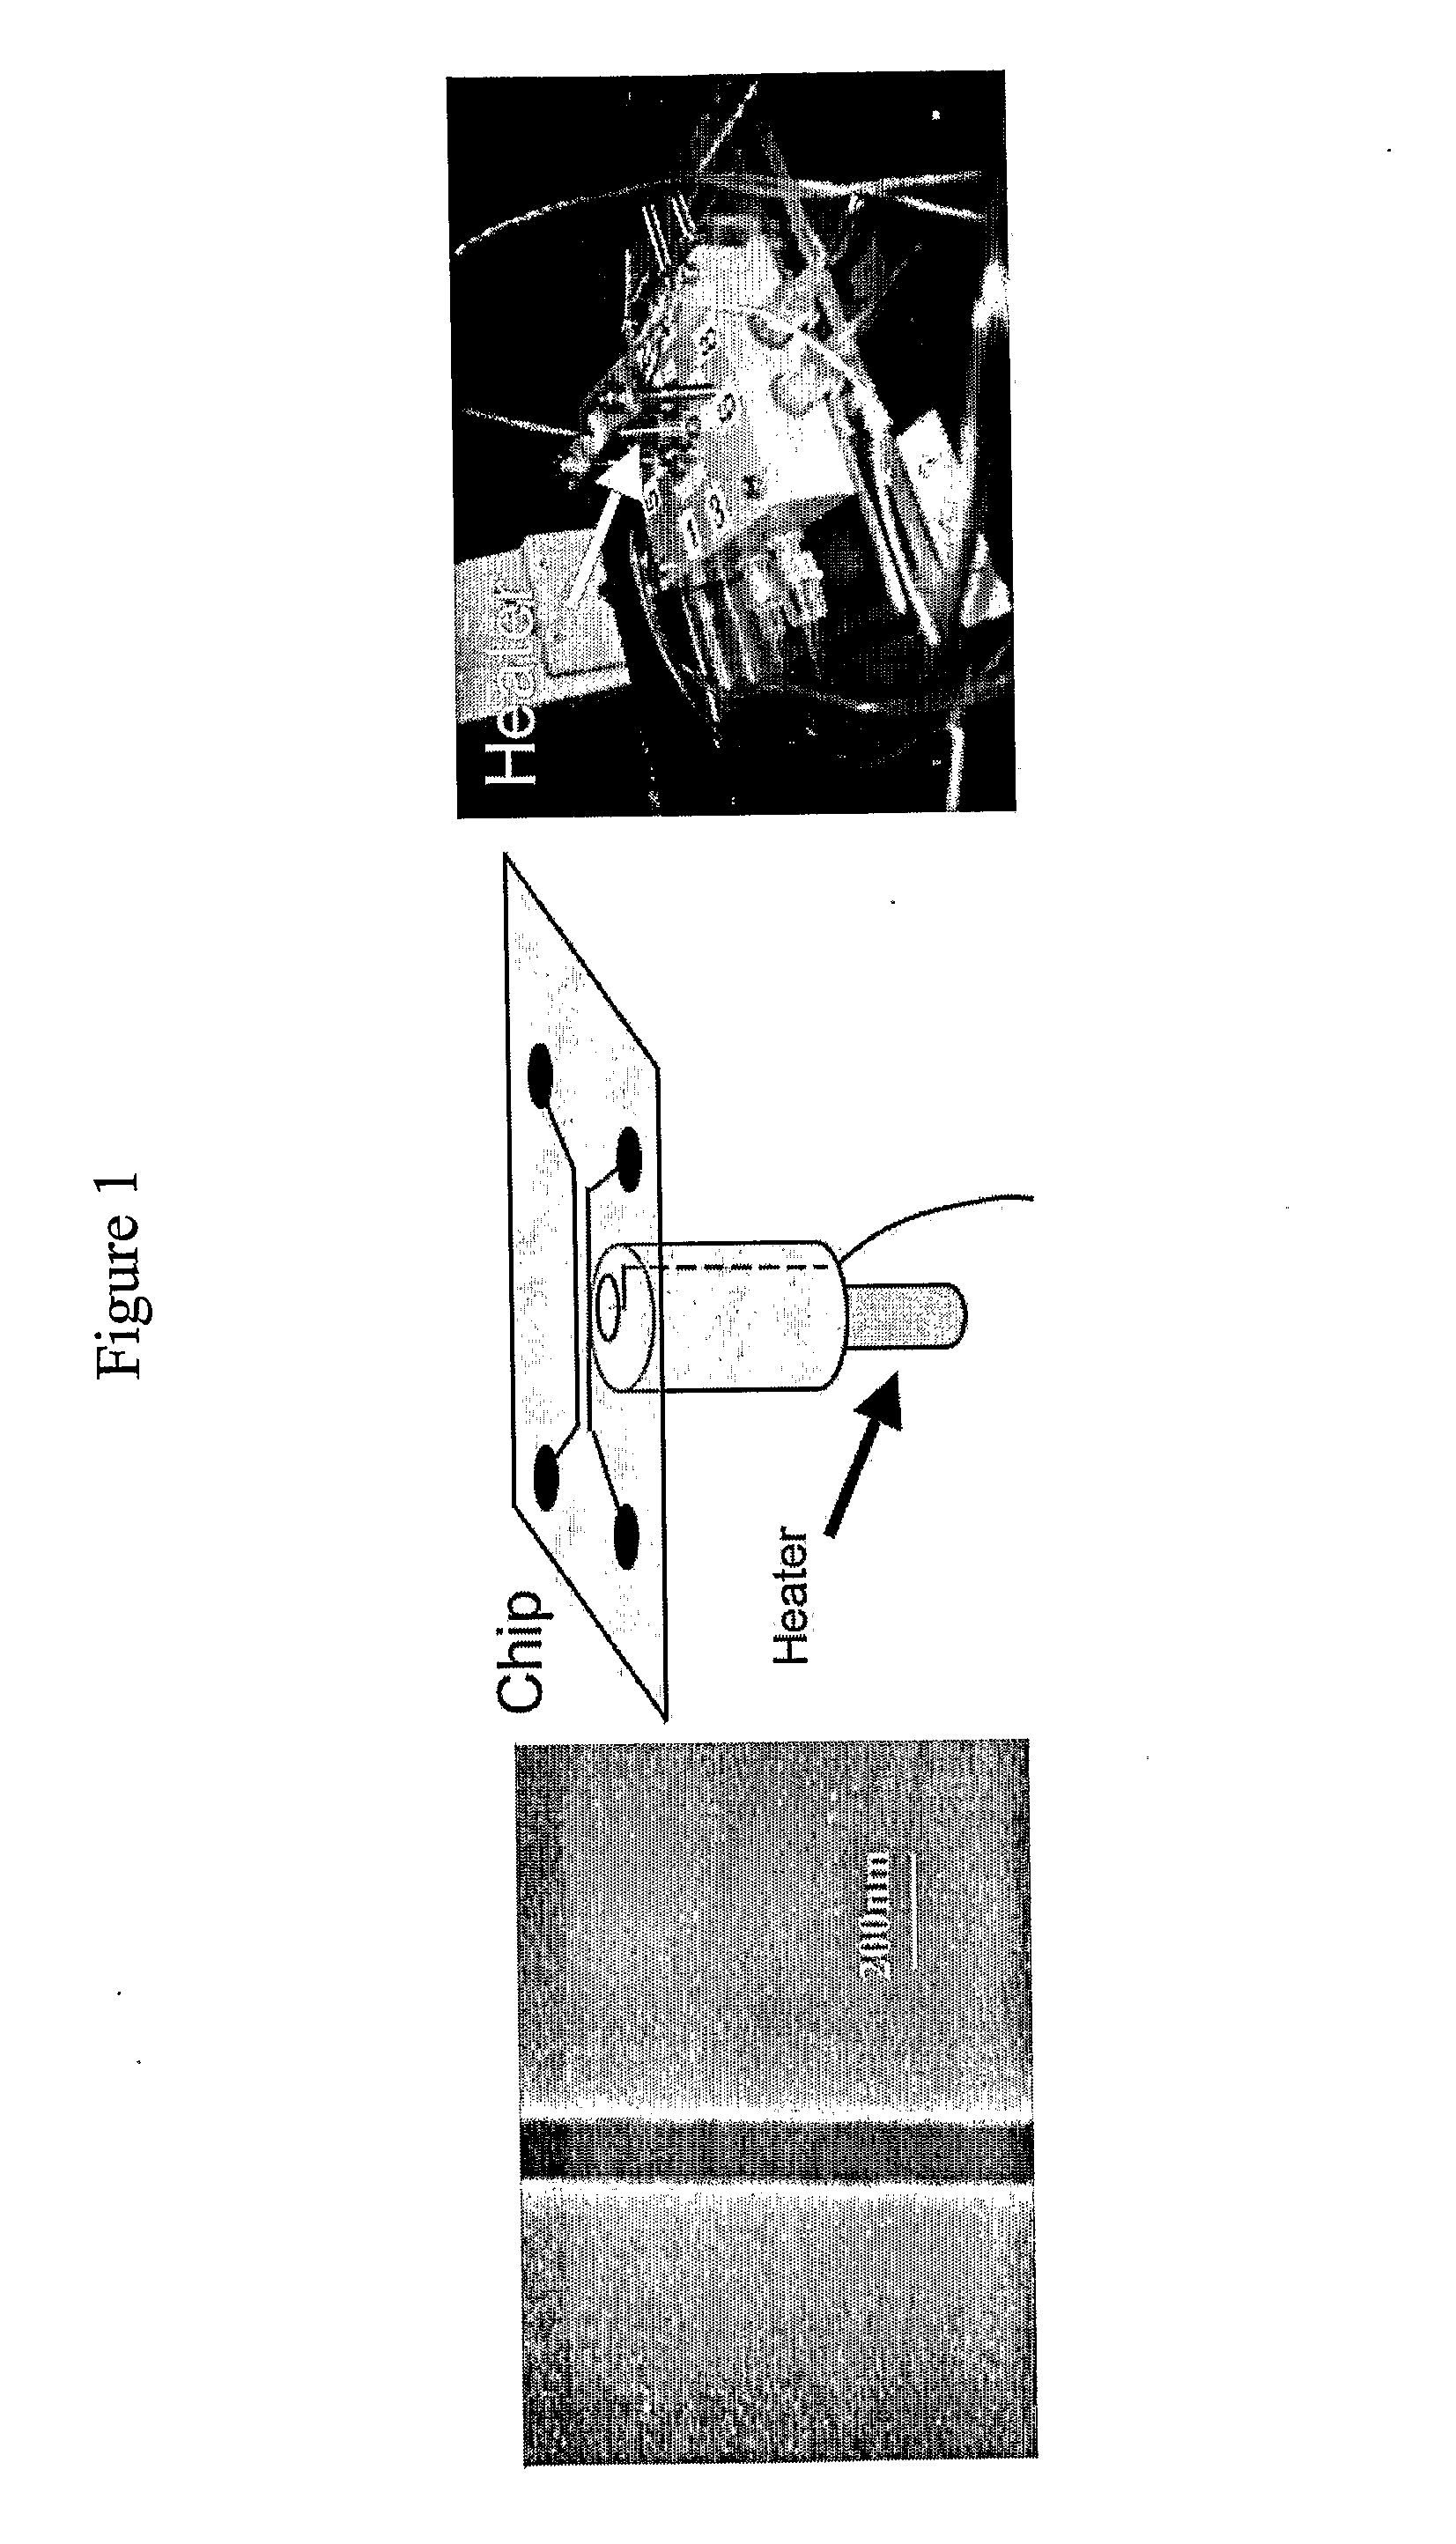
[0059]The device is made in fused silica using standard electron-beam lithography combined with UV-lithography and reactive ion etching. It is placed in a dedicated chuck for temperature control and mounted on an epifluorescence microscope (FIG. 1). Lambda-phage DNA is dyed with a conventional intercalating dye (YOYO-1 Invitrogen) and dissolved in a buffer with low ionic strength (0.05 TBE+10 mM NaCl) and 33% and 50% formamide respectively to decrease the melting temperature.

Results

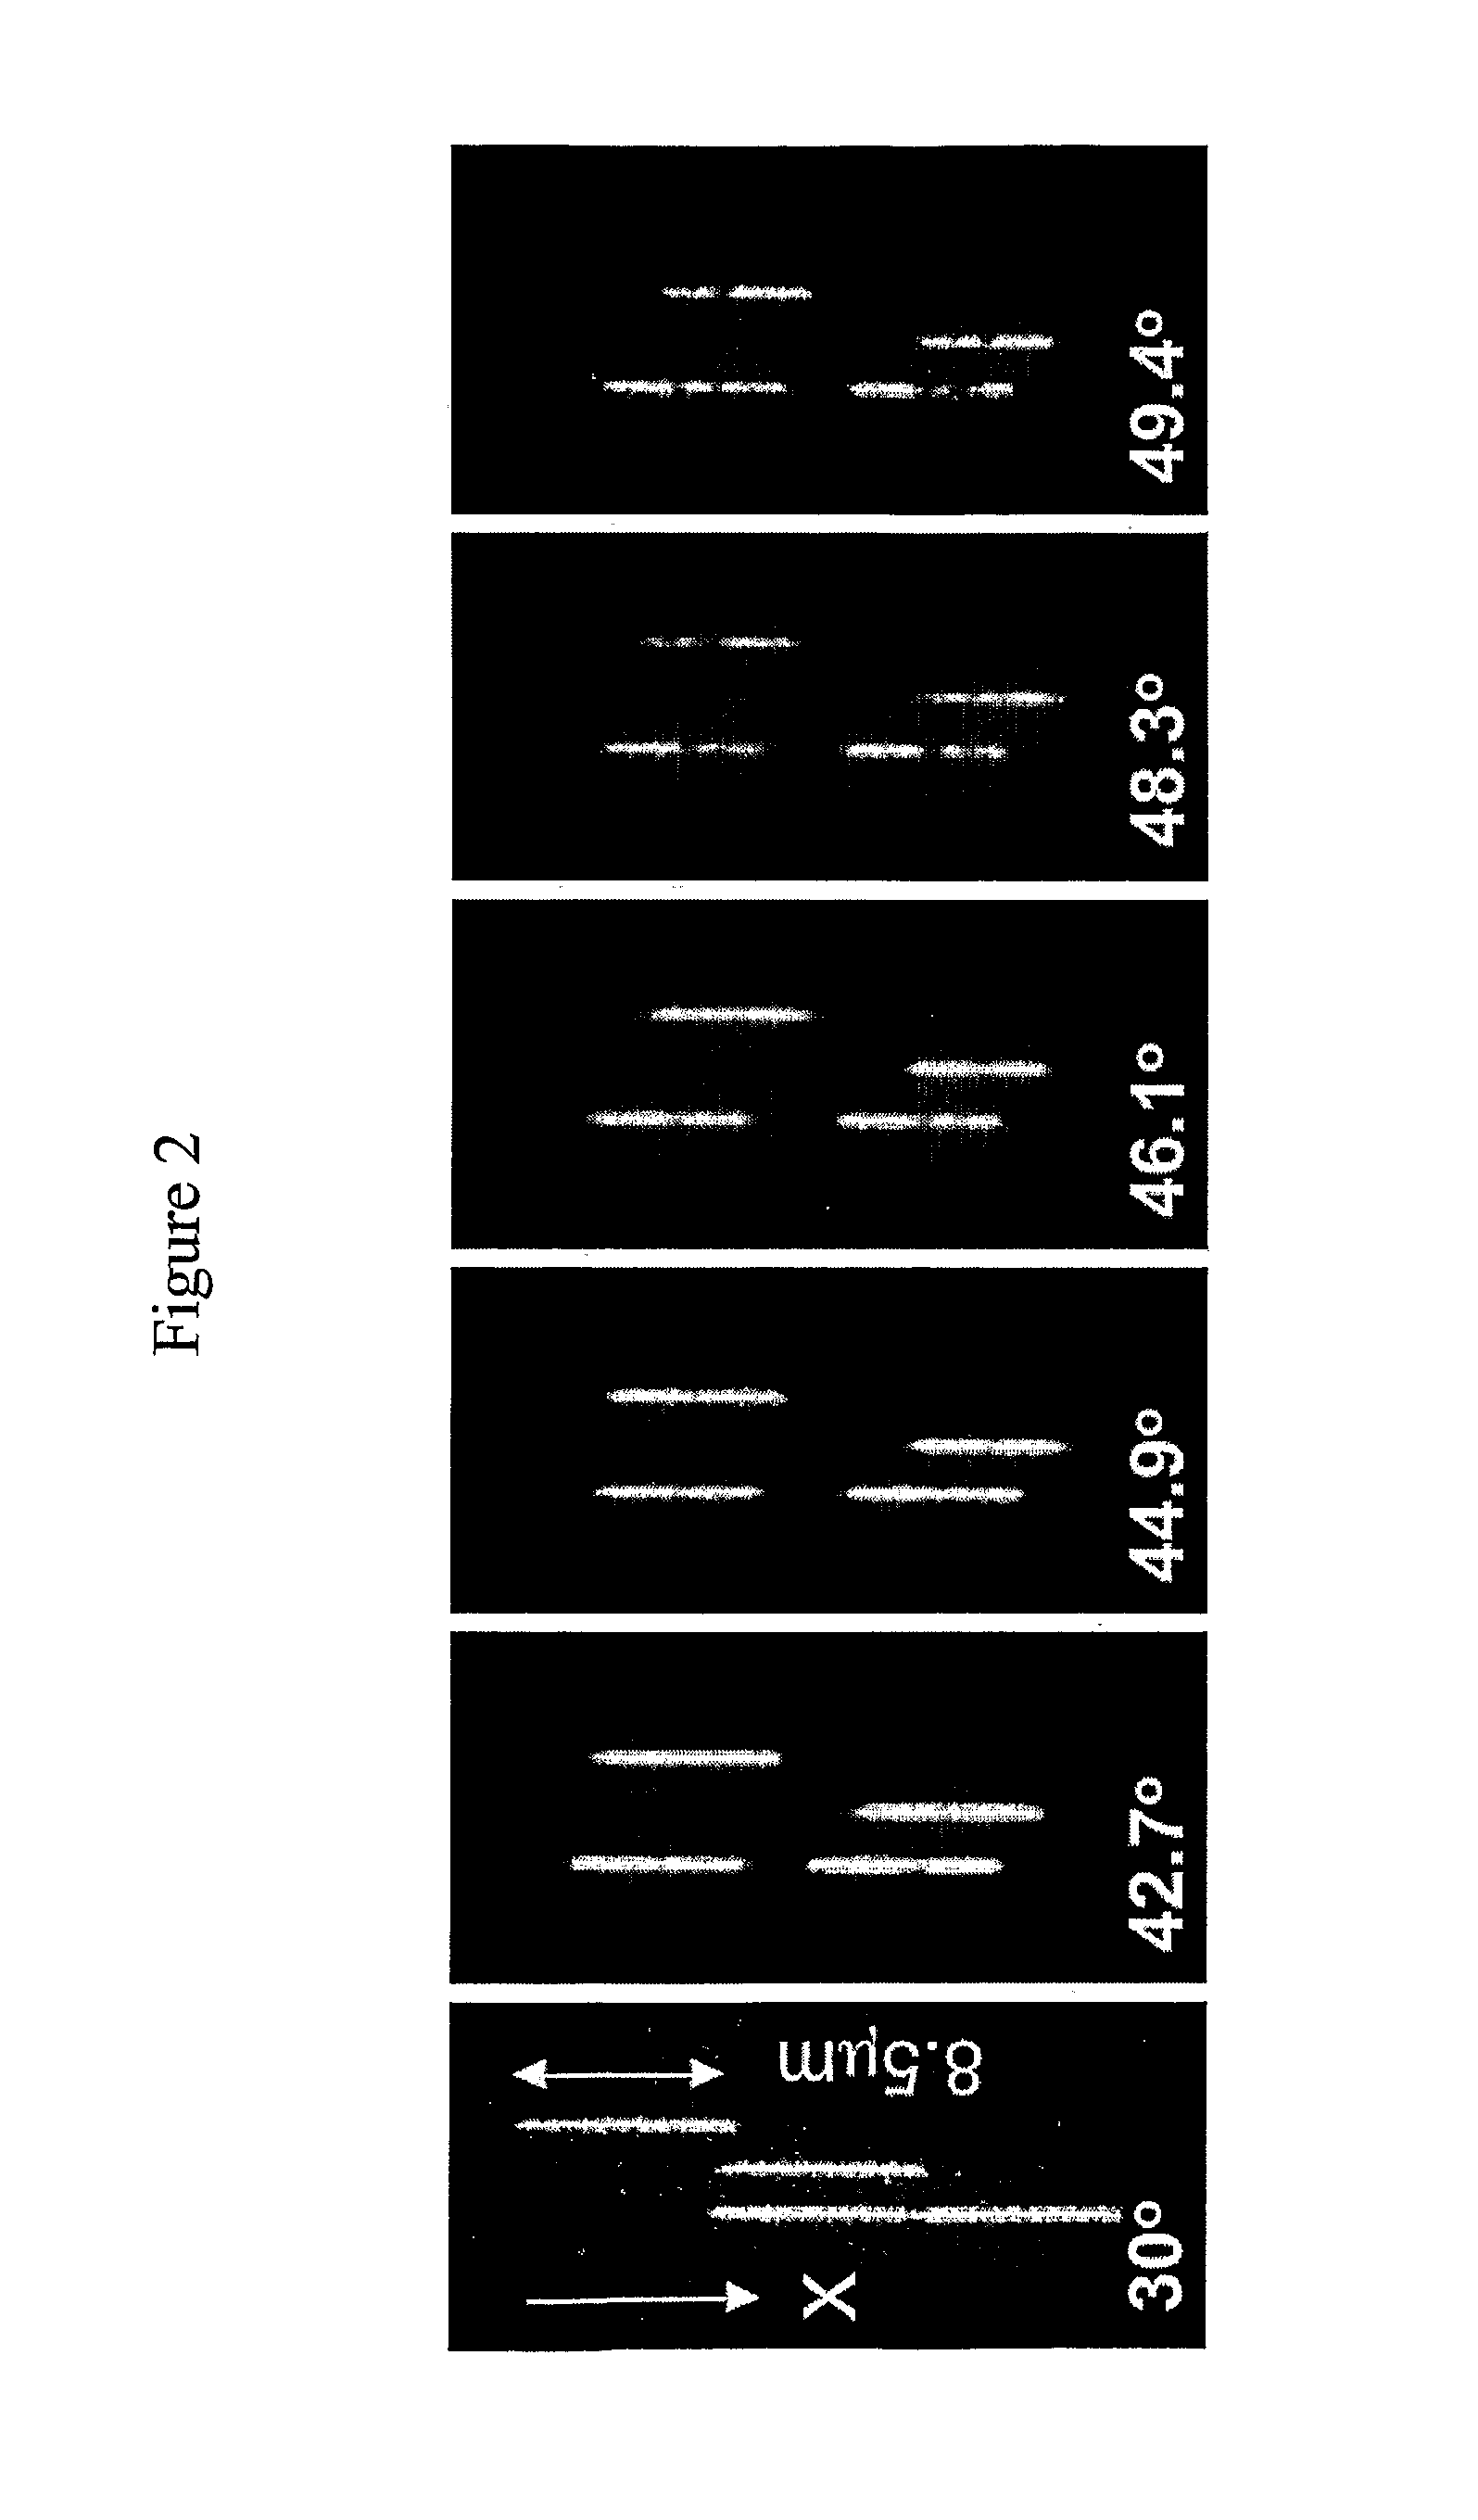
[0060]Uniform fluorescence is seen along each DNA molecule at room-temperature, and with rising temperature, dark patches appear along the DNA corresponding to AT-rich regions that lose in intensity due to local melting of the double-stranded helix thereby resulting in a “barcode” pattern along the DNA. The asymmetric pattern is consistent across all molecules viewed (FIG. 2) and corresponds to AT-rich regions in the middle and on one side of lambda-phage DNA (FIG. 3).

[0061]Gradually increasing ...

example 2

Fabrication

[0063]The devices were fabricated on fused silica wafers (HOYA) via a three stage process combining electron beam and UV contact lithography. A 200 μm long array of 120-150 nm wide nanochannels spaced 2 μm apart was defined using electron beam lithography (JEOL) in zep520A resist and then transferred to the silica substrate via CF4:CHF3 reactive ion etching (RIE). Contact UV lithography was then used to expose a 350 μm long and 50 μm wide nanoslit in photoresist running perpendicular to the nanochannel array. The slit was etched using RIE to a depth of 30 nm. Where the slit and the nanochannel array intersected, an array of nanogroove structures was formed; see FIG. 8. In order to introduce buffer into the nanoslit and nanochannels, a last UV contact lithography and etching step was used to define a 50 μm wide microchannel 1 μm deep in U-shaped arms adjoining the nanoslit and nanochannels (FIG. 8). Loading holes were sandblasted in the reservoirs (eight total) and the ch...


PUM

PropertyMeasurementUnit
diameteraaaaaaaaaa
diameteraaaaaaaaaa
lengthaaaaaaaaaa

Abstract

The invention relates to a method for analysis of the AT / GC ratio of DNA by stretching the DNA in nanochannels and performing melting mapping of the AT / GC ratio along the DNA molecule.

Description

FIELD OF INVENTION[0001]The invention relates to a method for the mapping of the local AT / GC ratio along the DNA as well as a nanochannel device to be used in said method.BACKGROUND OF THE INVENTION[0002]DNA mapping takes place using a variety of techniques, which give coarse-grained information on the genome. These techniques are based on sequence specific probes such as in DNA arrays or in fluorescence in-situ hybridization (FISH) with resolution of ˜50 kbp. They can also be based on restriction enzymes that cut the DNA at specific sequences with resolution ˜5 kbp. A common limitation for these techniques is that solely the sequences present in the test can be analysed. Chromosomal banding such as G-banding of metaphase chromosomes circumvents the need for sequence specific probes but with a poor resolution of ˜5 Mbp.[0003]Array comparative genomic hybridisation (CGH) uses DNA arrays to map out the entire genome, specifically looking for copy number variations (CNV). The arrays ca...

Claims


Application Information

Patent Timeline
Patent Type & Authority Applications(United States)
IPC IPC(8): C40B30/00G01N33/50C40B60/12B82Y99/00
CPCB01L3/502761B01L7/00B01L2200/0663B01L2300/0877B01L2300/1805B01L2300/1833Y10T436/143333C12Q1/6816B01L2300/1861G01N21/6458C12Q2565/629C12Q2565/107
Inventor TEGENFELDT, JONASREISNER, WALTERFLYVBJERG, HENRIK
Owner TEGENFELDT JONAS
Why Eureka
Try Eureka