Marker for diagnosis of exposure to electromagnetic radiation and diagnostic kit comprising the same
a diagnostic kit and electromagnetic radiation technology, applied in the field of diagnostic kit and electromagnetic radiation detection marker, can solve the problems of brain damage in the cortex, hippocampus, basal ganglia, and rats exposed to rf radiation
- Summary
- Abstract
- Description
- Claims
- Application Information
AI Technical Summary
Problems solved by technology
Method used
Image
Examples
example 1
Experiment Methods
1-1. Electromagnetic Radiation Exposure
[0059]Human normal fibroblast WI-38 cells were exposed for 24 hrs to 1762.5 MHz radiation at a 60 W / kg specific absorption ratio (SAR). Normal WI-38 cells which were incubated for 24 hrs in a 37° C. incubator without RF radiation exposure were used as a control.
1-2. mRNA Isolation
[0060]Total RNA was isolated using an RNeasy Mini kit (Qiagen GmbH, Hilden, Germany). The purity and integrity of the isolated RNA were determined using a Nanodrop spectrometer (NanoDrop Technologies, Wilmington, Del., USA) and an Agilent bioanalyzer (Agilent Technologies, Santa Clara, Calif., USA), respectively.
1-3. mRNA Microarray
[0061]The chip used was GeneChip Human Gene 1.0 ST Array of Affymetrix. Of the total RNA, 100 ng was amplified using RT-PCR and the amplification product of the RNA was processed and labeled with biotin according to the Affymetrix Genechip Whole Transcript(Wi) Sense Target Labeling assay. Then, 5.5 μg of the biotin-labeled ...
example 2
Test Results
2-1. Genes Changed in Expression Level upon RF Radiation Exposure
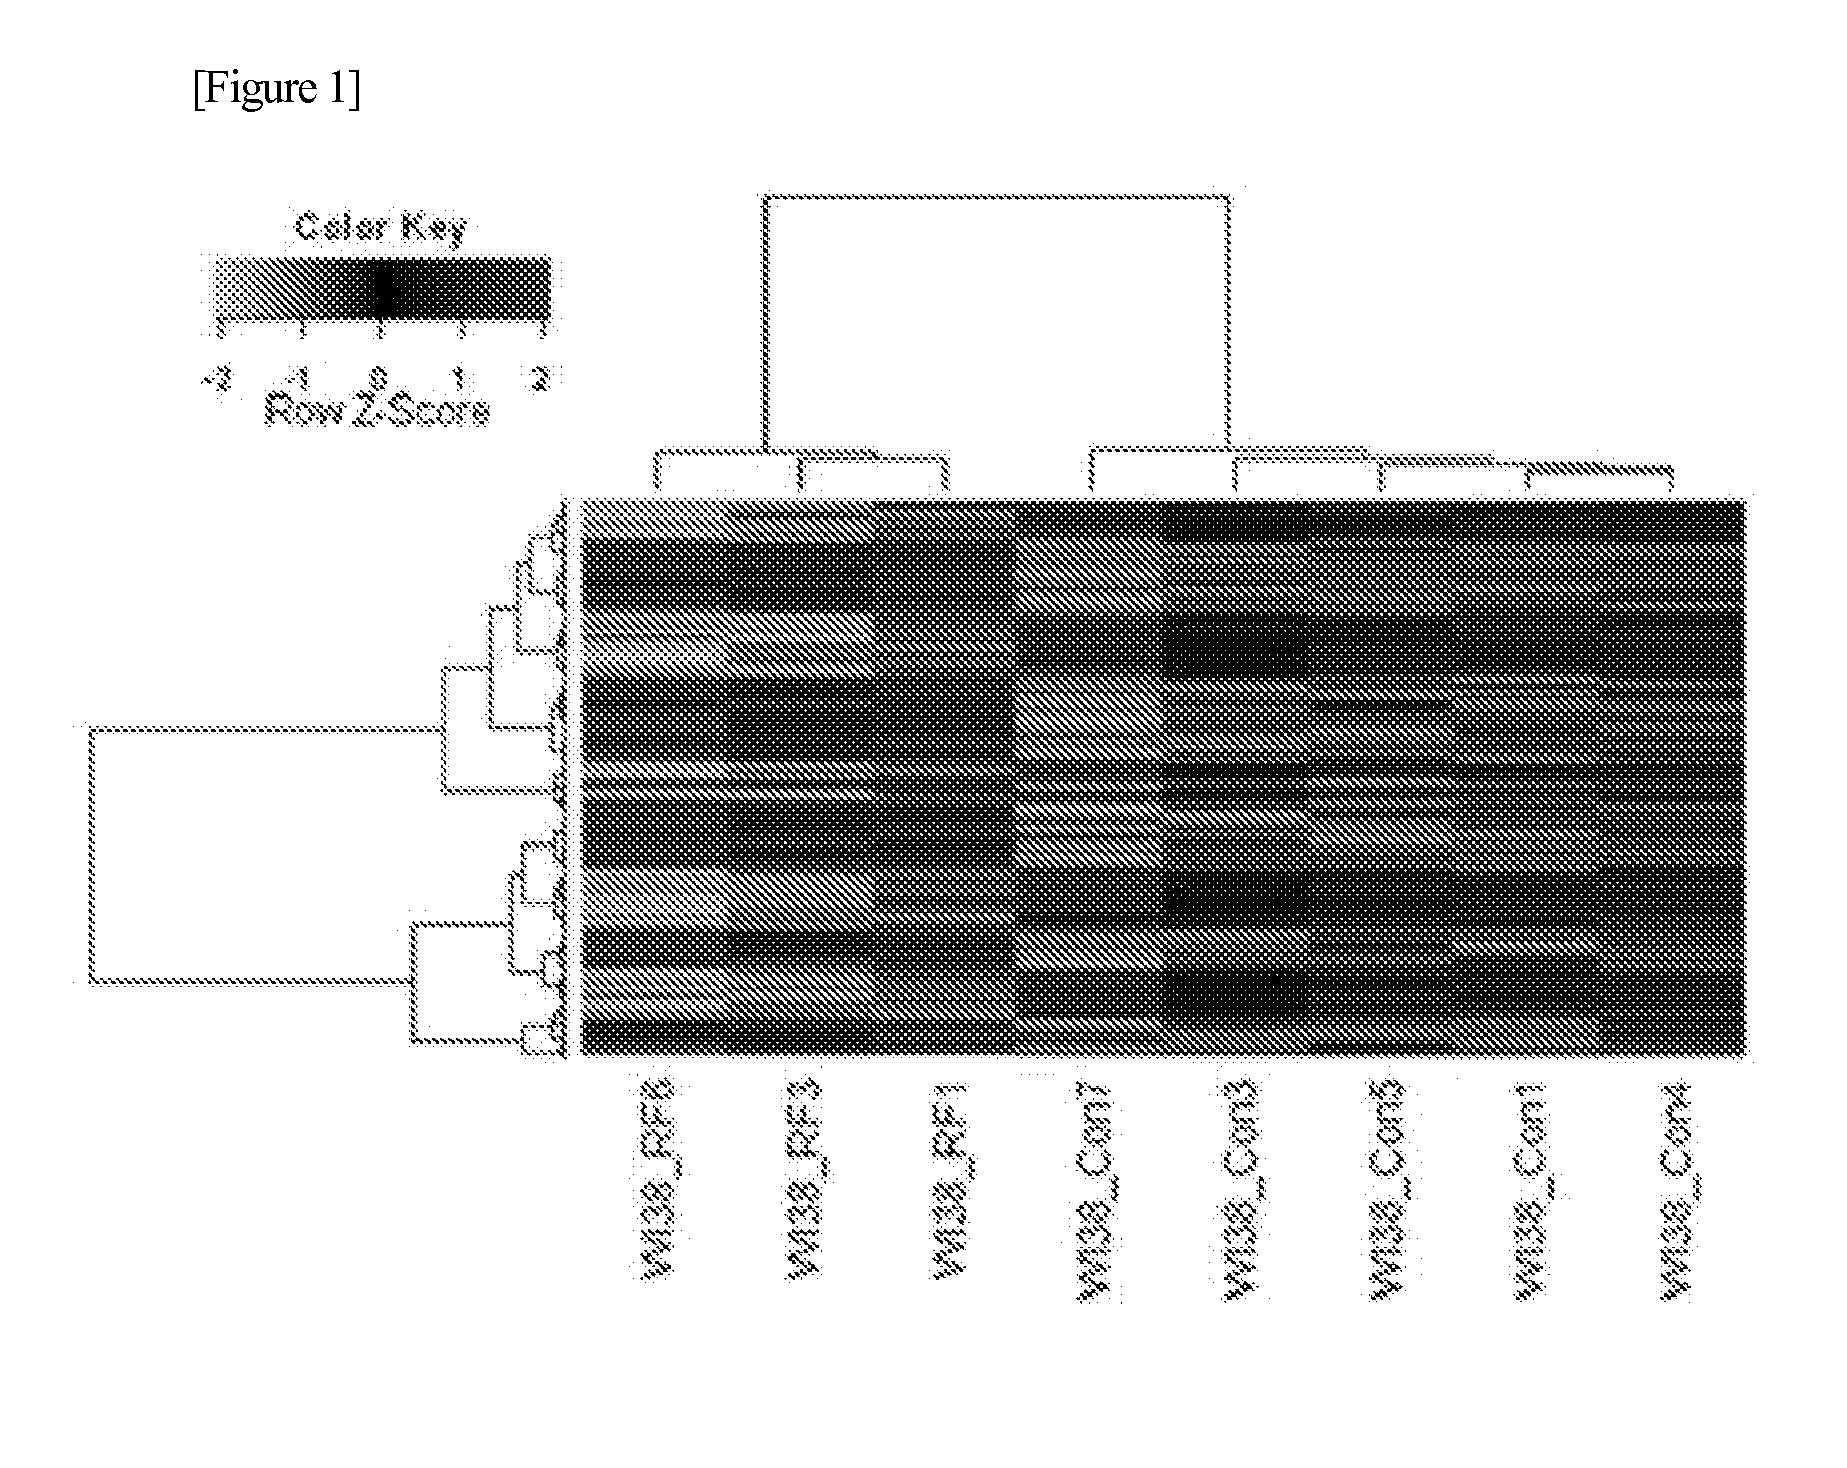
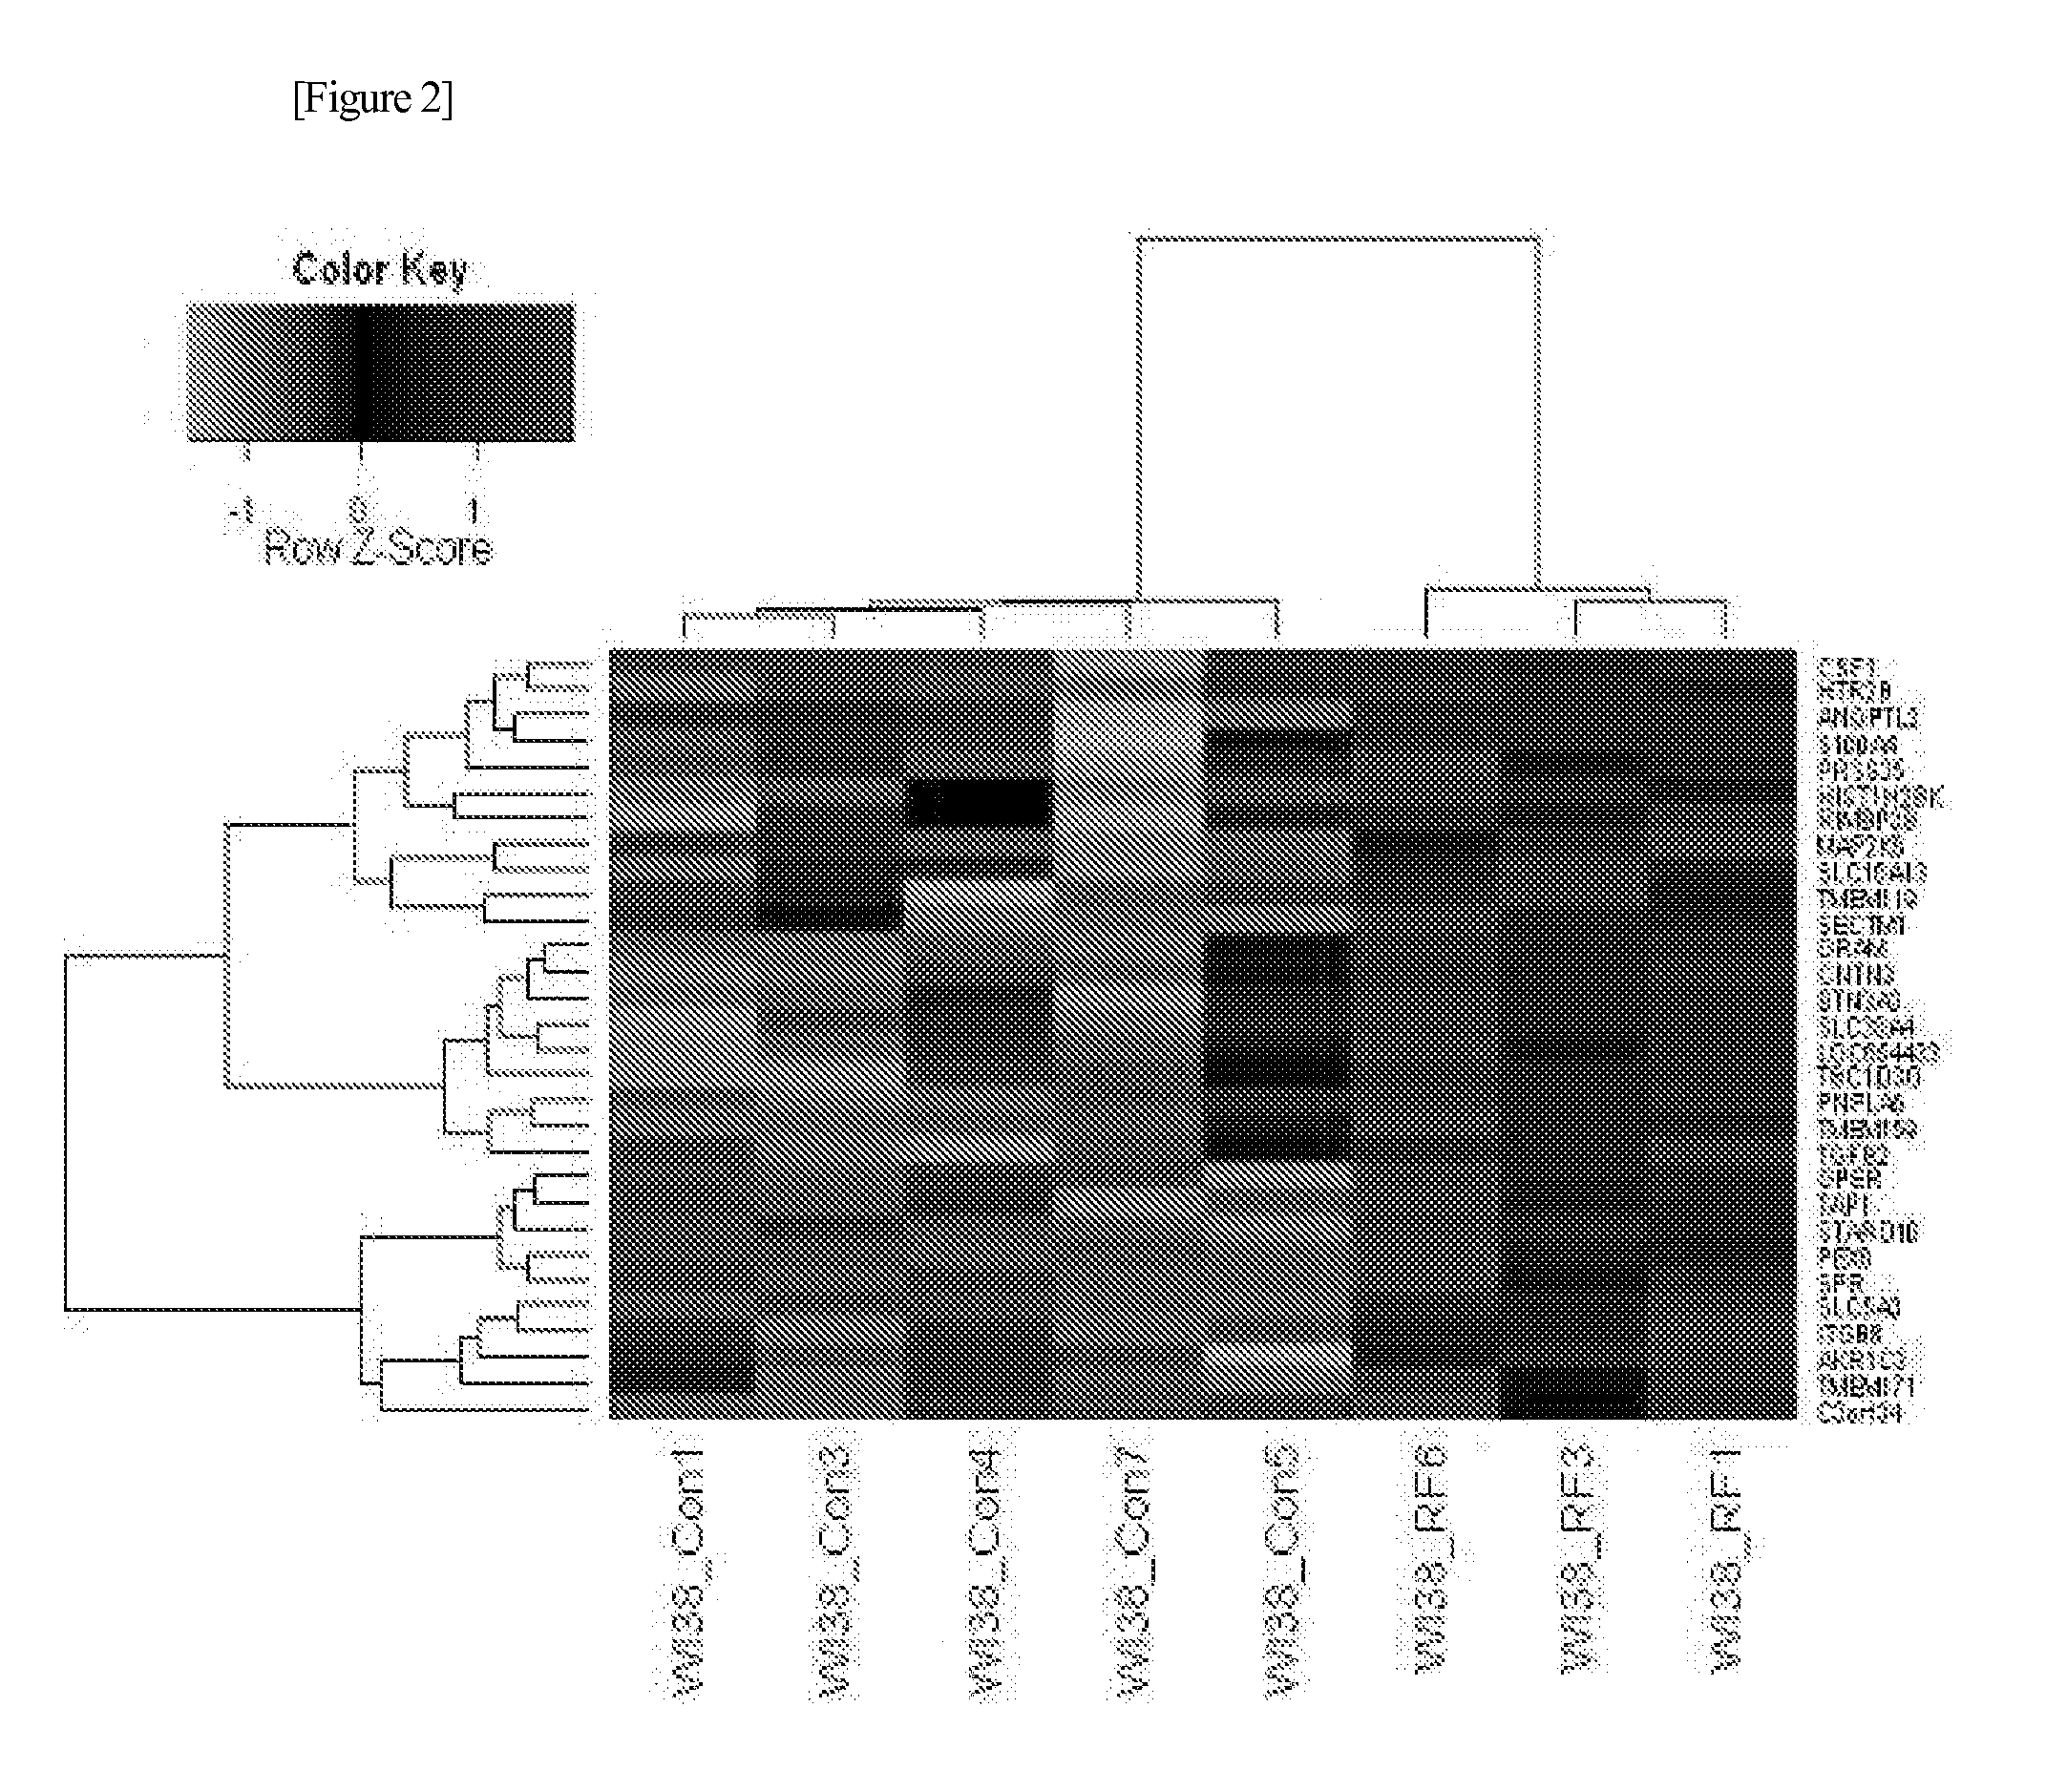
[0066]Upon RF radiation exposure, 788 genes showed significant changes in expression level: an increase of expression level was detected in 358 genes while the remaining 430 decreased in expression level. Multiple testing corrections were performed using the Benjamini-Hochberg False Discovery Rate (BH FDR) method with increasing type I error rates, with significance after controlling for an BH FDR of 5%. The relative expression levels of the 788 genes are depicted in the heat map of FIG. 1.
[0067]As a result of analysis, the genes of increased expression levels were found to be involved mainly in “negative regulation of developmental process / organ morphogenesis,”“response to protein stimulus,” and “developmental process” (Table 1), being in connection with “Antigen processing and presentation,”“MAPK signaling pathway,” and “Notch signaling pathway” (Table 2).
TABLE 1FunctionalBH FDRgroupTermCount%P valueP val...
PUM
| Property | Measurement | Unit |
|---|---|---|
| Frequency | aaaaa | aaaaa |
| Fraction | aaaaa | aaaaa |
| Fraction | aaaaa | aaaaa |
Abstract
Description
Claims
Application Information
 - R&D
- Intellectual Property
- Life Sciences
- Materials
- Tech Scout
- Unparalleled Data Quality
- Higher Quality Content
- 60% Fewer Hallucinations
Browse by: Latest US Patents, China's latest patents, Technical Efficacy Thesaurus, Application Domain, Technology Topic, Popular Technical Reports.
© 2025 PatSnap. All rights reserved.Legal|Privacy policy|Modern Slavery Act Transparency Statement|Sitemap|About US| Contact US: help@patsnap.com


