SEM Imaging Method
a scanning electron microscopy and sample technology, applied in material analysis using wave/particle radiation, instruments, nuclear engineering, etc., can solve the problems of inability to perform inter-image contrast adjustment (key step), prior applications of this technique have tended to limit themselves, and the known technique has not yet been successfully applied in life sciences investigations
- Summary
- Abstract
- Description
- Claims
- Application Information
AI Technical Summary
Problems solved by technology
Method used
Image
Examples
embodiment 1
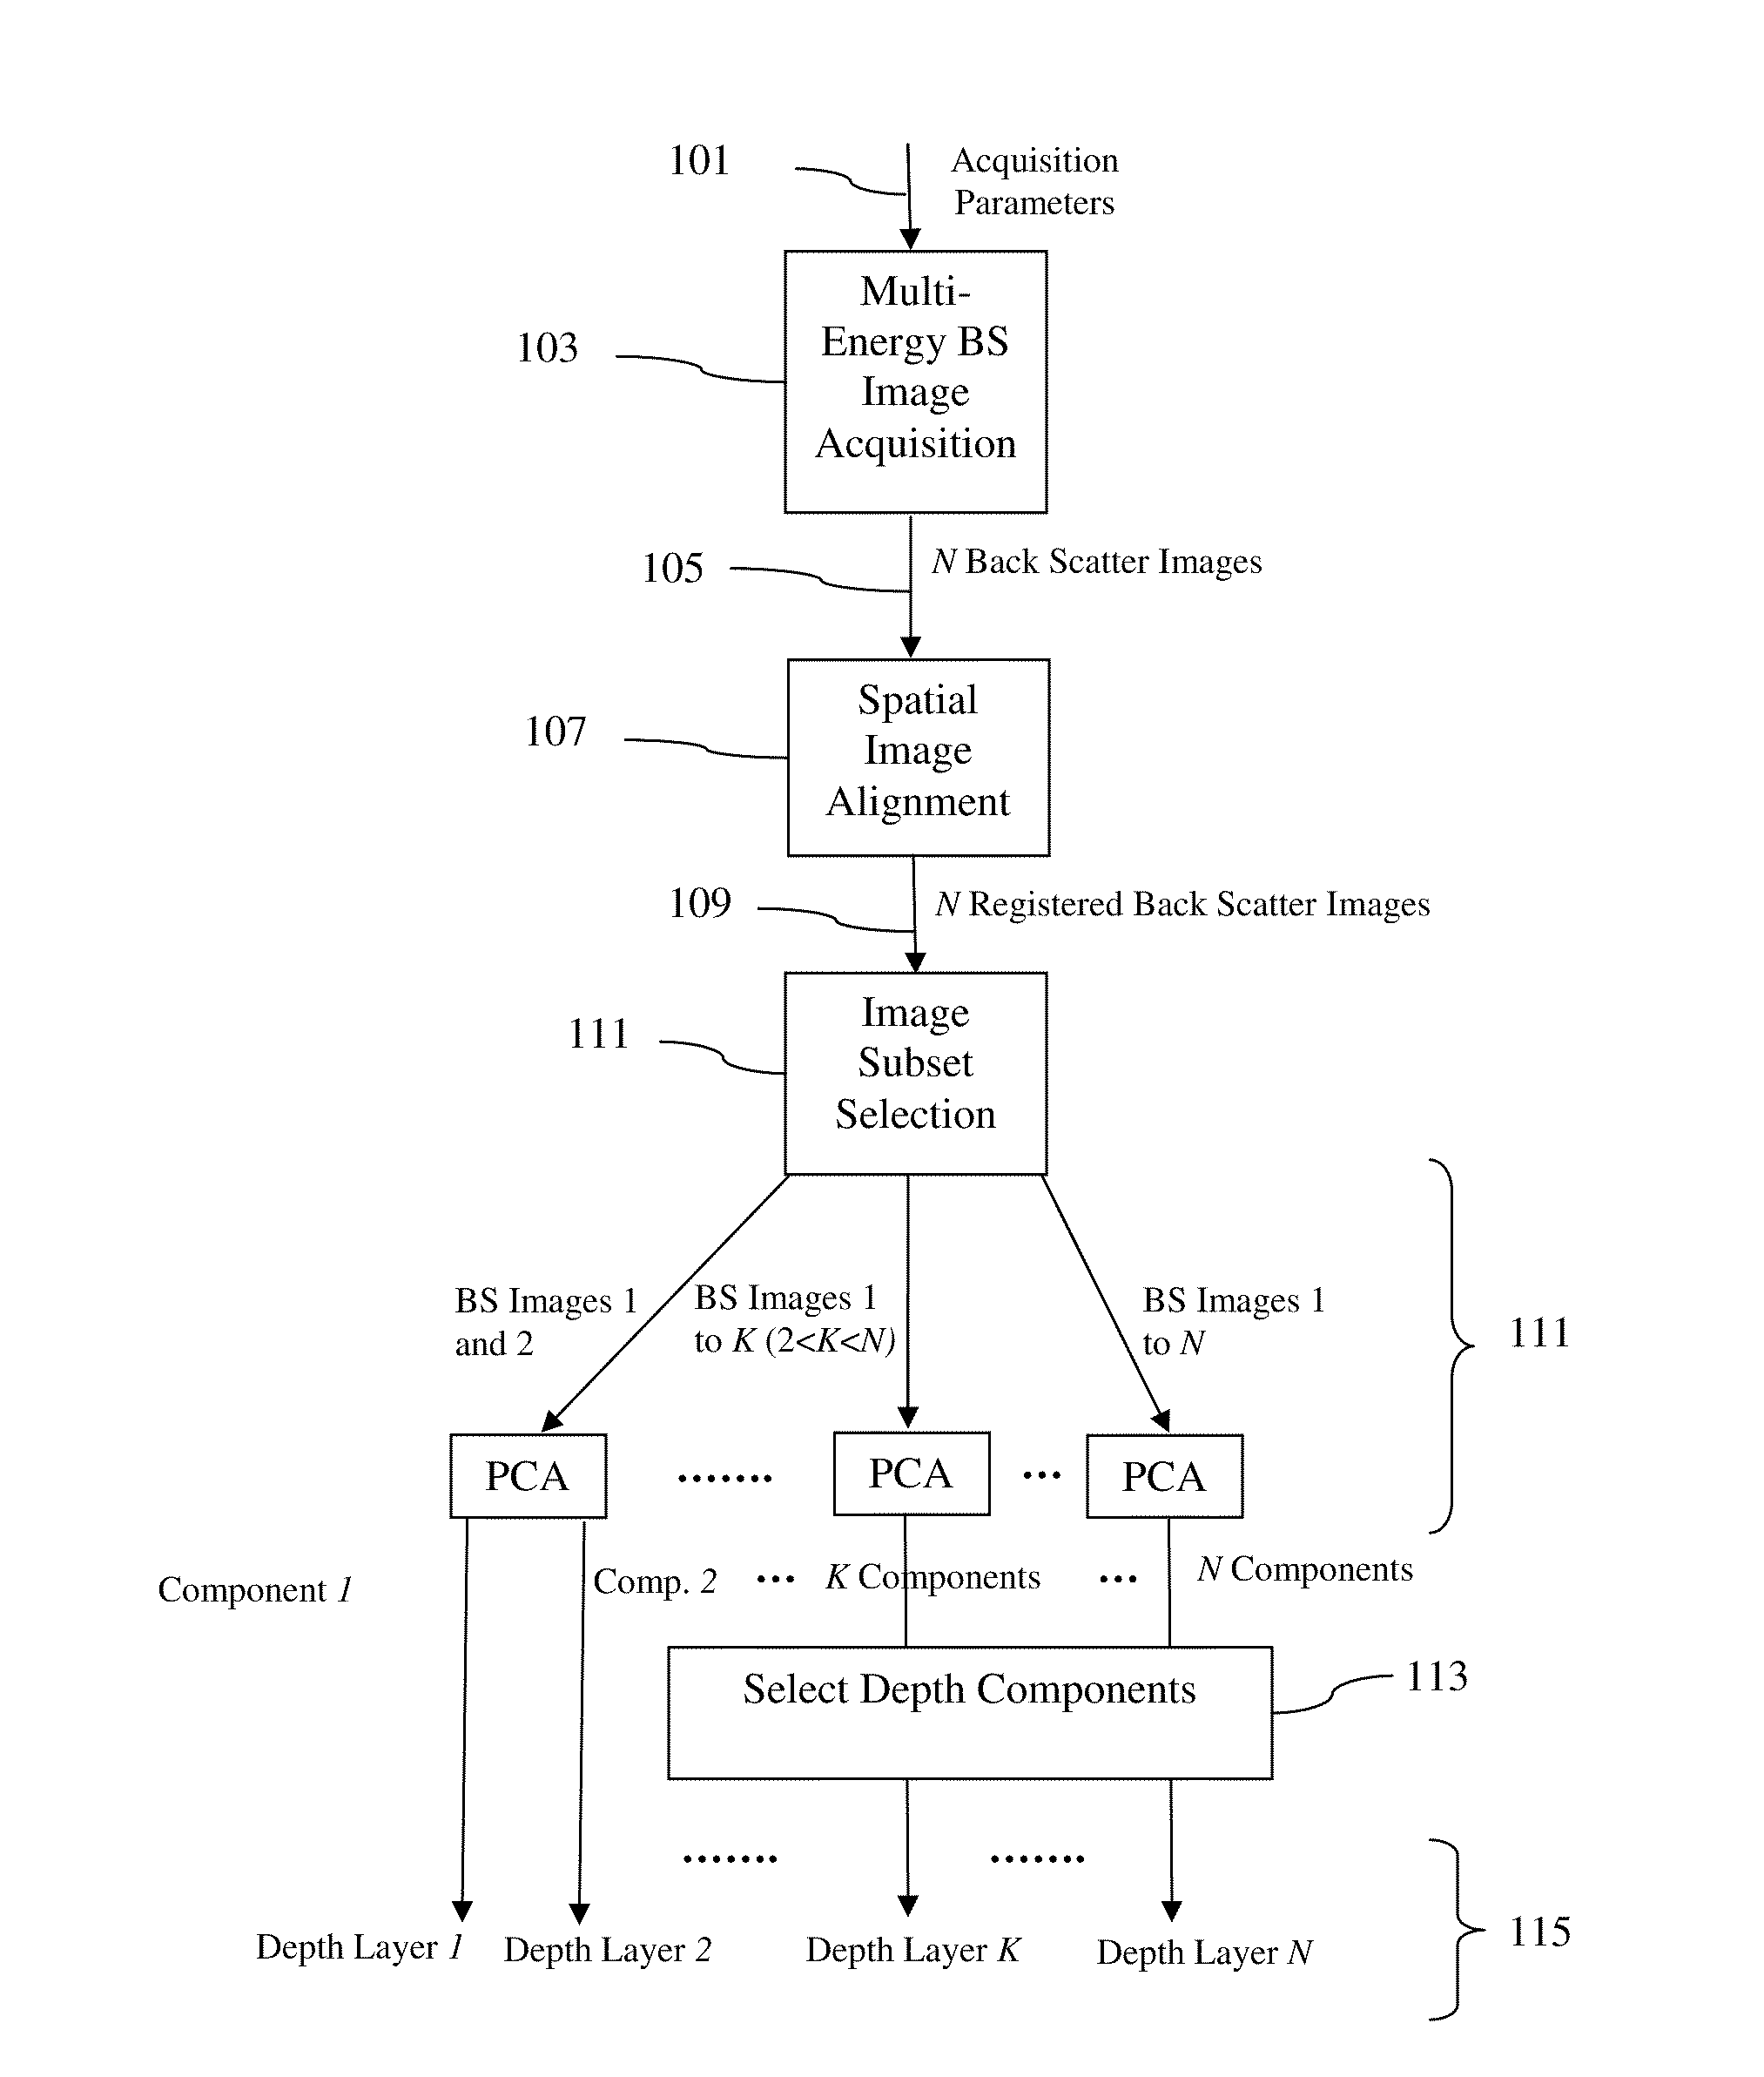
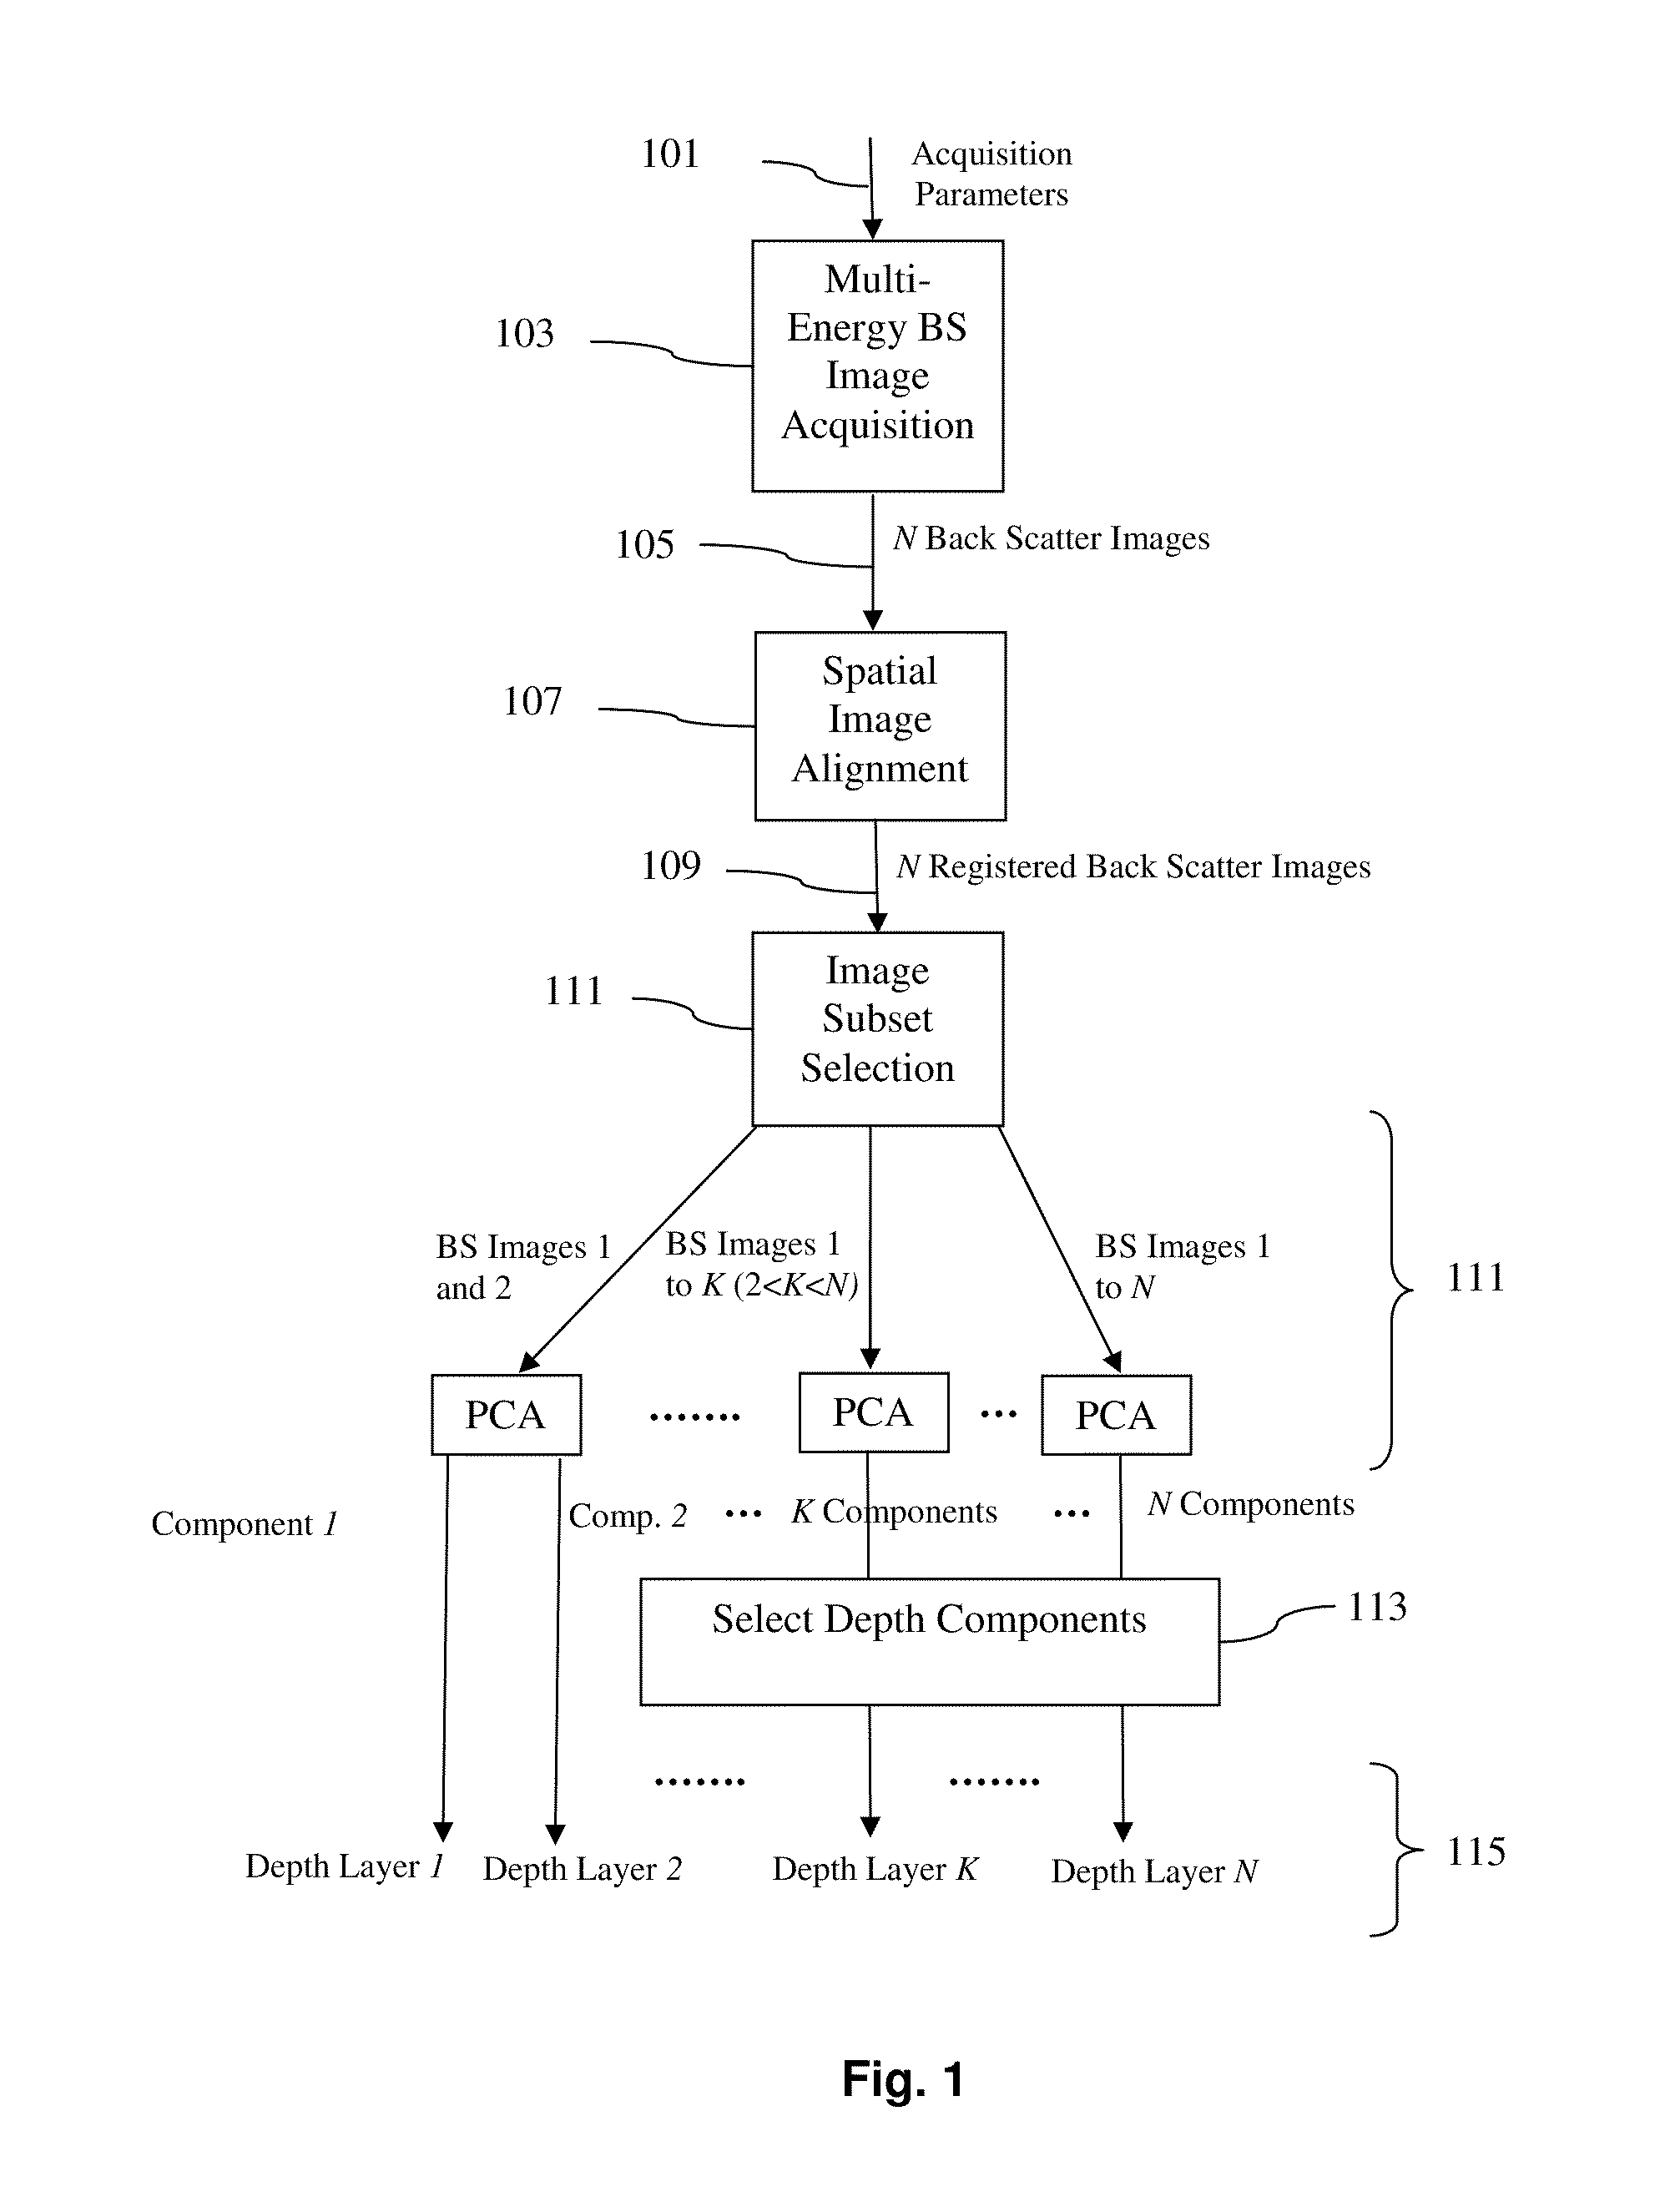
[0059]FIG. 1 shows a flowchart of an embodiment of a SEM-based 3D volume imaging method according to the present invention. The various steps in this flowchart can be further elucidated as follows:[0060]101: Acquisition parameters are decided upon. Here, one makes selections as regards N (number of measurement sessions), P (beam parameter to be varied between measurement sessions), ΔP (size of increment in P between measurement sessions), the stimulated radiation to be detected, and M (which measurand of the stimulated radiation is to be measured). For example, one may choose N=7, P=landing energy, ΔP=100 eV, stimulated radiation=BS electrons, M=BS electron current.[0061]103: On the basis of the parameters selected in step 101, a set of BS images is acquired. These images represent convoluted data as regards depth information in the sample under investigation.[0062]105: The N acquired BS images form a raw data set.[0063]107: The elements of the data set are laterally aligned and / or ...
embodiment 2
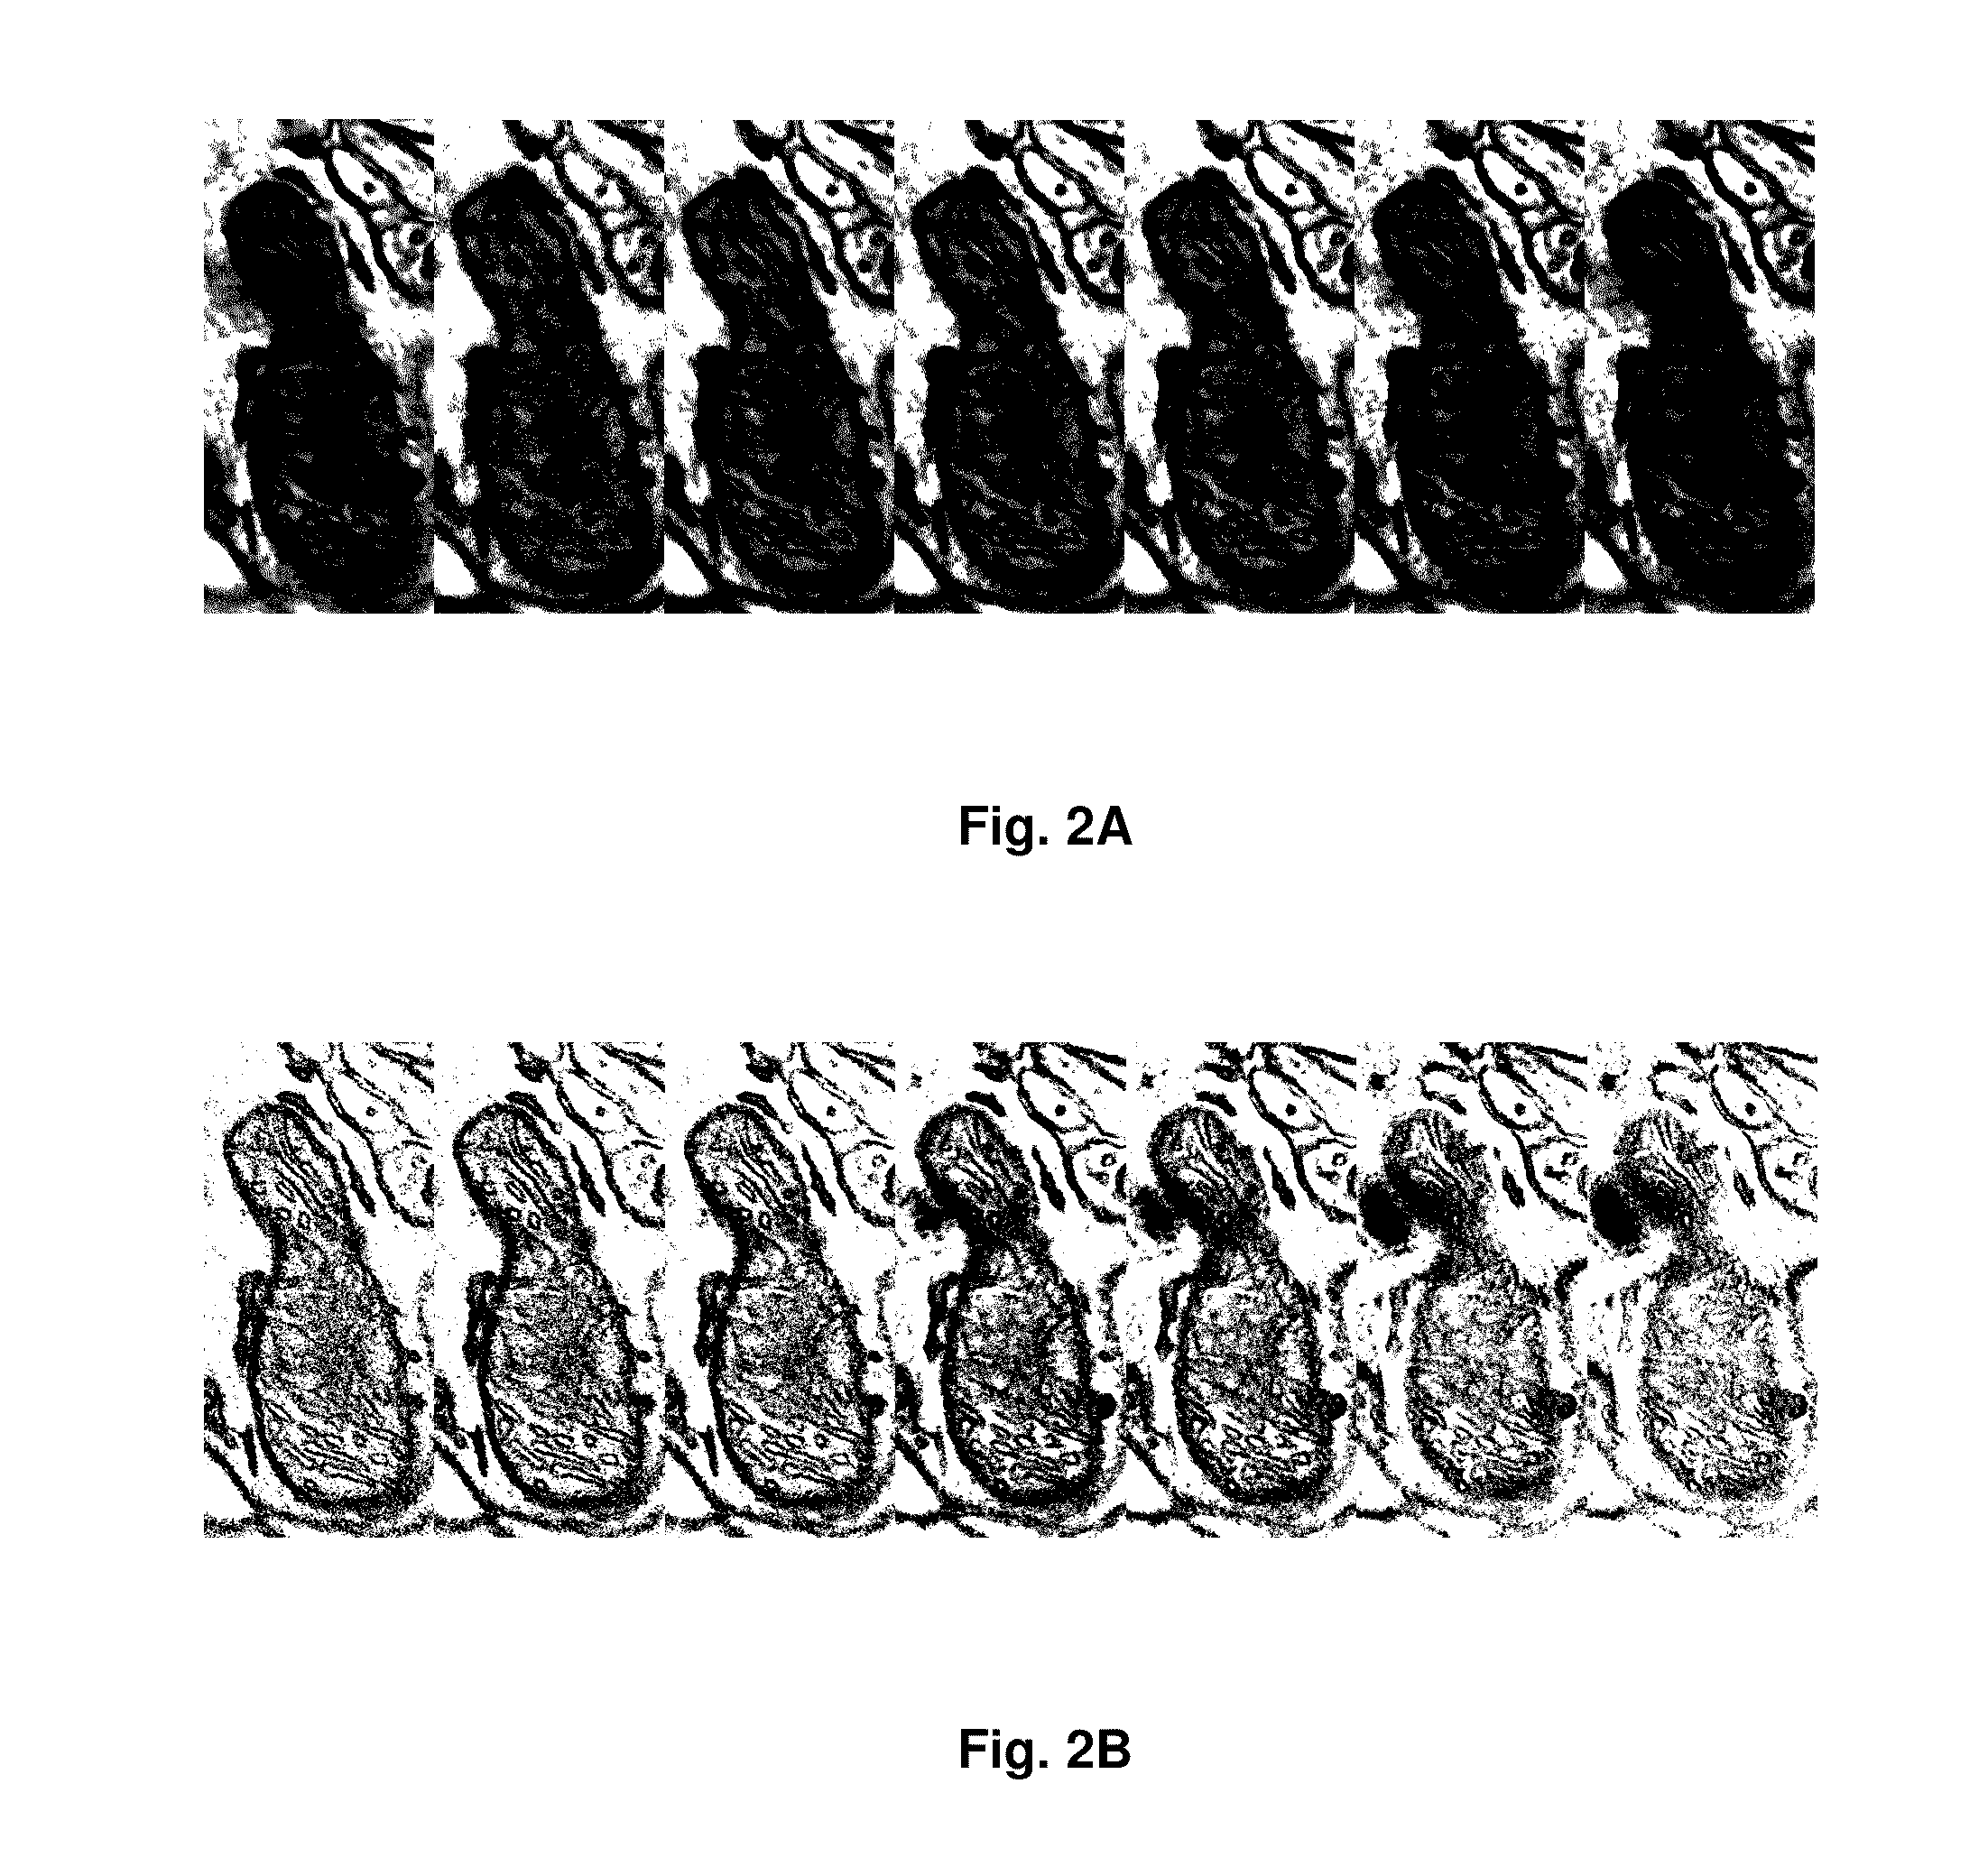
[0069]FIGS. 2A and 2B show results of SEM-based 3D slicing into progressively deeper layers of a stained biological sample (in this particular case, a brain cell of a mouse). In both cases, the sample was irradiated at progressively higher energies—in the range 700 eV to 1900 eV, in 200 eV increments—and BS electrons emanating from the irradiated sample were detected. The results are illustrated as follows:[0070]FIG. 2A shows the BS image sequence of a mitochondrion in the sample, without any attempt at de-convolution of detected data.[0071]FIG. 2B shows a corresponding image sequence after application of a method according to the present invention, representing de-convolved, depth-resolved images of the same mitochondrion, and revealing 3D structures not (clearly) visible in FIG. 2A.
embodiment 3
[0072]The linearity assumptions in image formation elucidated above can be represented in the model:
Q=AI (1)
in which:[0073]I=(I1, I2, . . . , IN)T is the set of images acquired by varying beam parameters;[0074]Q=(Q1, Q2, . . . , QN)T is a set of source images that are statistically de-correlated and that represent information coming from different depth layers (levels);[0075]A=(a1, a2, . . . , aN)T is a square matrix transforming the original images into so-called principal components.
[0076]PCA decomposition obtains the factorization in equation (1) by finding a set of orthogonal components, starting with a search for the one with the highest variance.
The first step consists in minimizing the criterion:
a1=argmaxa=1E{(aTI)2}(2)
[0077]The next step is to subtract the found component from the original images, and to find the next layer with highest variance.
At iteration 1
ak=argmaxa=1E{(aT(I-∑i=1k-1wiwiTI))2}(3)
[0078]It can be shown (...
PUM
| Property | Measurement | Unit |
|---|---|---|
| landing energy | aaaaa | aaaaa |
| thickness | aaaaa | aaaaa |
| Scanning Electron Microscopy | aaaaa | aaaaa |
Abstract
Description
Claims
Application Information
 - R&D
- Intellectual Property
- Life Sciences
- Materials
- Tech Scout
- Unparalleled Data Quality
- Higher Quality Content
- 60% Fewer Hallucinations
Browse by: Latest US Patents, China's latest patents, Technical Efficacy Thesaurus, Application Domain, Technology Topic, Popular Technical Reports.
© 2025 PatSnap. All rights reserved.Legal|Privacy policy|Modern Slavery Act Transparency Statement|Sitemap|About US| Contact US: help@patsnap.com


