Method and apparatus for material analysis by a focused electron beam using characteristic x-rays and back-scattered electrons

a technology of electron beam and electron beam, which is applied in the direction of chemical methods analysis, instruments, electric digital data processing, etc., can solve the problems of equipment not being able to detect a boundary, difficult to correct classification, and difficult to meet the precondition

Inactive Publication Date: 2013-02-28
TESCAN
View PDF6 Cites 27 Cited by
  • Summary
  • Abstract
  • Description
  • Claims
  • Application Information

AI Technical Summary

Benefits of technology

[0019]The disadvantages described above are eliminated by the method of material analysis using a focused electron beam in a scanning electron microscope and the equipment to perform it. In a preferred embodiment, the method starts by establishing, using an expert estimate, an adequately large set P of chemical elements, further as set P, which might occur in the assayed sample. For each element pi from set P the interval Ii of energies of X-ray photons is determined corresponding to one of the emission lines of the element. Next, the focused electron beam is consecutively deflected to points on the assayed sample and at the points the intensity of the back-scattered electrons is established for the purpose of creating an electron map B and a histogram of the energies of the X-ray radiation emitted in this point is established with the purpose of creating a spectral map S. A significant feature of a preferred embodiment of the new method consists in the fact that a X-ray map Mi is created for each element pi from set P where the values Mi(x, y) stored in the map Mi are related to the points on the sample with coordinates (x, y) and correlate with the intensity of X-ray radiation with energy within the interval Ii emitted in these points. Afterwards, the multi-channel gradient algorithm is applied to the X-ray maps Mi and the electron map B to create a differential map D, where the values D(x, y) stored in the map D are related to the points on the sample with coordinates (x, y) and correlate with the magnitude of the intensity gradient of the back-scattered electrons and the magnitude of the intensity gradient of X-ray radiation with energy within intervals Ii for all elements pi from set P. This is followed by the image segmentation, using watershed transformation applied to the differential map D, in order to search for particles. The result of this operation is a set Q of particles, further as set Q, where each particle is assigned a sequence number j, and a map R of particle distribution, where the values R(x, y) stored in map R are related to the points on the sample with coordinates (x, y) and correlate with the sequence number of the particle. Using an expert estimate, the value of coefficient a is set, which value influences the weight of the border points in a weighted mean, and by using the weighted mean, for each particle qj from set Q, spectrum Xj of X-ray radiation is determined from spectral map S using the coefficient a, where the values Xj(E) stored in Xj are accumulated intensities of X-ray radiation with energy E. In the end, peak intensities Ni,j are computed as a total number of X-ray events recorded in spectrum Xj with energy within intervals Ii for all elements pi from set P and for all particles qj from set Q.
[0020]The gradient-based edge detection in multi-channel imagery can be realized using an algorithm that comprises the following steps. The input of the algorithm is a multi-channel image M that consists of n channels. The output is a single-channel gradient image H, where values H(x, y) at a point with coordinates x and y correspond to a magnitude of change of image M at that point. Initially, the values of matrices Fx and Fy are computed as the first-order partial derivatives of the discrete two-dimensional Gaussian function G(x, y, x0, y0, σ). The Gaussian function is centered to the central element of matrices and its width, the parameter σ, is set by an expert estimate based on the ratio of size of interaction volume in material of an assayed sample and known distance between two adjacent measurement spots.
[0021]Then, two partial derivatives Gix and Giy for the channel i and directions x and y are derived by two convolutions of channel Mi of the image M with matrices Fx and Fy respectively.
[0022]In a subsequent step, the values Gix and Giy are summed together for all channels i from 1 to n, to get the values a11, a12 and a22.
[0023]The value H(x, y) of resulting gradient image D is computed as the value of maximum eigenvalue λmax:
[0024]Another alternative preferred embodiment comprises using an expert estimate to set the values of coefficients bmin and bmax, which values represent the minimum and maximum expected level of intensity of the back-scattered electrons in materials which are the subject of the performed analysis. In the next step, the mean level of intensity of the back-scattered electrons bj is determined for each particle qj from the set Q based on the map R of particle distribution and the electron map B using the median. If value bj is situated within the closed interval between values bmin and bmax, particle qj is inserted in a new set Q′. Then, the spectrum Xj of X-ray radiation is established for each particle qj from the new set Q′ using a weighted mean from spectral map S using the coefficient a. Peak intensities Ni,j are subsequently computed as a total number of X-ray events recorded in spectrum Xj with energy within intervals Ii for all elements pi from set P and for all particles qj from set Q.

Problems solved by technology

This precondition is not easy to meet as the signal from the EDS detector is relatively weak relative to the resolution of the maps used in the particle analysis.
On the contrary, if the image segmentation is only based on an image from the BSE detector, the equipment is not able to detect a boundary between two materials which have a very close value of back-scatter coefficient n, as these materials cannot be distinguished only based on comparing the intensity level of the back-scattered electrons.
The disadvantage of this solution is the necessity to define a great number of spectral categories as owing to the size of the interaction volume for X-ray radiation which is comparable with the distance of the adjacent measuring points, there is emission of X-ray radiation in both particles in the vicinity of the interface of two particles.
As a result, spectroscopic data is distorted in this case while the detected characteristic X-rays originate at this point from two chemically different materials, and correct classification is difficult in this case.
Another disadvantage of the equipment is the fact that the detection of particles is based on a classification made using spectral data and ignores information from the detector of the back-scattered electrons.

Method used


Image

  • Method and apparatus for material analysis by a focused electron beam using characteristic x-rays and back-scattered electrons
  • Method and apparatus for material analysis by a focused electron beam using characteristic x-rays and back-scattered electrons
  • Method and apparatus for material analysis by a focused electron beam using characteristic x-rays and back-scattered electrons

Examples


Embodiment Construction

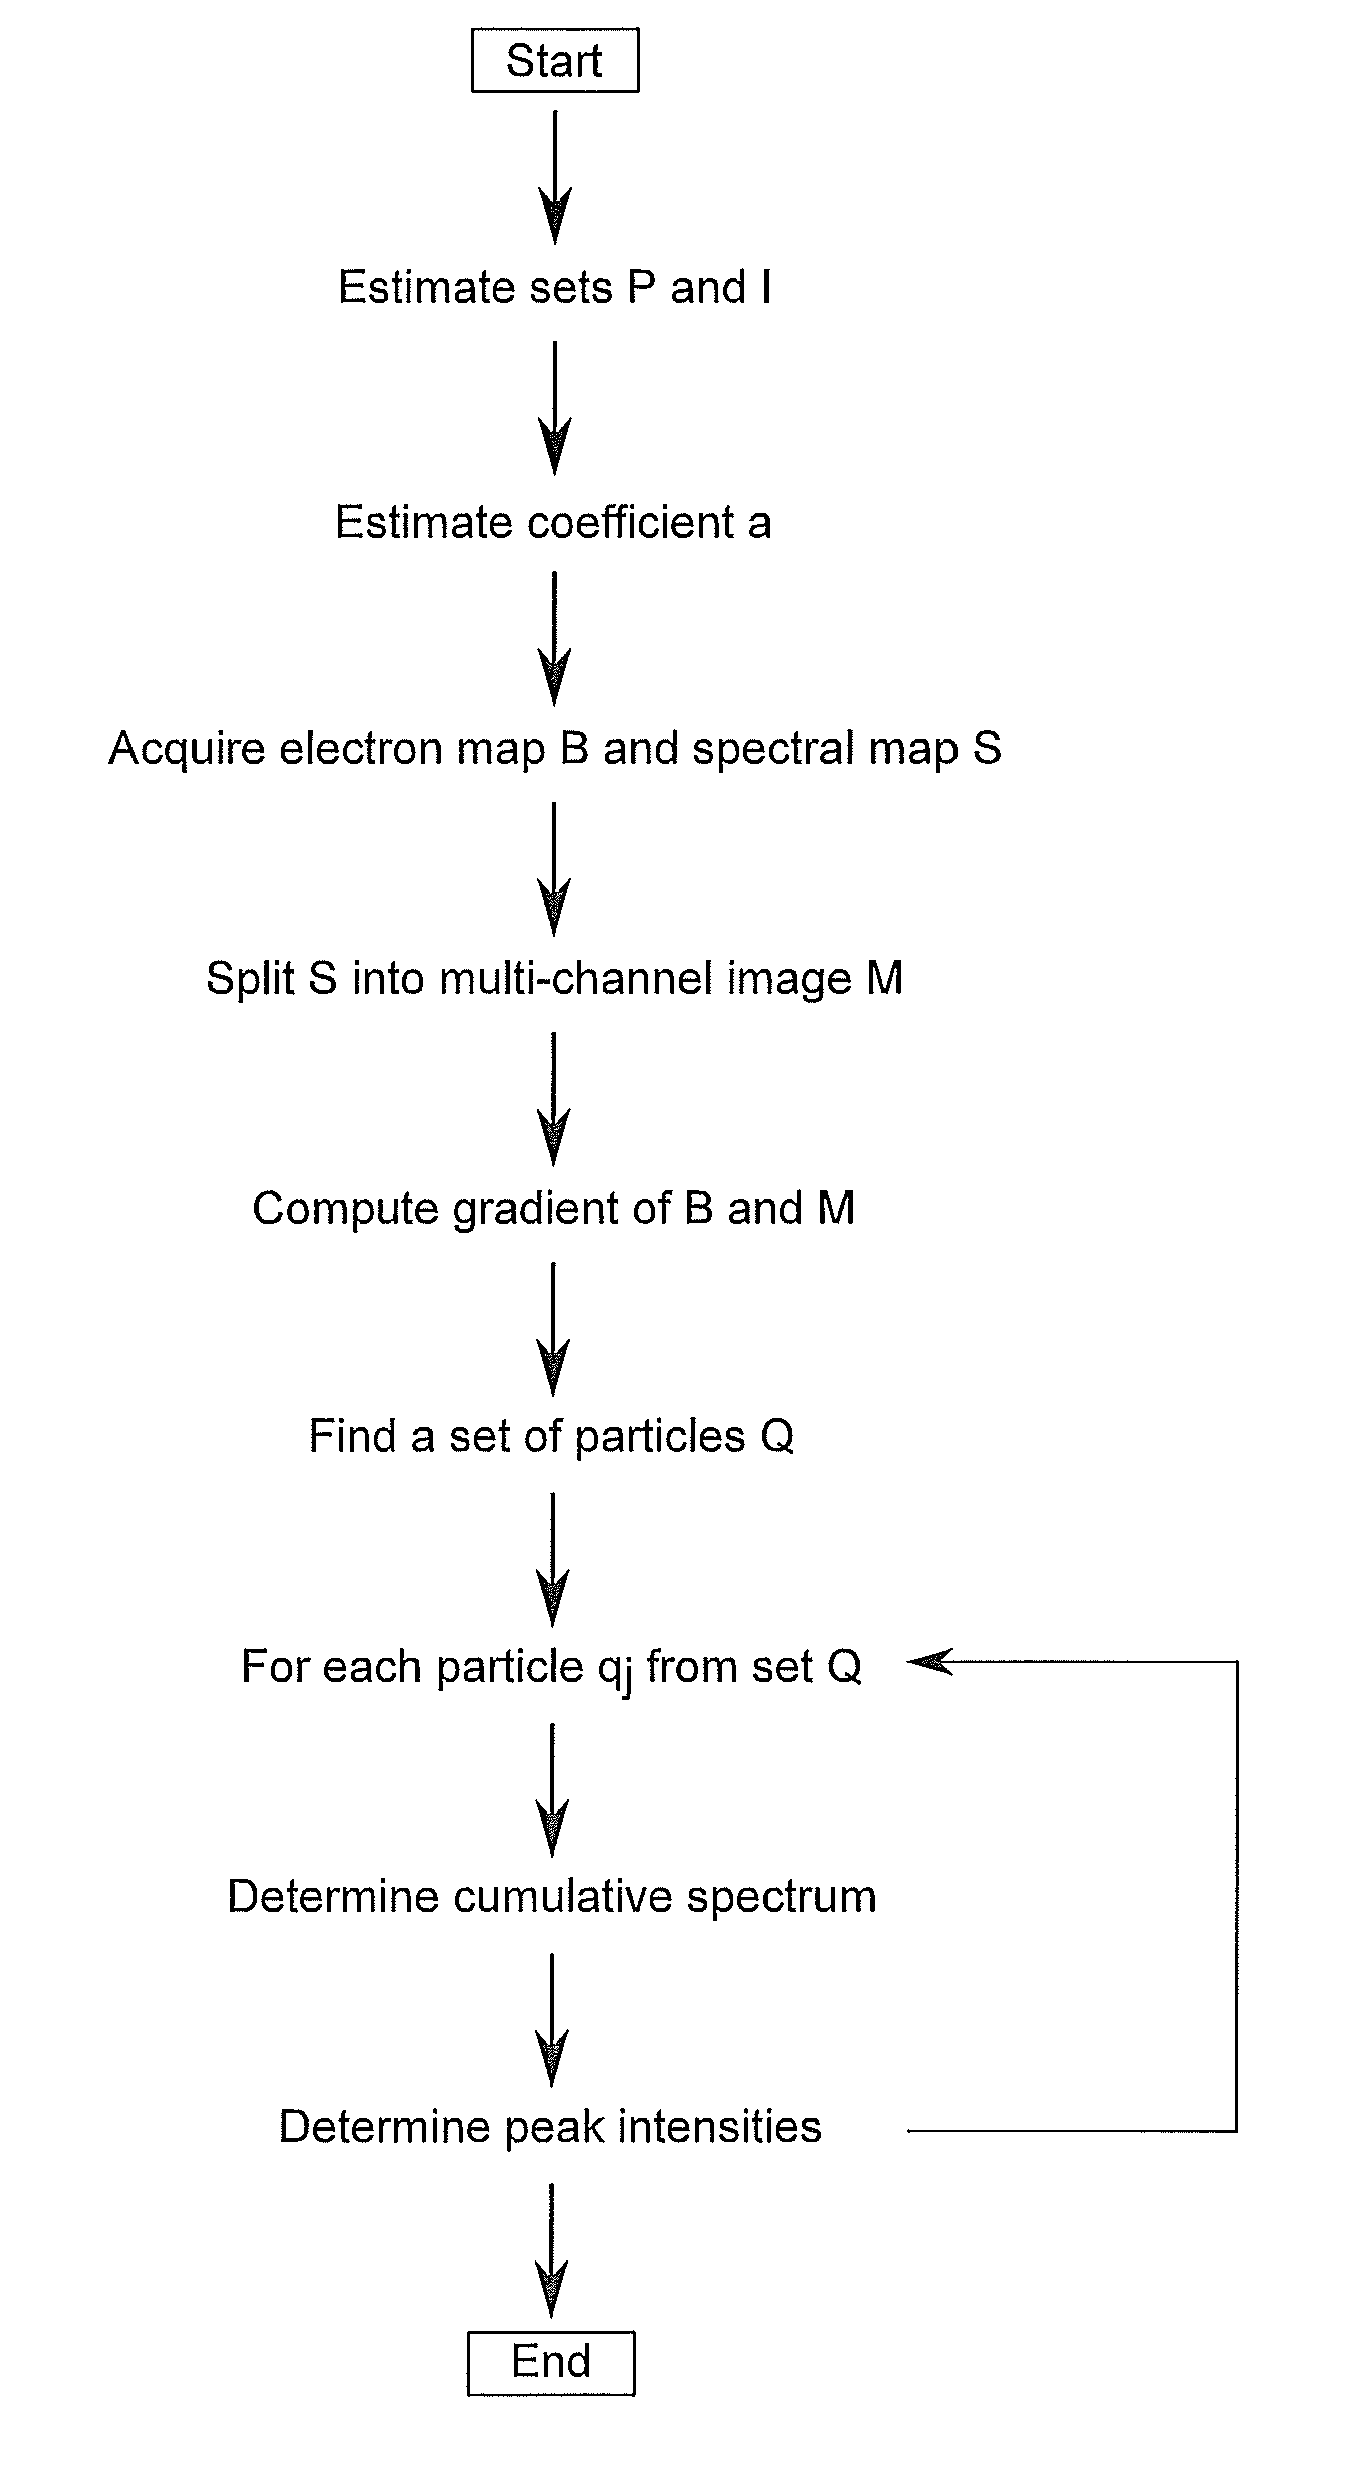
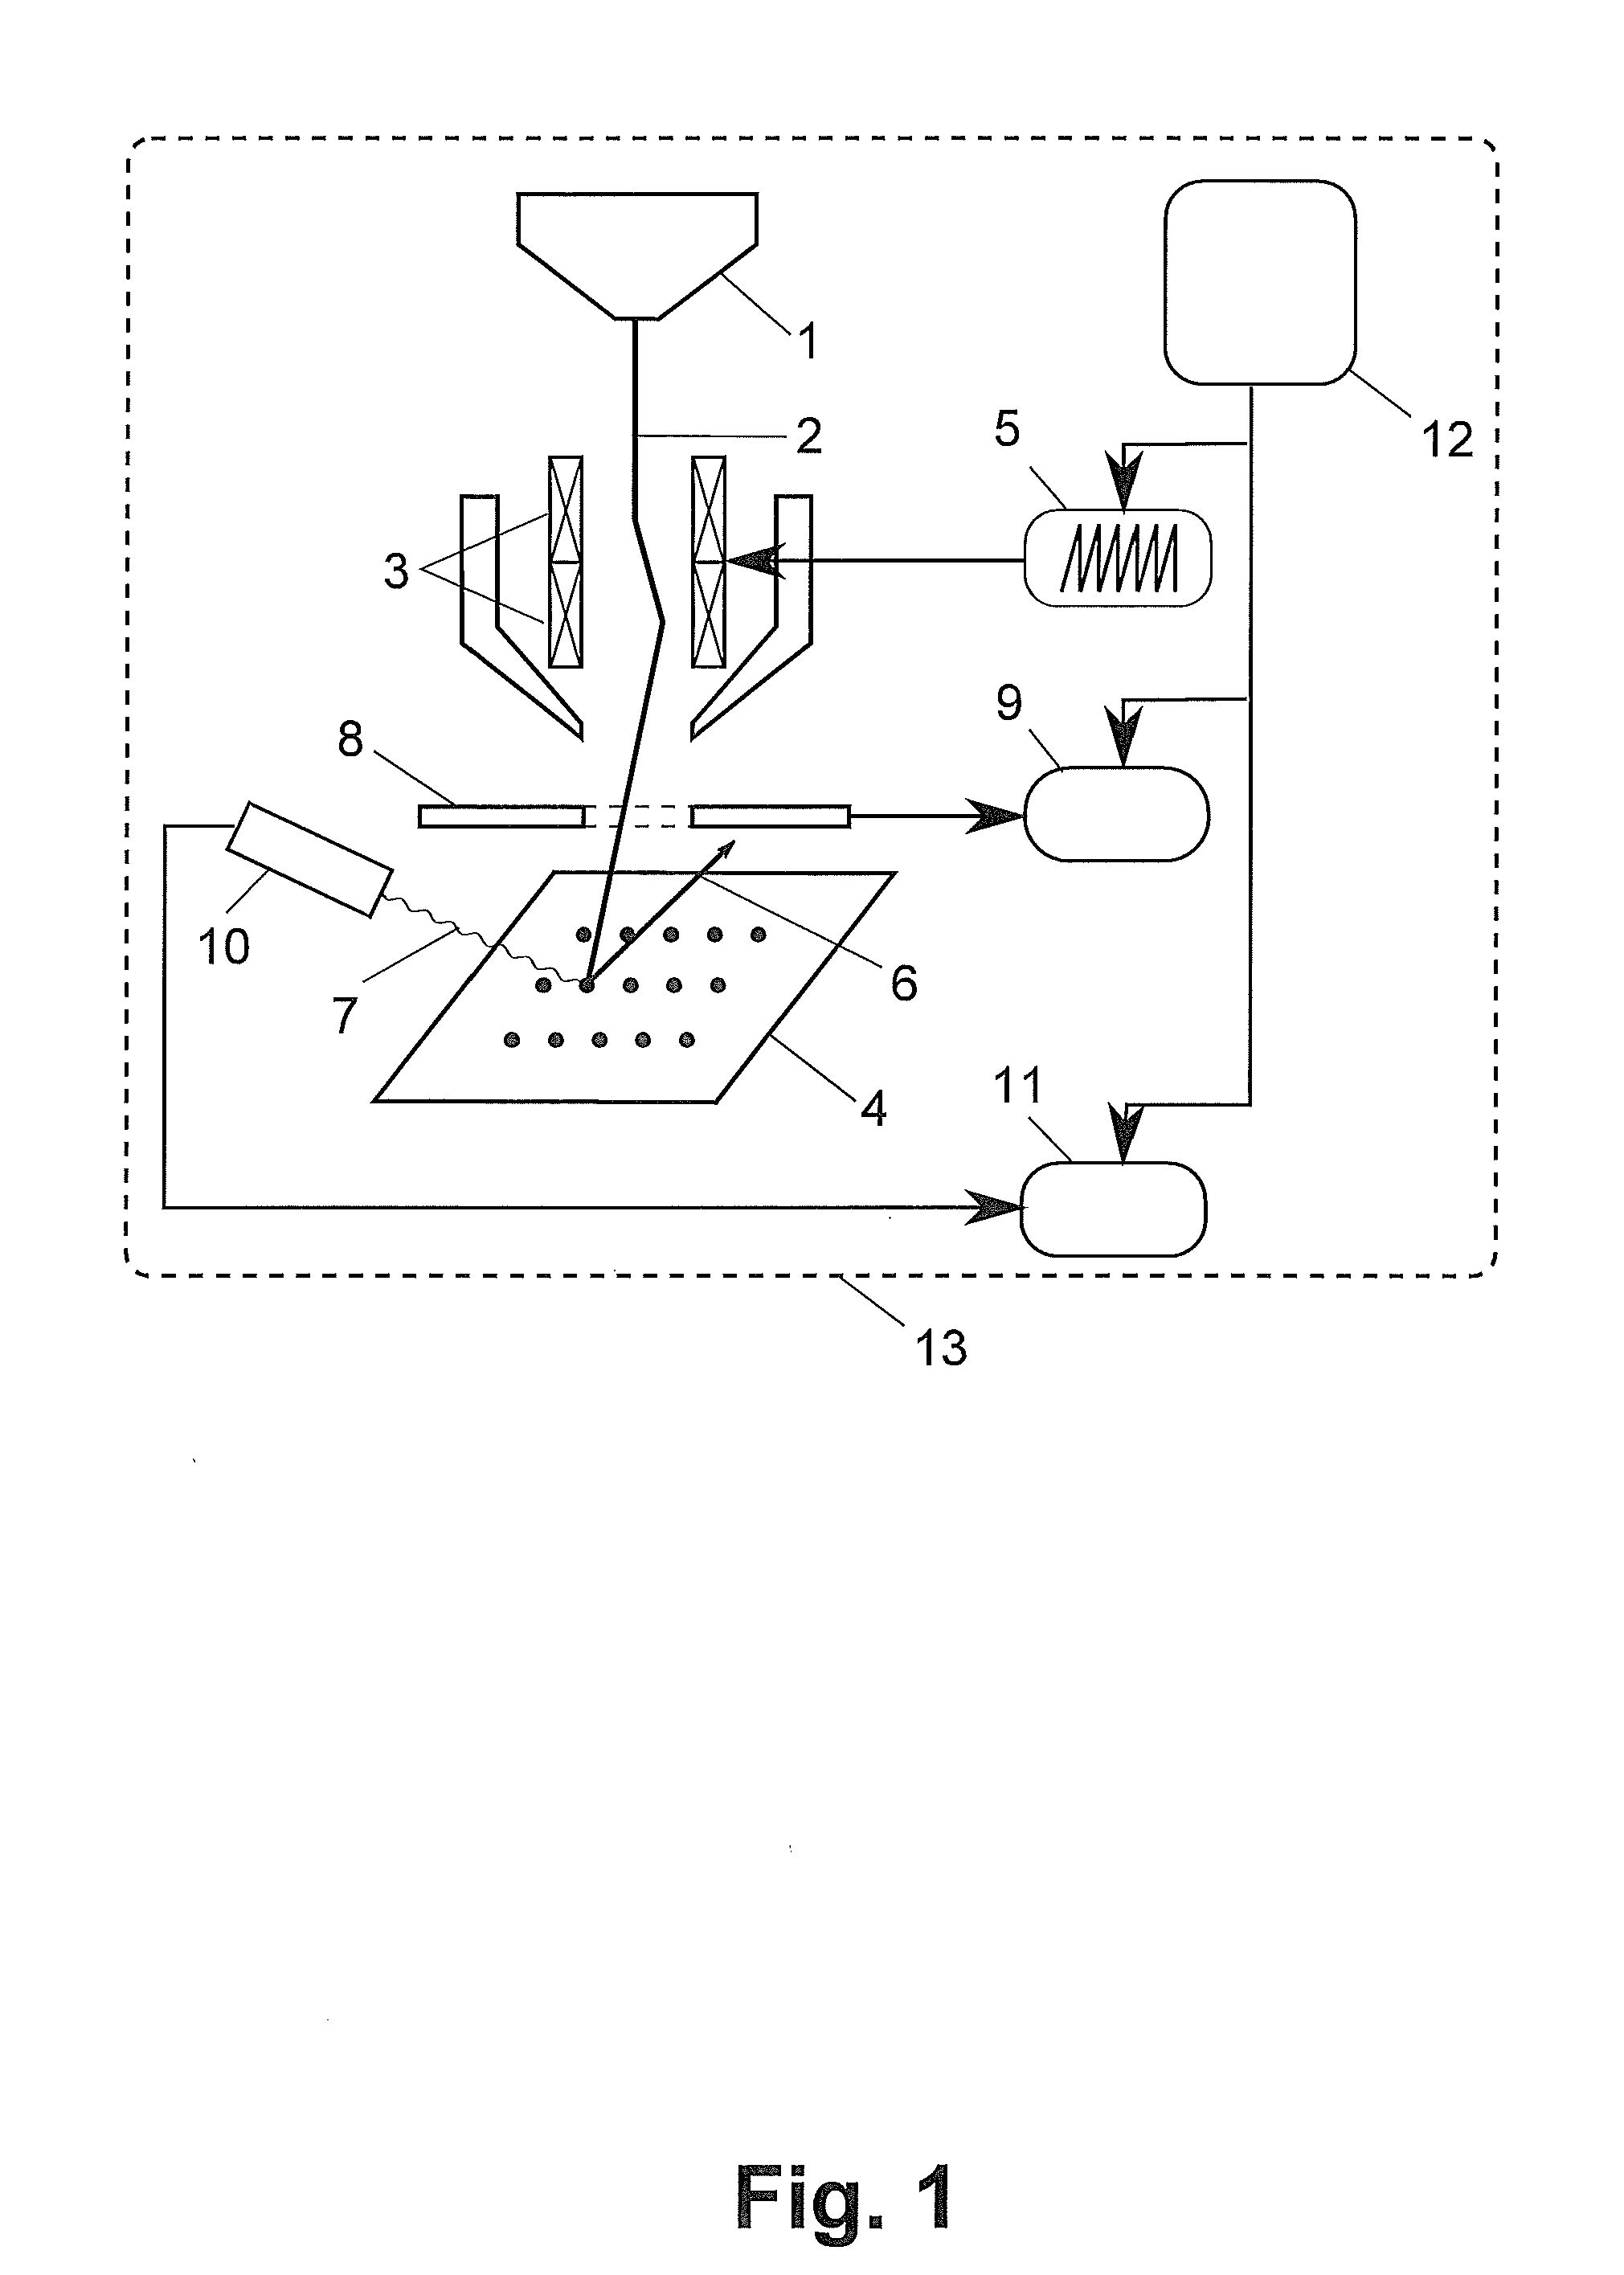
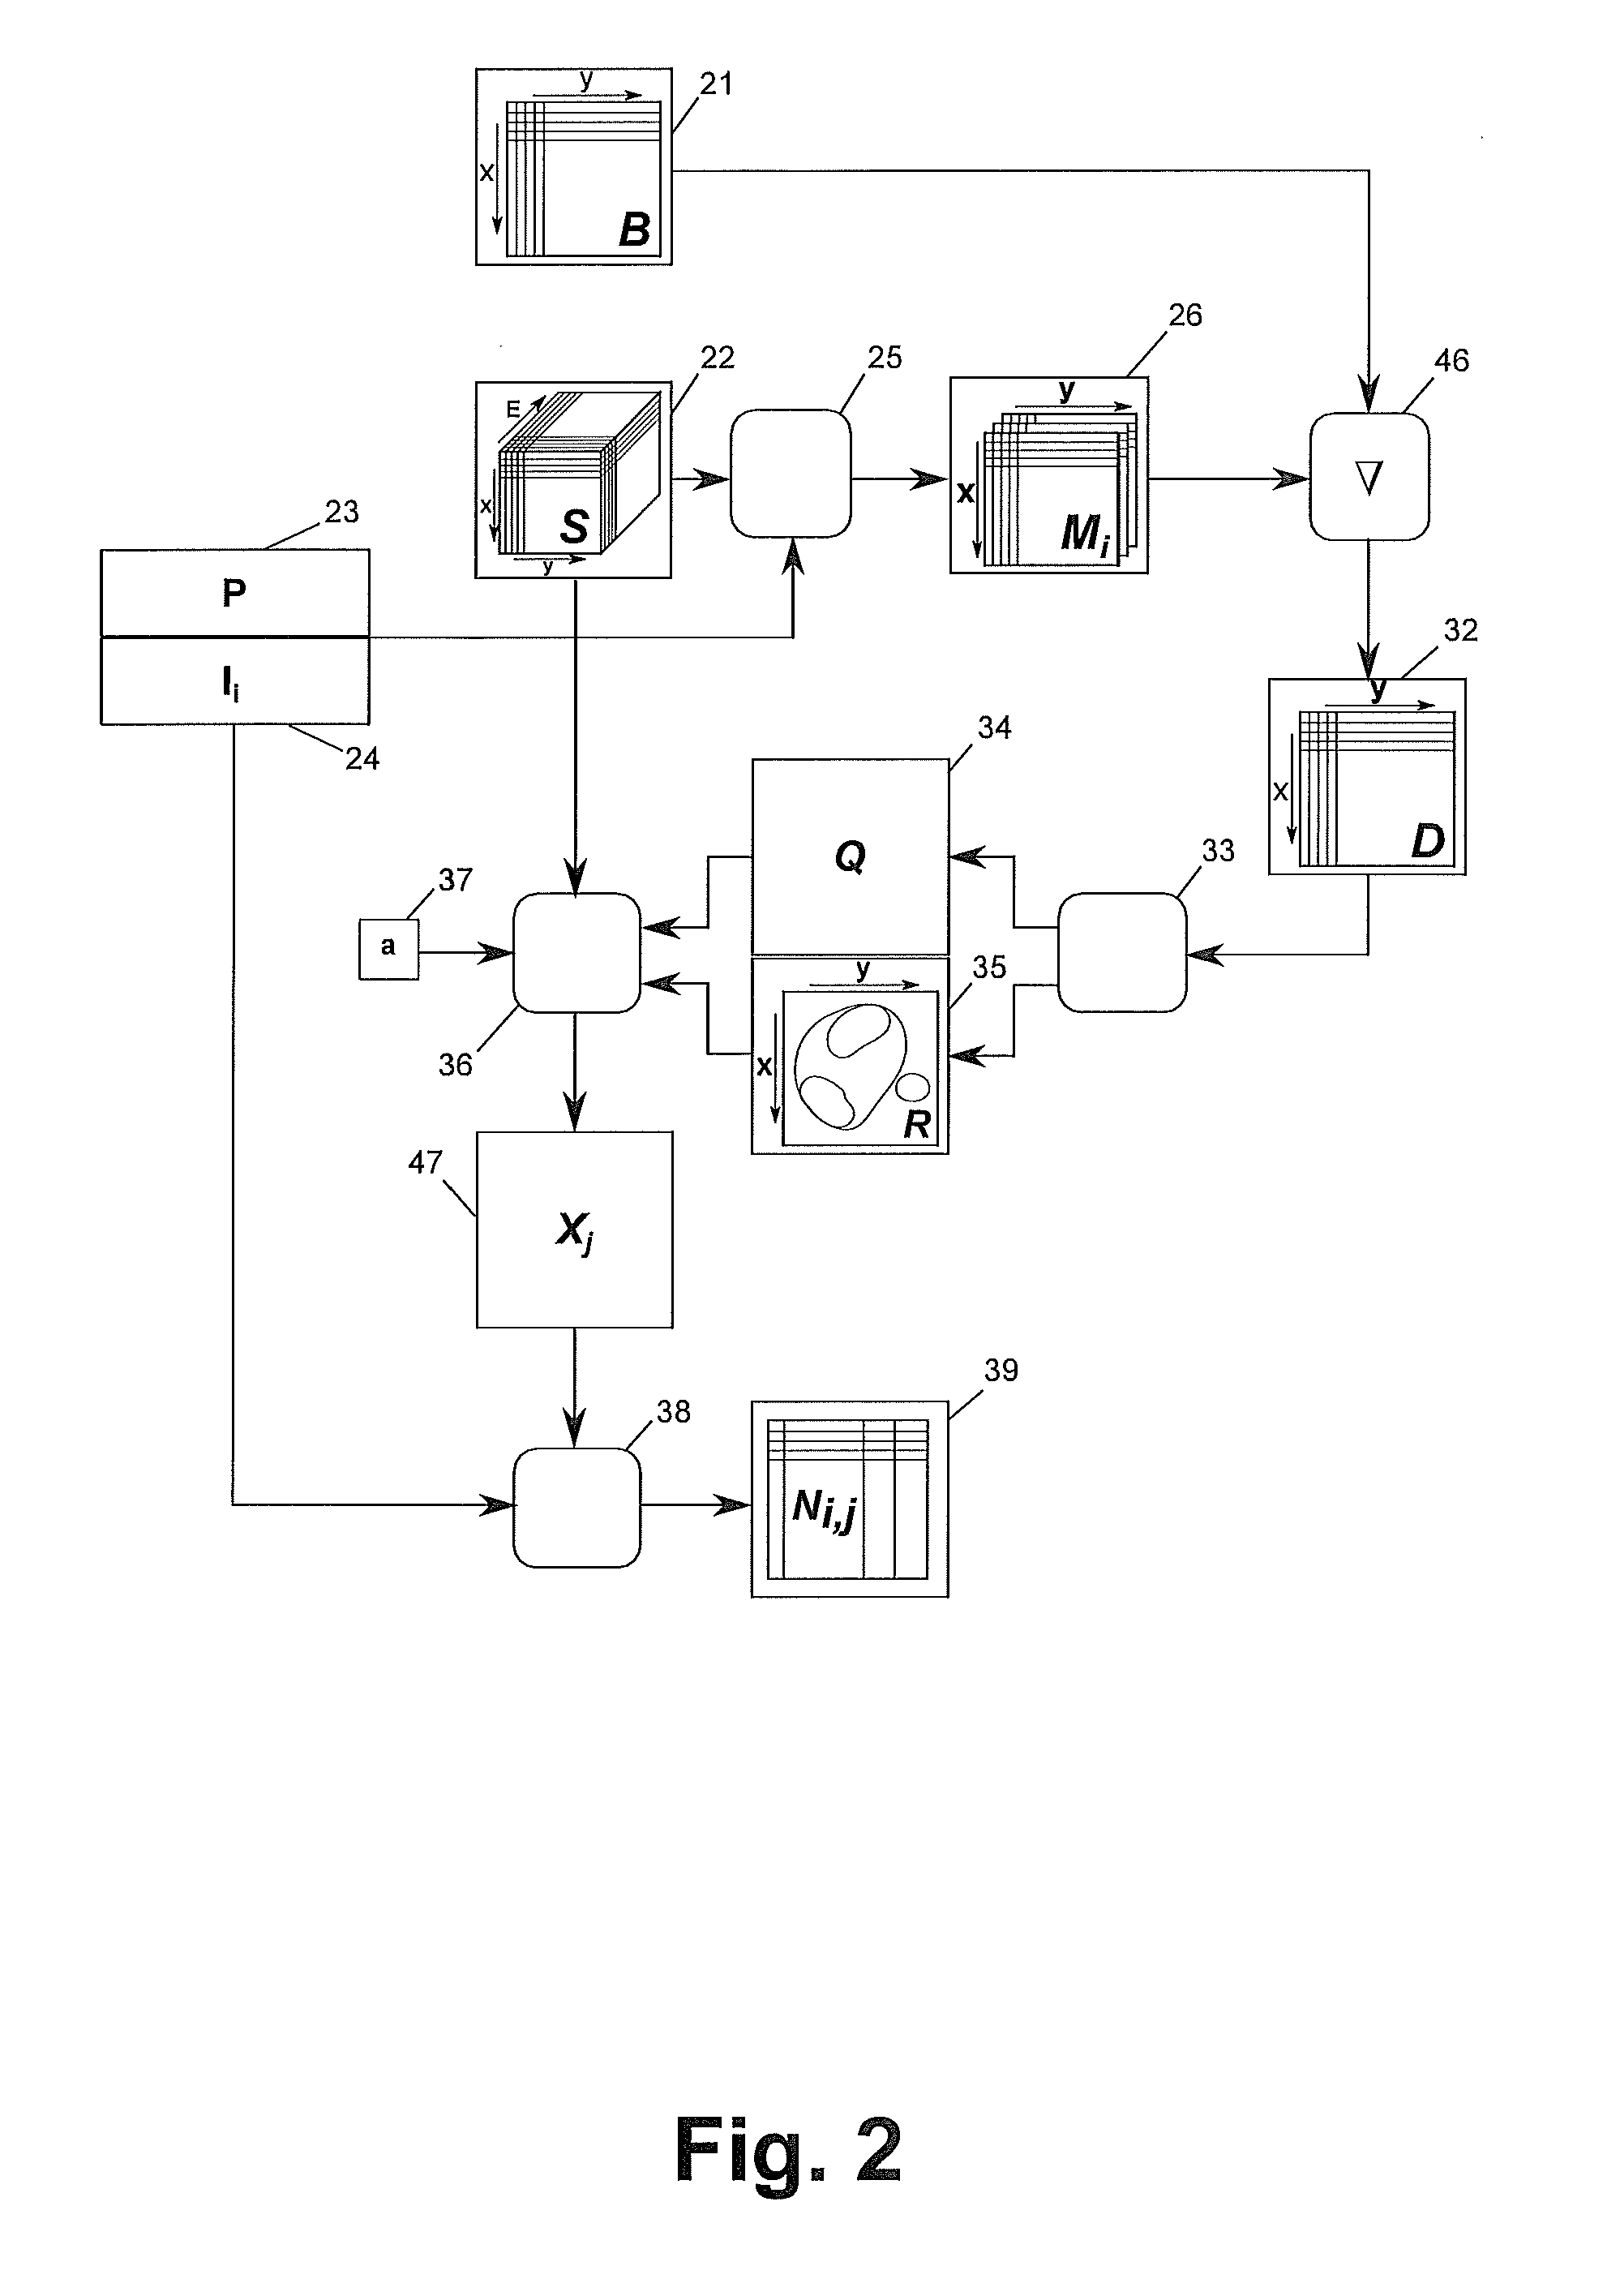
[0034]A preferred embodiment of the work-flow of a method of material analysis by a focused electron beam in a scanning electron microscope is depicted in FIG. 5. The method is based on the well-known procedure where at first an expert estimate is used to specify an adequately large set P of chemical elements that might occur in the assayed sample and, for each element pi from the set P, an interval Ii of the energies of the X-ray photons is determined corresponding to one emission line of the element. Next, the focused electron beam is consecutively deflected to points on the assayed sample and, at the points, the intensity of the back-scattered electrons is established in order to create an electron map B and a histogram of the energies of the X-ray radiation emitted at the point is established in order to create a spectral map S. In the new method of the preferred embodiment, an X-ray map Mi is created for each element pi from the set P, where the values Mi(x, y) stored in the ma...


PUM

PropertyMeasurementUnit
electron beamaaaaaaaaaa
Miaaaaaaaaaa
scanning electron microscopeaaaaaaaaaa

Abstract

A material analysis method by a focused electron beam and an equipment for performing such an analysis where an electron map B is created describing the intensity of emitted back-scattered electrons at various points on a sample, and a spectral map S is created describing the intensity of emitted X-rays at points on the sample depending on the radiation energy. For selected chemical elements, X-ray maps Mi are created representing the intensity of X-rays characteristic for such elements. The X-ray maps Mi and the electron map B are converted into differential X-ray maps Di, which are subsequently merged into a final differential X-ray map D. The final differential X-ray map D is then used to search particles. Subsequently, a cumulative X-ray spectrum Xj is calculated for each particle and subsequently the classification of particles based on the peak intensities and the intensity of back-scattered electron is performed.

Description

FIELD OF INVENTION[0001]The present invention relates to a method and apparatus for material analysis by a focused electron beam using characteristic X-rays and back-scattered electrons.[0002]The proposed solution facilitates the identification and analysis of non-homogeneous materials. The term “particles” refers to the continuous spatially delimited areas on a sample surface, which in terms of the detecting abilities of the equipment seem homogeneous. “Morphological analysis of particles” refers to the determination of their morphological properties, such as shape or area. “Qualitative and quantitative spectroscopic analysis” are analytical chemistry methods which enable one to establish the presence of chemical elements contained in the assayed substance and their percentages therein, based on examining characteristic X-rays. The presented method is especially suitable in the analysis of the relationships between the individual types of materials contained in the examined sample....

Claims


Application Information

Patent Timeline
Patent Type & Authority Applications(United States)
IPC IPC(8): G06F19/00H01J37/29G01N23/22G01N23/2251G01N23/2252
CPCH01J37/222H01J37/244H01J37/28H01J2237/2442G01N23/225H01J2237/24585G01N23/2208G01N2223/402G01N2223/616H01J2237/24475G01N23/2206
Inventor MOTL, DAVIDFILIP, VOJTECH
Owner TESCAN
Why Eureka
Try Eureka