Method for breast cancer recurrence prediction under endocrine treatment

a breast cancer and endocrine treatment technology, applied in the field of breast cancer recurrence prediction under endocrine treatment, can solve the problems of high risk score, severe impairing patient quality of life, and inability to show significant benefit of adding cytotoxic agents alone against tamoxifen plus chemotherapy,

Inactive Publication Date: 2013-03-14
SIVIDON DIAGNOSTICS
View PDF6 Cites 11 Cited by
  • Summary
  • Abstract
  • Description
  • Claims
  • Application Information

AI Technical Summary

Benefits of technology

[0059]Using the method of the invention before a patient receives endocrine therapy allows a prediction of the efficacy of endocrine therapy.
[0091]The methods of the present invention have the advantage of providing a reliable prediction of an outcome of disease based on the use of only a small number of genes. The methods of the present invention have been found to be especially suited for analyzing the response to endocrine treatment, e.g. by tamoxifen, of patients with tumors classified as ESR1 positive and ERBB2 negative.

Problems solved by technology

However, the IBCSG IX study comparing tamoxifen alone against tamoxifen plus chemotherapy failed to show any significant benefit for the addition of cytotoxic agents.
Yet, most if not all of the different drug treatments have numerous potential adverse effects which can severely impair patients' quality of life (Shapiro and Recht, 2001; Ganz et al., 2002).
Since the benefit of chemotherapy is relatively large in HER2 / neu positive and tumors characterized by absence of HER2 / neu and estrogen receptor expression (basal type), compared to HER2 / neu negative and estrogen receptor positive tumors (luminal type), the most challenging treatment decision concerns luminal tumors for which classical clinical factors like grading, tumor size or lymph node involvement do not provide a clear answer to the question whether to use chemotherapy or not.
Uncertainty about the usefulness of chemotherapy arises in patients with HER2 negative and ER positive disease.
However, the current tools suffer from a lack of clinical validity and utility in the most important clinical risk group, i.e. those breast cancer patients of intermediate risk of recurrence based on standard clinical parameter.

Method used


Image

  • Method for breast cancer recurrence prediction under endocrine treatment
  • Method for breast cancer recurrence prediction under endocrine treatment
  • Method for breast cancer recurrence prediction under endocrine treatment

Examples


example algorithm t5

[0105]Algorithm T5 is a committee of four members where each member is a linear combination of two genes. The mathematical formulas for T5 are shown below; the notation is the same as for T1. T5 can be calculated from gene expression data only.

riskMember1=0.434039[0.301…0.567]*(0.939*BIRC5-3.831)-0.491845[-0.714…-0.270]*(0.707*RBBP8-0.934)riskMember2=0.488785[0.302…0.675]*(0.794*UBE2C-1.416)-0.374702[-0.570…-0.179]*(0.814*IL6ST-5.034)riskMember3=-0.39169[-0.541…-0.242]*(0.674*AZGP1-0.777)+0.44229[0.256…0.628]*(0.891*DHCR7-4.378)riskMember4=-0.377752[-0.543…-0.212]* (0.485*MGP+4.330)-0.177669[-0.267…-0.088]*(0.826*STC2-3.630)risk=riskMember1+riskMember2+riskMember3+riskMember4

[0106]Coefficients on the left of each line were calculated as COX proportional hazards regression coefficients, the numbers in squared brackets denote 95% confidence bounds for these coefficients. In other words, instead of multiplying the term (0.939*BIRC5−3.831) with 0.434039, it may be multiplied with any co...

example algorithm t1

[0113]Algorithm T1 is a committee of three members where each member is a linear combination of up to four variables. In general variables may be gene expressions or clinical variables. In T1 the only non-gene variable is the nodal status coded 0, if patient is lymph-node negative and 1, if patient is lymph-node-positive. The mathematical formulas for T1 are shown below.

riskMember1=+0.193935[0.108…0.280]*(0.792*PVALB-2.189)-0.240252[-0.400…-0.080]*(0.859*CDH1-2.900)-0.270069[-0.385…-0.155]*(0.821*STC2-3.529)+1.2053[0.534…1.877]*nodalStatusriskMember2=-0.25051[-0.437…-0.064]*(0.558*CXCL12+0.324)-0.421992[-0.687…-0.157]*(0.715*RBBP8-1.063)+0.148497[0.029…0.268]*(1.823*NMU-12.563)+0.293563[0.108…0.479]*(0.989*BIRC5-4.536)riskMember3=+0.308391[0.074…0.543]*(0.812*AURKA-2.656)-0.225358[-0.395…-0.055]*(0.637*PTGER3+0.492)-0.116312[-0.202…-0.031]*(0.724*PIP+0.985)risk=+riskMember1+riskMember2+riskMember3

[0114]Coefficients on the left of each line were calculated as COX proportional hazards...

example algorithm t4

[0115]Algorithm T4 is a linear combination of motifs. The top 10 genes of several analyses of Affymetrix datasets and PCR data were clustered to motifs. Genes not belonging to a cluster were used as single gene-motifs. COX proportional hazards regression coefficients were found in a multivariate analysis.

[0116]In general motifs may be single gene expressions or mean gene expressions of correlated genes. The mathematical formulas for T4 are shown below.

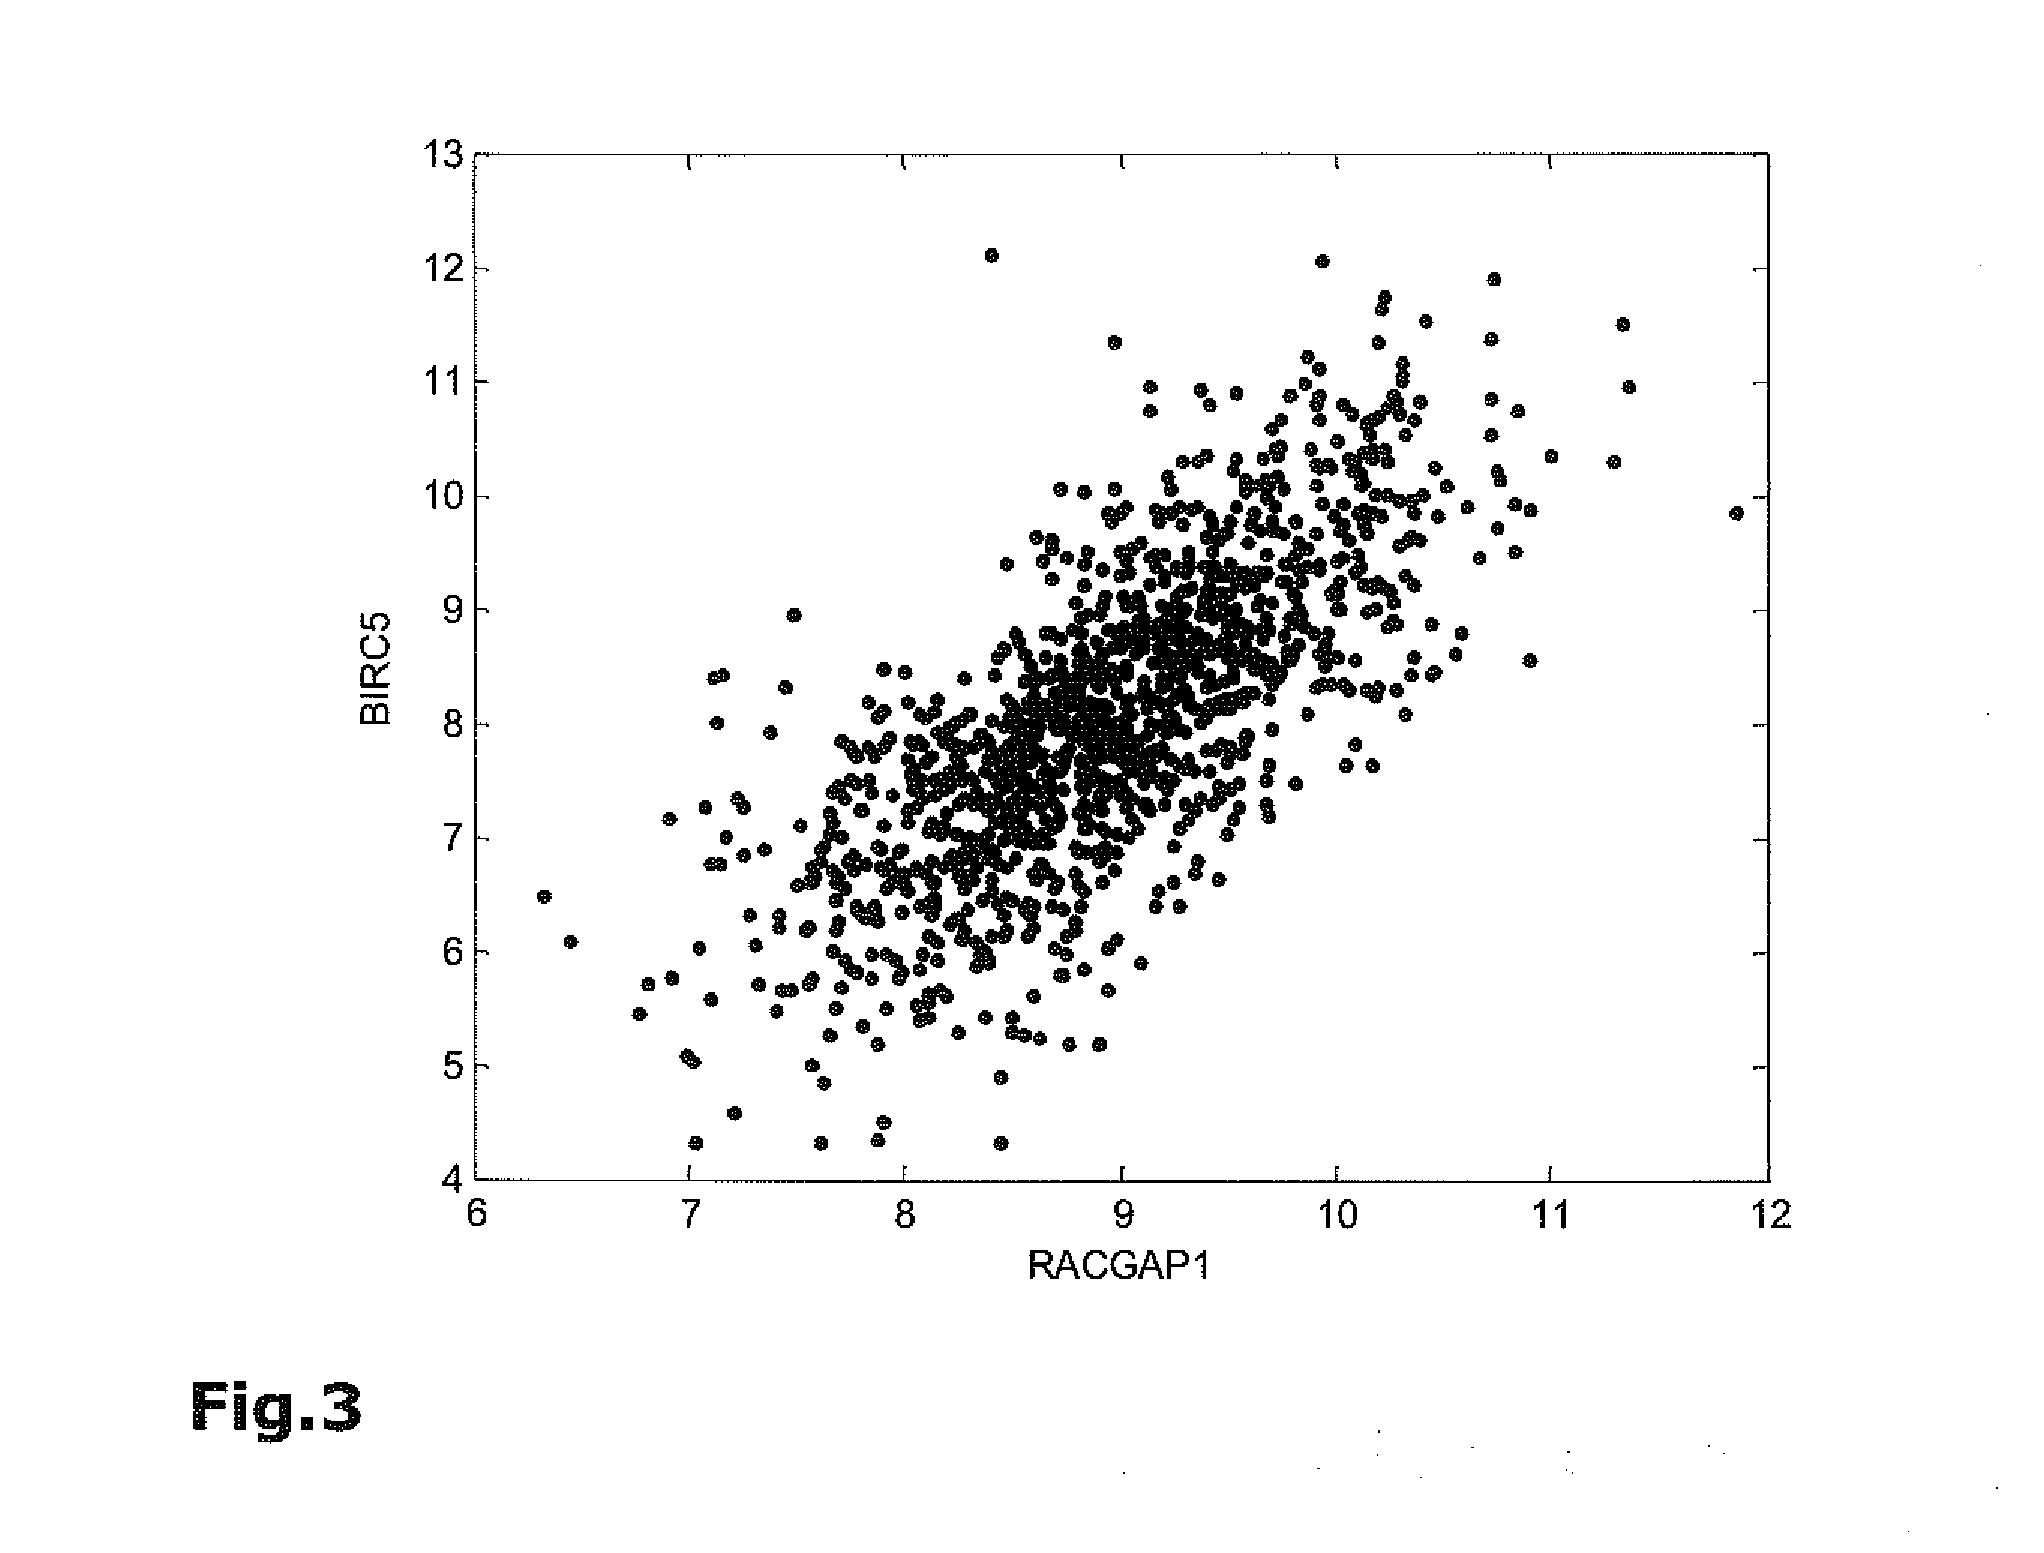
prolif=((0.84 [0.697 . . . 0.977]*RACGAP1−2.174)+(0.85 [0.713 . . . 0.988]*DHCR7−3.808)+(0.94 [0.786 . . . 1.089]*BIRC5−3.734)) / 3

motiv2=((0.83 [0.693 . . . 0.96]*IL6ST−5.295)+(1.11 [0.930 . . . 1.288]*ABAT−7.019)+(0.84 [0.701 . . . 0.972]*STC2−3.857)) / 3

ptger3=(PTGER3*0.57 [0.475 . . . 0.659]+1.436)

cxcl12=(CXCL12*0.53 [0.446 . . . 0.618]−0.847)

pvalb=(PVALB*0.67 [0.558 . . . 0.774]−0.466)

[0117]Factors and offsets for each gene denote a platform transfer from PCR to Affymetrix: The variables RACGAP1, DHCR7, . . . denote PCR-based expressi...


PUM

PropertyMeasurementUnit
sizeaaaaaaaaaa
weightaaaaaaaaaa
imaging methodsaaaaaaaaaa

Abstract

The present invention relates to methods, kits and systems for the prognosis of the disease outcome of breast cancer, said method comprising:(a) determining in a tumor sample from said patient the RNA expression levels of at least 2 of the following 9 genes: UBE2C, BIRC5, RACGAP1, DHCR7, STC2, AZGP1, RBBP8, IL6ST, and MGP(b) mathematically combining expression level values for the genes of the said set which values were determined in the tumor sample to yield a combined score, wherein said combined score is indicative of a prognosis of said patient; and kits and systems for performing said method.

Description

TECHNICAL FIELD[0001]The present invention relates to methods, kits and systems for the prognosis of the disease outcome of breast cancer. More specific, the present invention relates to the prognosis of breast cancer based on measurements of the expression levels of marker genes in tumor samples of breast cancer patients.BACKGROUND OF THE INVENTION[0002]Breast cancer is one of the leading causes of cancer death in women in western countries. More specifically breast cancer claims the lives of approximately 40,000 women and is diagnosed in approximately 200,000 women annually in the United States alone. Over the last few decades, adjuvant systemic therapy has led to markedly improved survival in early breast cancer. This clinical experience has led to consensus recommendations offering adjuvant systemic therapy for the vast majority of breast cancer patients (EBCAG). In breast cancer a multitude of treatment options are available which can be applied in addition to the routinely per...

Claims


Application Information

Patent Timeline
Patent Type & Authority Applications(United States)
IPC IPC(8): C40B30/04C40B40/06C12Q1/68
CPCC12Q1/6886C12Q2600/158C12Q2600/118G01N33/57415
Inventor DARTMANN, MAREIKEFEDER, INKE SABINEGEHRMANN, MATHIASHENNIG, GUIDOWEBER, KARSTENVON TORNE, CHRISTIANKRONENWETT, RALFPETRY, CHRISTOPH
Owner SIVIDON DIAGNOSTICS
Why Eureka
Try Eureka