Bach2 repression in cells

a cell and bach2 technology, applied in the field of cell proliferation status diagnosis, can solve the problem that no definitive evidence of suppressive activity has been obtained, and achieve the effect of reducing the level of bach2

Active Publication Date: 2013-12-19
UNIV LIBRE DE BRUXELIES
View PDF1 Cites 2 Cited by
  • Summary
  • Abstract
  • Description
  • Claims
  • Application Information

AI Technical Summary

Benefits of technology

[0044]Preferably, in the present invention, a reduced BACH 2 level is the deletion of one copy (not of both copies) of BACH2 gene in a cell, and / or the deletion of at least 1, 2, 3 exon in one (or, less preferably, in the two) copy of the BACH2 gene, and / or a mutation in one (or, less preferably, in the two) copy BACH2 gene, possibly resulting into a defect in RNA splicing.
[0045]Possibly, a reduced BACH2 level is (further) measured by a reduction of BACH2 mRNA level in the (enriched) cells present in a biological sample obtained from the patient and / or by immuno-histochemistry of BACH2 protein (especially if the sample is obtained from the lymph node or from a sarcoma or (less preferably) from an solid tumor (and / or from an epithelial cancer) of the patient).

Problems solved by technology

However, with the exception of the TNFAIP3 (A20) gene, located at band 6q23 and recently recognized as a tumour suppressor gene of B-lineage lymphomas subsets, no definitive evidence of suppressive activity has been obtained for other 6q gene-locus candidates in separate entities.

Method used


Image

  • Bach2 repression in cells
  • Bach2 repression in cells
  • Bach2 repression in cells

Examples


example 1

[0075]Gene Expression Profile Focused on the 6q13-22.1 Minimal Deleted Region in CD3-CD4+ T Cells from 3 L-HES Patients

[0076]A commonly deleted region located between bands q13 and q22.1 of the long arm of chromosome 6 was previously identified in CD3-CD4+ T cells from 2 L-HES patients (P1 and P2). To complete the genomic characterization of the CD3-CD4+ T cell clone of a third patient (P3), FISH experiments were performed using a 6g15-specific BAC probe. A complete 6q loss was identified in 25% of nuclei of uncultured CD3-CD4+ T cells from patient P3 and found associated with an isochromosome 6p (i(6) (p10;p10)) as confirmed by CGH.

[0077]By comparing the gene expression profiles of CD3-CD4+ T cell clones from 3 L-HES patients with CD3+CD4+ T cells from healthy controls, the inventors have detected 13 repressed genes within the commonly deleted region 6g13-q22.1.

[0078]No enhanced expression was found even in the totality of the long arm of chromosome 6, in contrast to several over-e...

example 2

[0079]Gene Expression Analysis of the 6q13-22.1 Region Extended to a Cohort of 5 Patients L-HES

[0080]The validation of the microarray data was performed for the 13 mentioned genes by real-time quantitative RT-PCR on purified T cells from an enlarged patient cohort of 5 L-HES patients and 5 healthy controls (Table 1).

TABLE 1AverageFoldGeneDCt 5RankAverageRankAverageChangep-valueSymbolCytobandPatients5 PatientsDCt 5 Controls5 Controls2{circumflex over ( )}(−DDCt) 5P vs 5C5P vs 5C5P vs 5CNM_001402.5EEF1A16q13-14−6.64[−9.73:−5.55]−9.06[−9.31:8.87]0.19−5.380.0155NM_00100409.1SENP66q14.11.73[0.91:2.59]−0.09[−0.48:0.38]0.28−3.540.0007NM_004242.2HMGN36q14.11.92[−0.54:4.08]−0.50[−0.72:−0.3]0.19−5.340.0143NM_017633.2FAM46A6q14.15.63[1.88:7.95]2.67[2.33:2.86]0.13−7.730.0192NM_002526.2NT5E6q14.39.38[6.65:11.19]4.94[3.12:6.25]0.05−21.740.0012NM_021244.4RRAGD6q155.98[3.14:7.19]2.53[1.98:2.78]0.09−10.970.0021NM_021813.2BACH26q154.73[2.41:6.83]1.22[0.64:1.66]0.09−11.420.0019NM_01591.1SFRS186q16.3−0...

example 3

[0084]Gene expression of the 6q14.1-22.1 Region during P1 Clinical Evolution

[0085]The chronological profiling of CD3-CD4+ T-cells from P1 was previously described starting at the chronic indolent clinical phase and continuing to the full blown T lymphoma stage.

[0086]The inventors measured over time the progressive changes in expression of the genes contained within the 6q14.1-22.1 region during the disease to understand the transforming steps.

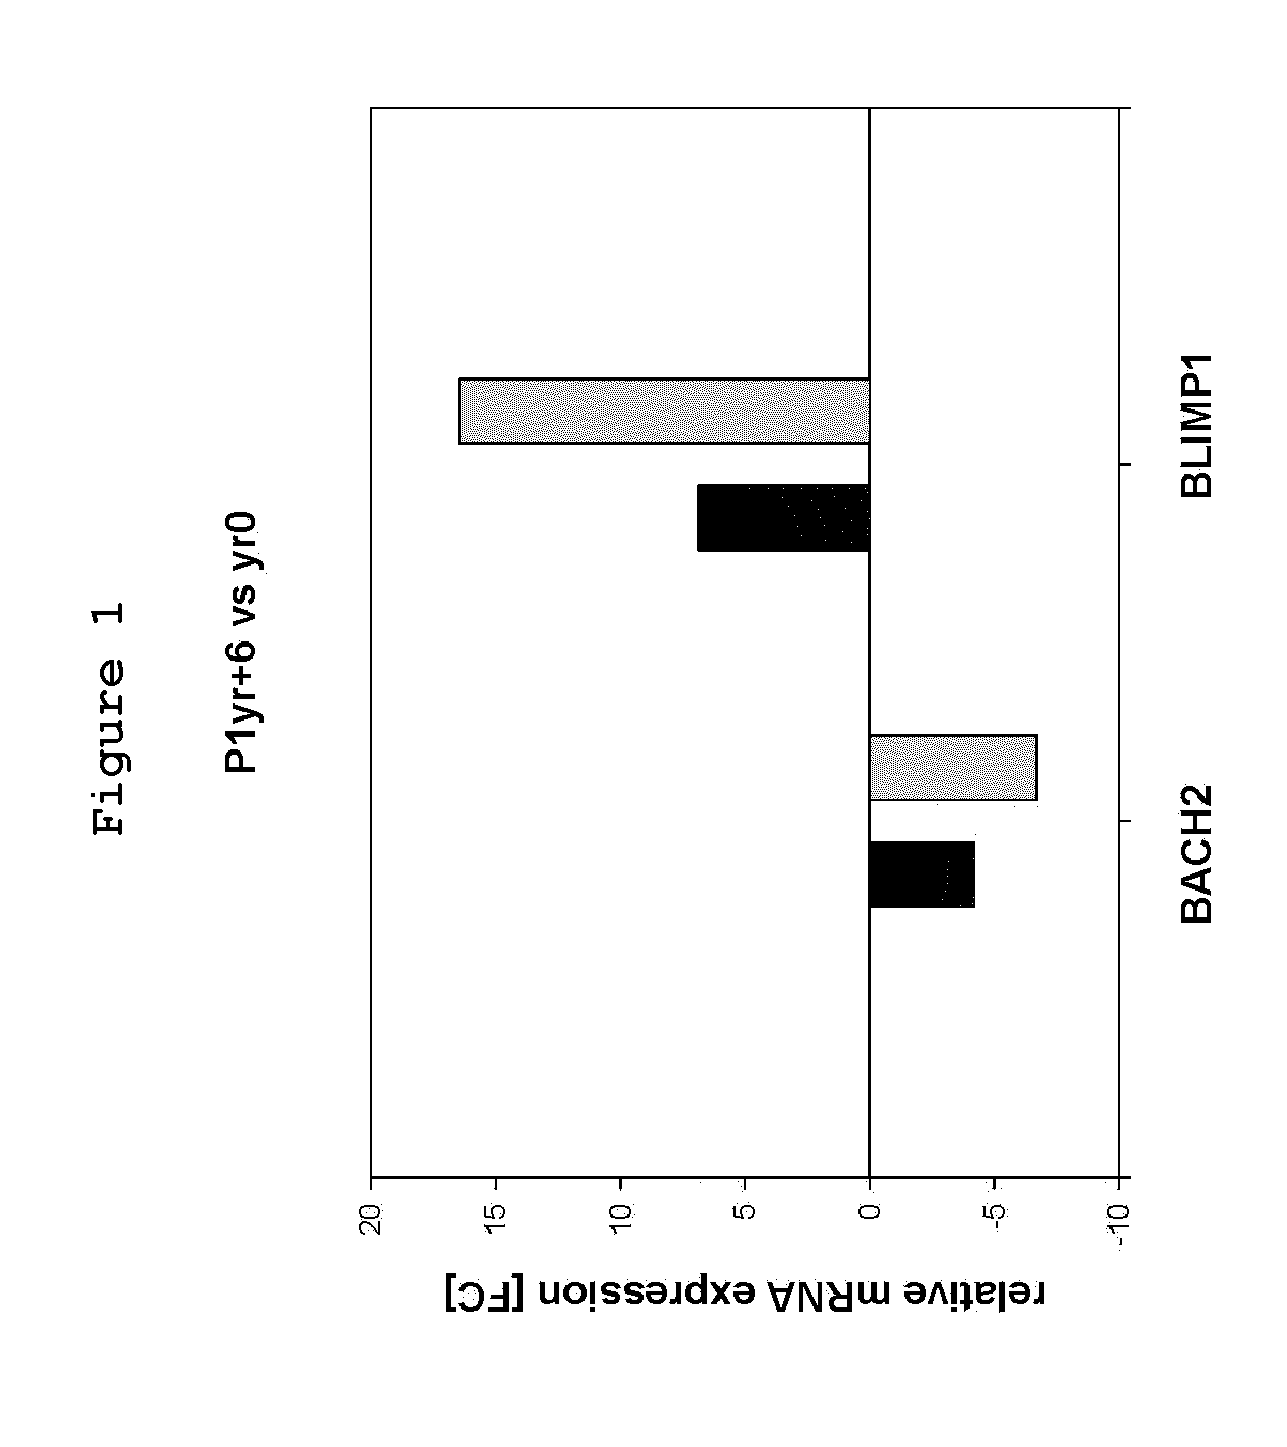
[0087]Of the 11 repressed genes, only BACH2's transcript level was shown significantly and progressively over-repressed when tested by microarray and by real-time quantitative RT-PCR (FIG. 1). In particular, a -1.7 fold additional decrease in BACH2 mRNA level was confirmed between yr 0 and yr+6 corresponding, respectively, to samples taken during the chronic and acute phases of the disease (FIG. 1).

[0088]Of interest, at that advanced stage, BACH2 over-repression was associated with a significant 2.4 fold over-expression of BLIMPI mRNA (microarr...


PUM

PropertyMeasurementUnit
concentrationaaaaaaaaaa
threshold ofaaaaaaaaaa
Fluorescenceaaaaaaaaaa

Abstract

A method for measuring the proliferation status of a cell present in a biological sample, comprising the step of measuring in the said cell the loss of BACH2 by Fluorescence after In Situ Hybridization (FISH) analysis and mRNA quantification or by Comparative Genomic Hybridization (CGH) and corresponding kit and applications.

Description

FIELD OF THE INVENTION[0001]The present invention relates to the field of diagnostic of the proliferation status of a cell.BACKGROUND OF THE INVENTION AND STATE OF THE ART[0002]Tumour suppressor genes function by restraining cell cycle progression, maintaining genomic integrity or promoting apoptosis.[0003]Chromosomal imbalances are often observed in haematological malignancies and somatic deletions are believed to indicate the location of tumour suppressor genes whose alteration produces loss-of-function in a recessive (Knudson's model) or haploinsufficient (the inactivation of one allele is sufficient to change the phenotype of one cell) context.[0004]The inventors have previously described the occurrence and persistence of hemizigous 6q13-q22 deletions in abnormal CD3-CD4+ T cell clones from two patients suffering from the lymphocytic variant of the hypereosinophilic syndrome (L-HES) over a 6-year study period during which one patient developed a T-cell lymphoma (RAVOET, M. ET AL...

Claims


Application Information

Patent Timeline
Patent Type & Authority Applications(United States)
IPC IPC(8): C12Q1/68
CPCC12Q1/6886A61P35/00A61P37/08C12N15/113C12N2310/14C12Q1/6841C12Q2600/118C12Q2600/158
Inventor WILLARD-GALLO, KARENSIBILLE, CATHERINE
Owner UNIV LIBRE DE BRUXELIES
Why Eureka
Try Eureka