
System and method for spatiotemporally analyzed rapid assays

a rapid assay and spatiotemporal analysis technology, applied in the field of reliable, rapid, quantitative diagnostic test system, can solve the problems of inability to provide quantitative, significantly less reliable, and intermittent discoloration on the strip

Active Publication Date: 2014-03-06
MAMENTA EDWARD L
View PDF6 Cites 30 Cited by
  • Summary
  • Abstract
  • Description
  • Claims
  • Application Information

AI Technical Summary

Benefits of technology

The invention is about a method for accurately and quantitatively determining the amount of an analyte of interest in a fluid sample using a flow-induced assay. The method involves recording spatiotemporal measurements of the assay reaction and analyzing them to determine the amount of analyte present in the sample. The invention also includes devices made for this purpose and software for analyzing the spatiotemporal datasets. The technical effect of the invention is that it provides a reliable and quantitative method for measuring analytes in fluid samples using a flow-induced assay.

Problems solved by technology

This process typically creates in interim discoloration on the strip prior to the final viewed result.
However, the advantages of these devices are offset by the fact that they are considerably less reliable than alternative laboratory-based immunoassays, and generally unable to provide quantitative results.
Deviation from the defined assay conditions can result in erroneous test results.
In contrast to laboratory-based immunoassays, rapid assay devices are highly limited in their ability to deliver defined assay conditions, as these conditions are dictated by various flow dynamics that cannot be precisely replicated on each device.
While this approach allows the test band to be analyzed with greater objectivity and quantitation (compared with visual interpretation), it fails to address the underlying problem of variable flow dynamics that can non-specifically influence the intensity of test band formation.
This approach does incrementally improve reliability and quantitation; however, the results still remain far inferior to laboratory-based systems.
In addition, the control line approach requires considerably greater manufacturing effort compared to that of a standard rapid assay device and introduces additional variables that can compromise the interpretation of test results.

Method used


Image

  • System and method for spatiotemporally analyzed rapid assays
  • System and method for spatiotemporally analyzed rapid assays
  • System and method for spatiotemporally analyzed rapid assays

Examples


example 1

Preparation of a Vertically Oriented Immunochromatographic Assay Device for the Measurement of Aflatoxin Analyte

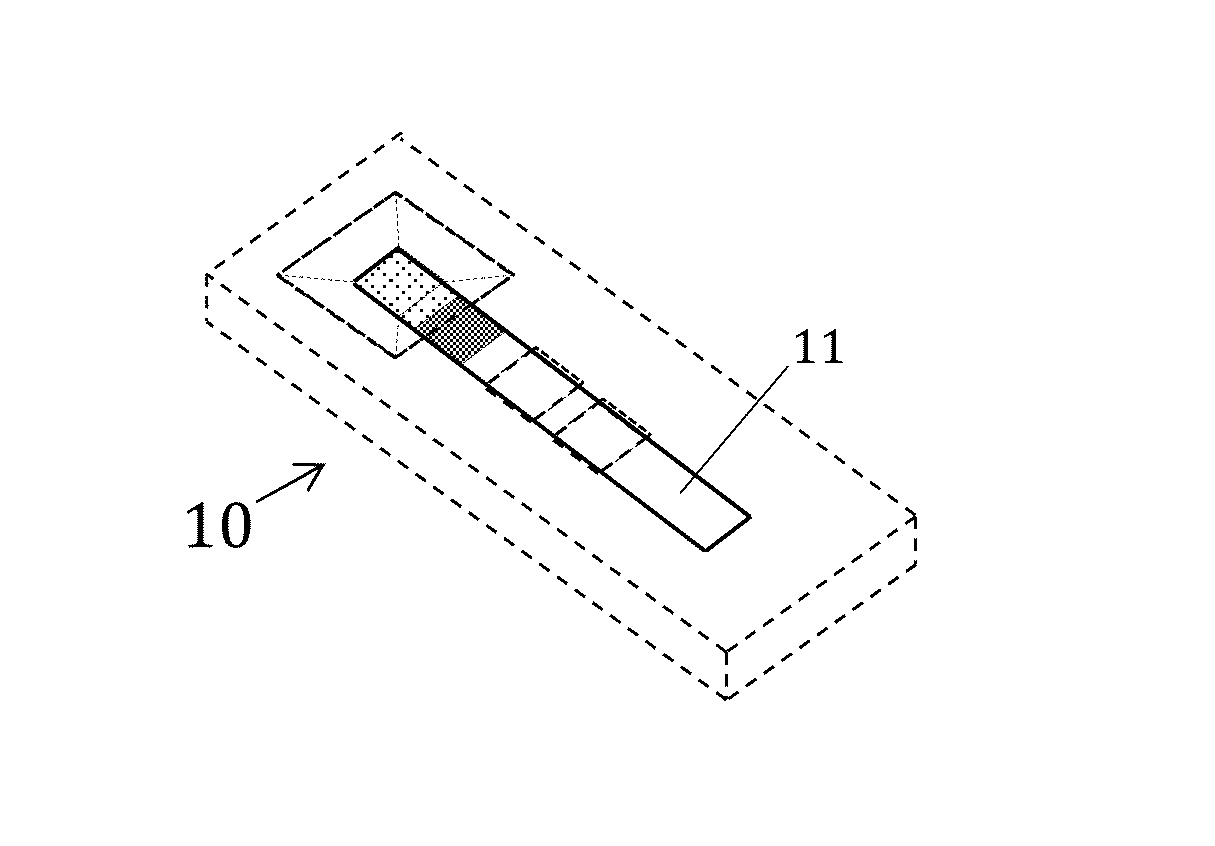
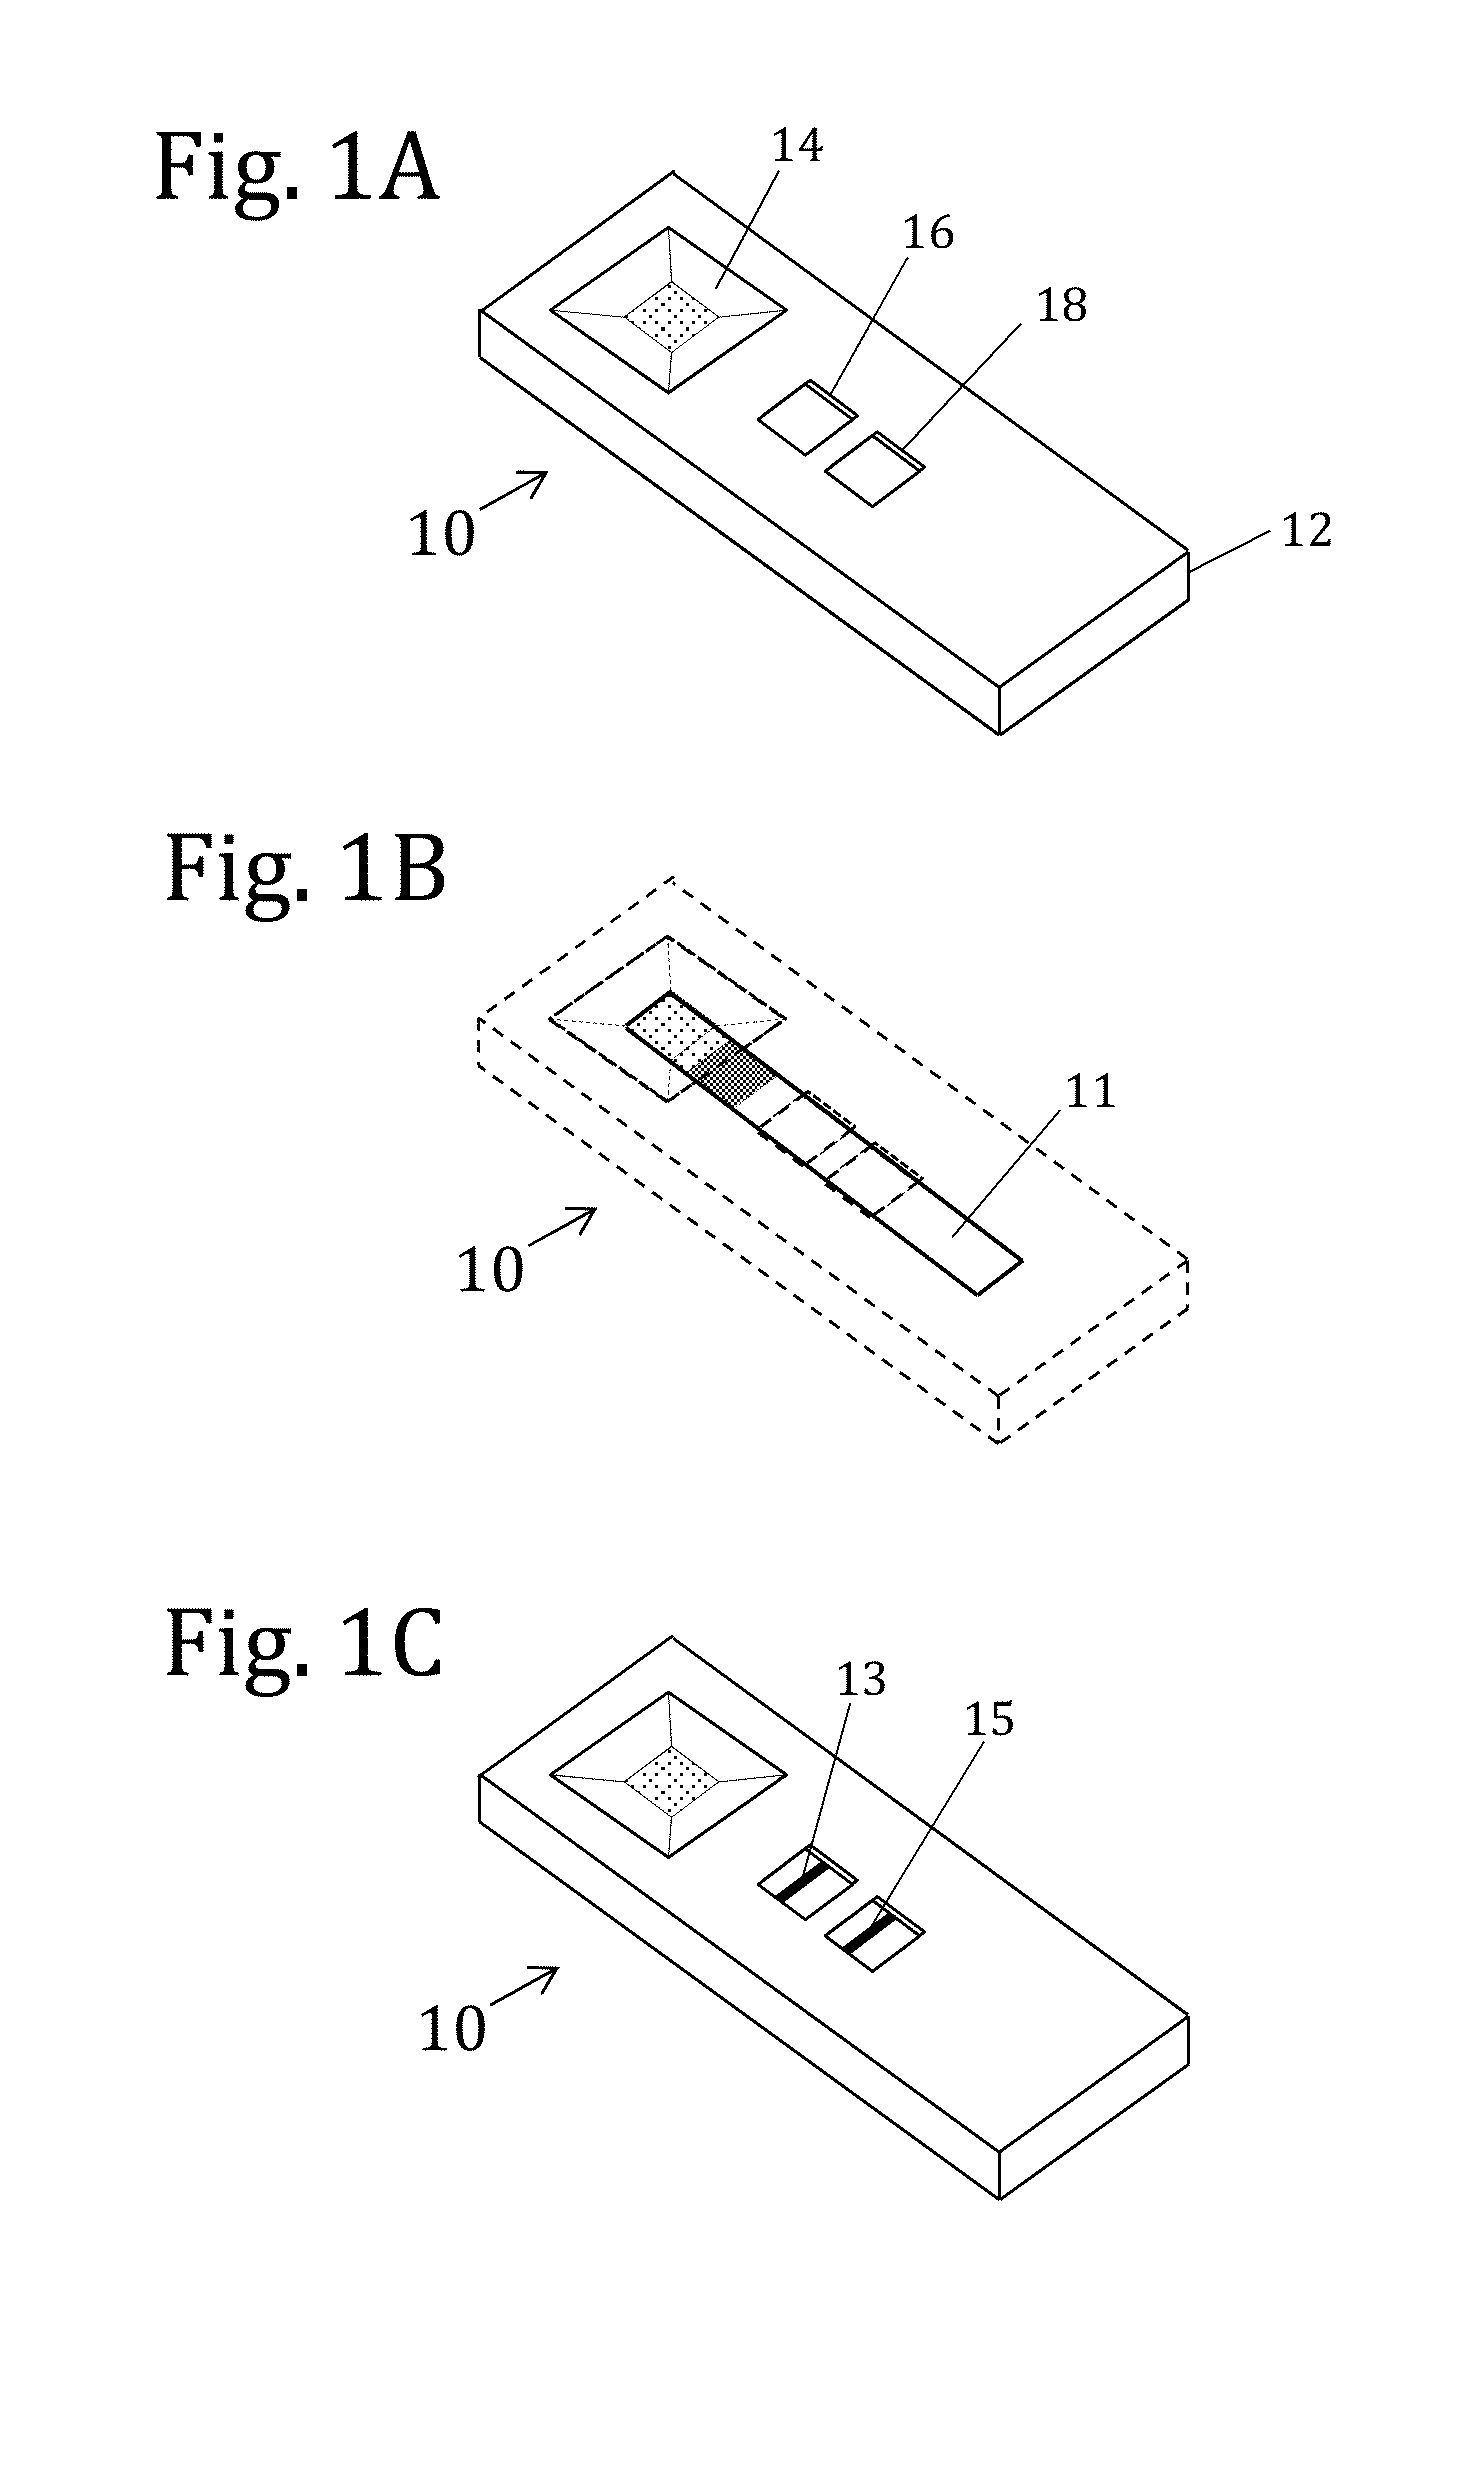
[0164]An immunochromatographic assay device was constructed based on the design described in FIG. 8. A housing component was made by cutting a rigid piece of cardboard into a rectangle and attaching an immunochromatographic strip to the housing with double stick tape. The immunochromatographic strip contained reagents for the detection of aflatoxin, and was prepared by standard methods well known in the field. Briefly, a solution of aflatoxin-BSA conjugate was striped onto a plastic backed nitrocellulose sheet to create a capture zone approximately 1 mm wide. Colloidal gold nanoparticles coated with monoclonal anti-aflatoxin antibody were dried onto a strip of glass fiber, which was then partially overlaid onto the nitrocellulose sheet to create a particle region and define a pre-capture zone (between the particle region and the capture zone). A portion of the strip was se...

example 2

Construction of a Spatiotemporal Data Recorder Designed to Accommodate Vertically Oriented Assay Devices

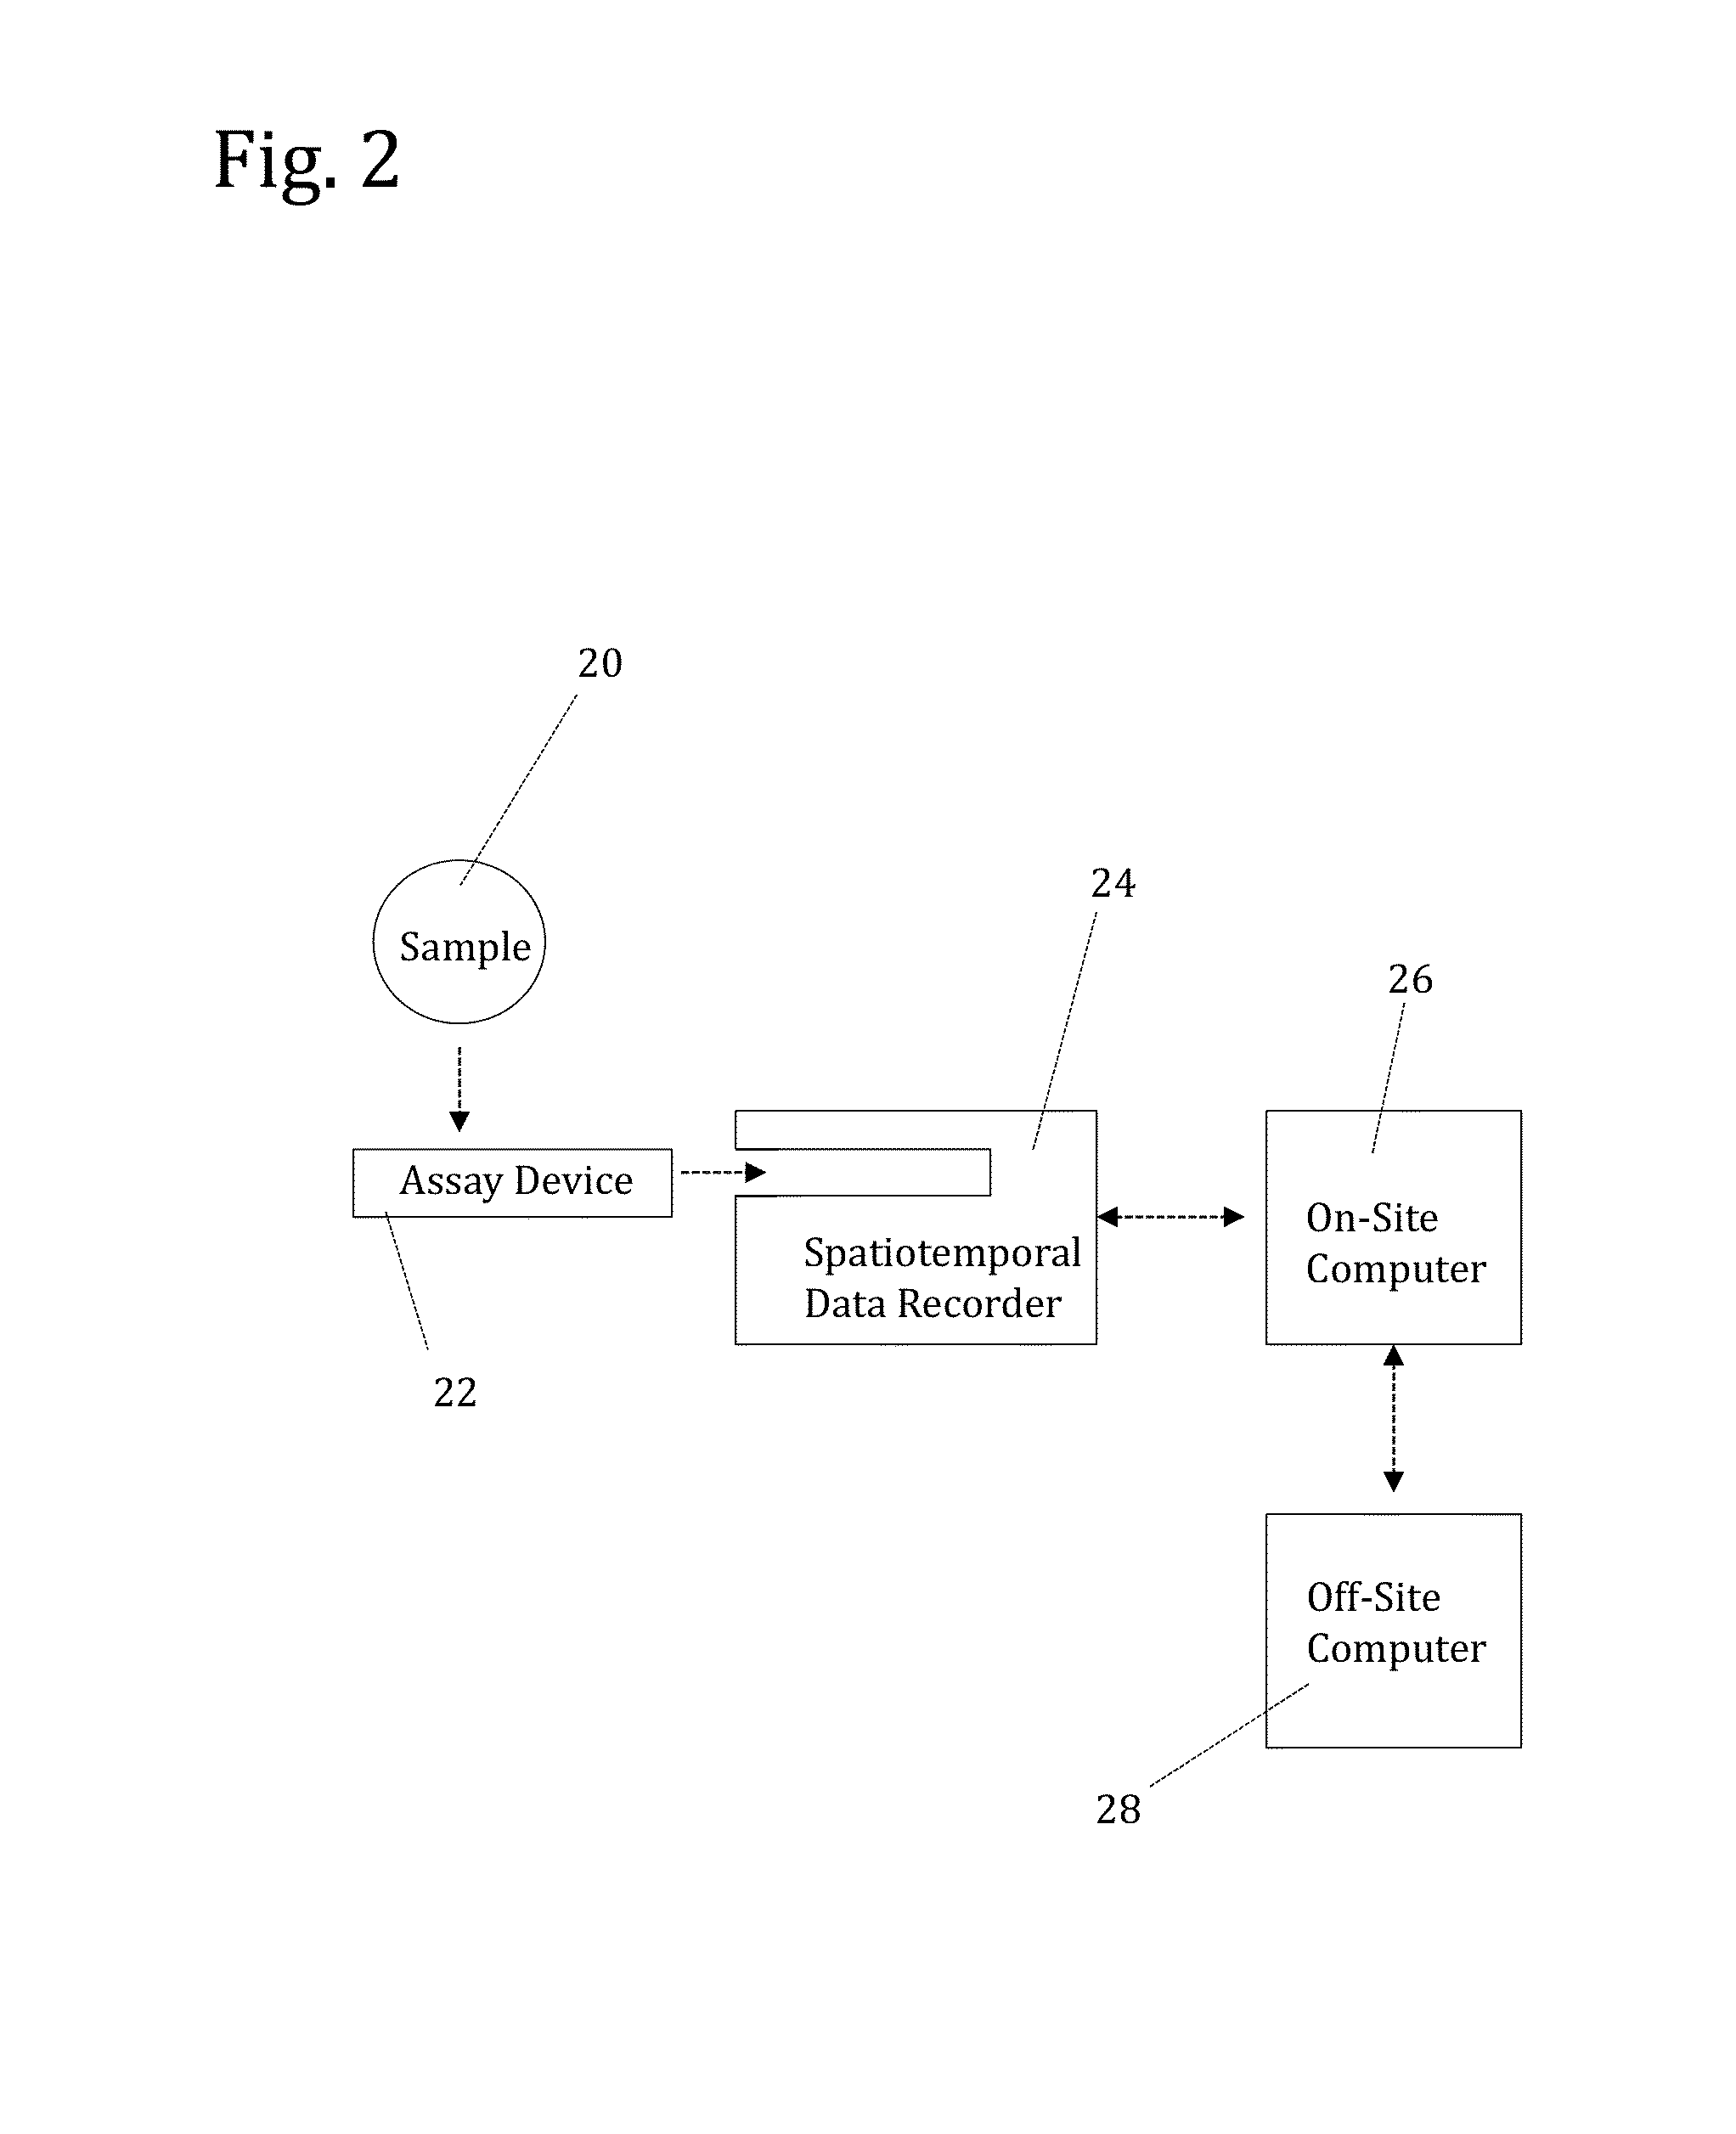
[0165]To analyze the assay devices prepared as described in Example 1, a spatiotemporal data recorder was constructed based on the design shown in FIGS. 12A-12D. FIGS. 13A-13B are a detailed diagrammatic side view of the recorder. As shown in FIG. 13A the recorder is comprised of a movable chamber 132 situated on top of a base 136. The chamber contains an assay device guide 134 for accepting a vertically inserted assay device. A digital camera and light source are contained inside the chamber. FIG. 13B shows the instrument with the chamber lifted so that the camera 138 and LED lights 131 are in view. The camera contains a 0.3 megapixal CMOS image sensor on a circuit board, with a lens over the sensor. The LED lights are attached to the circuit board in this embodiment allowing for both the camera and light source to be operated by (and draw power from) a single source. To homogeni...

example 3

Sequential Digital Images of an Assay Device Test Area Captured on a Spatiotemporal Data Recorder

[0167]Using a vertical test system with components designed as shown in FIG. 8 and FIGS. 12A-12D, the spatiotemporal data recorder (described in Example 2) begins capturing images of the immunochromatographic assay device upon insertion of the device into the recorder, and sequential images are captured at defined time intervals over the course of the flow-induced assay reaction. FIG. 15 shows a set of captured images obtained from a recorder after insertion of an assay device containing a competitive immunoassay strip configured into an assay device as described in Example 1. The test area has the dimensions of approximately 4×18 mm and the recorder incorporates a 0.3 megapixal CMOS image sensor and 2 LED lights, oriented as shown in FIGS. 13A-13B. Images were captured at 5 second intervals, with Image 01 representing the first image captured, Image 02 representing the second image capt...


PUM


Abstract

The invention relates to methods of reliably and quantitatively determining the amount of an analyte of interest in a fluid sample using a flow-induced assay, such as an immunochromatographic assay, in which spatiotemporal measurements are recorded during the course of the assay reaction, generating a spatiotemporal dataset, and subsequently analyzed. The invention also relates to a system incorporating instruments for recording spatiotemporal datasets (spatiotemporal data recorders), devices comprised of flow-induced assays configured for analysis on a spatiotemporal recorder, and programs for analyzing the recorded spatiotemporal datasets.

Description

CROSS REFERENCE TO RELATED APPLICATION[0001]This application claims the benefit of U.S. Provisional Patent Application No. 61 / 743,415 filed on Sep. 4, 2012, the contents of which are incorporated herein by reference.FIELD OF THE INVENTION[0002]The present invention relates to a reliable, rapid, quantitative diagnostic test system and method suitable for on-site determination of analytes in fluid samples.BACKGROUND OF THE INVENTION[0003]Rapid immunochromatographic assay devices (also referred to herein simply as “rapid assay devices”) are currently available to test clinical samples (e.g. whole blood, serum, plasma, urine, saliva) for a wide variety of analytes, such as hormones, drugs, toxins, metabolites, cardiac markers, and pathogen-derived antigens. In addition, rapid assay devices are also used extensively in non-clinical applications such as food and environmental testing. Typical devices are comprised of an immunochromatographic assay strip contained within a housing that exp...

Claims


Application Information

Patent Timeline
IPC IPC(8): G01N33/543
CPCG01N33/54306G01N33/558G01N33/54386B01L2300/0825G01N21/85G01N21/274G01N21/8483G01N2021/8494G01N33/54388
Inventor MAMENTA, EDWARD L
Owner MAMENTA EDWARD L
Learn More