Normalization of polymerase activity
- Summary
- Abstract
- Description
- Claims
- Application Information
AI Technical Summary
Benefits of technology
Problems solved by technology
Method used
Image
Examples
experimental examples
Example 1
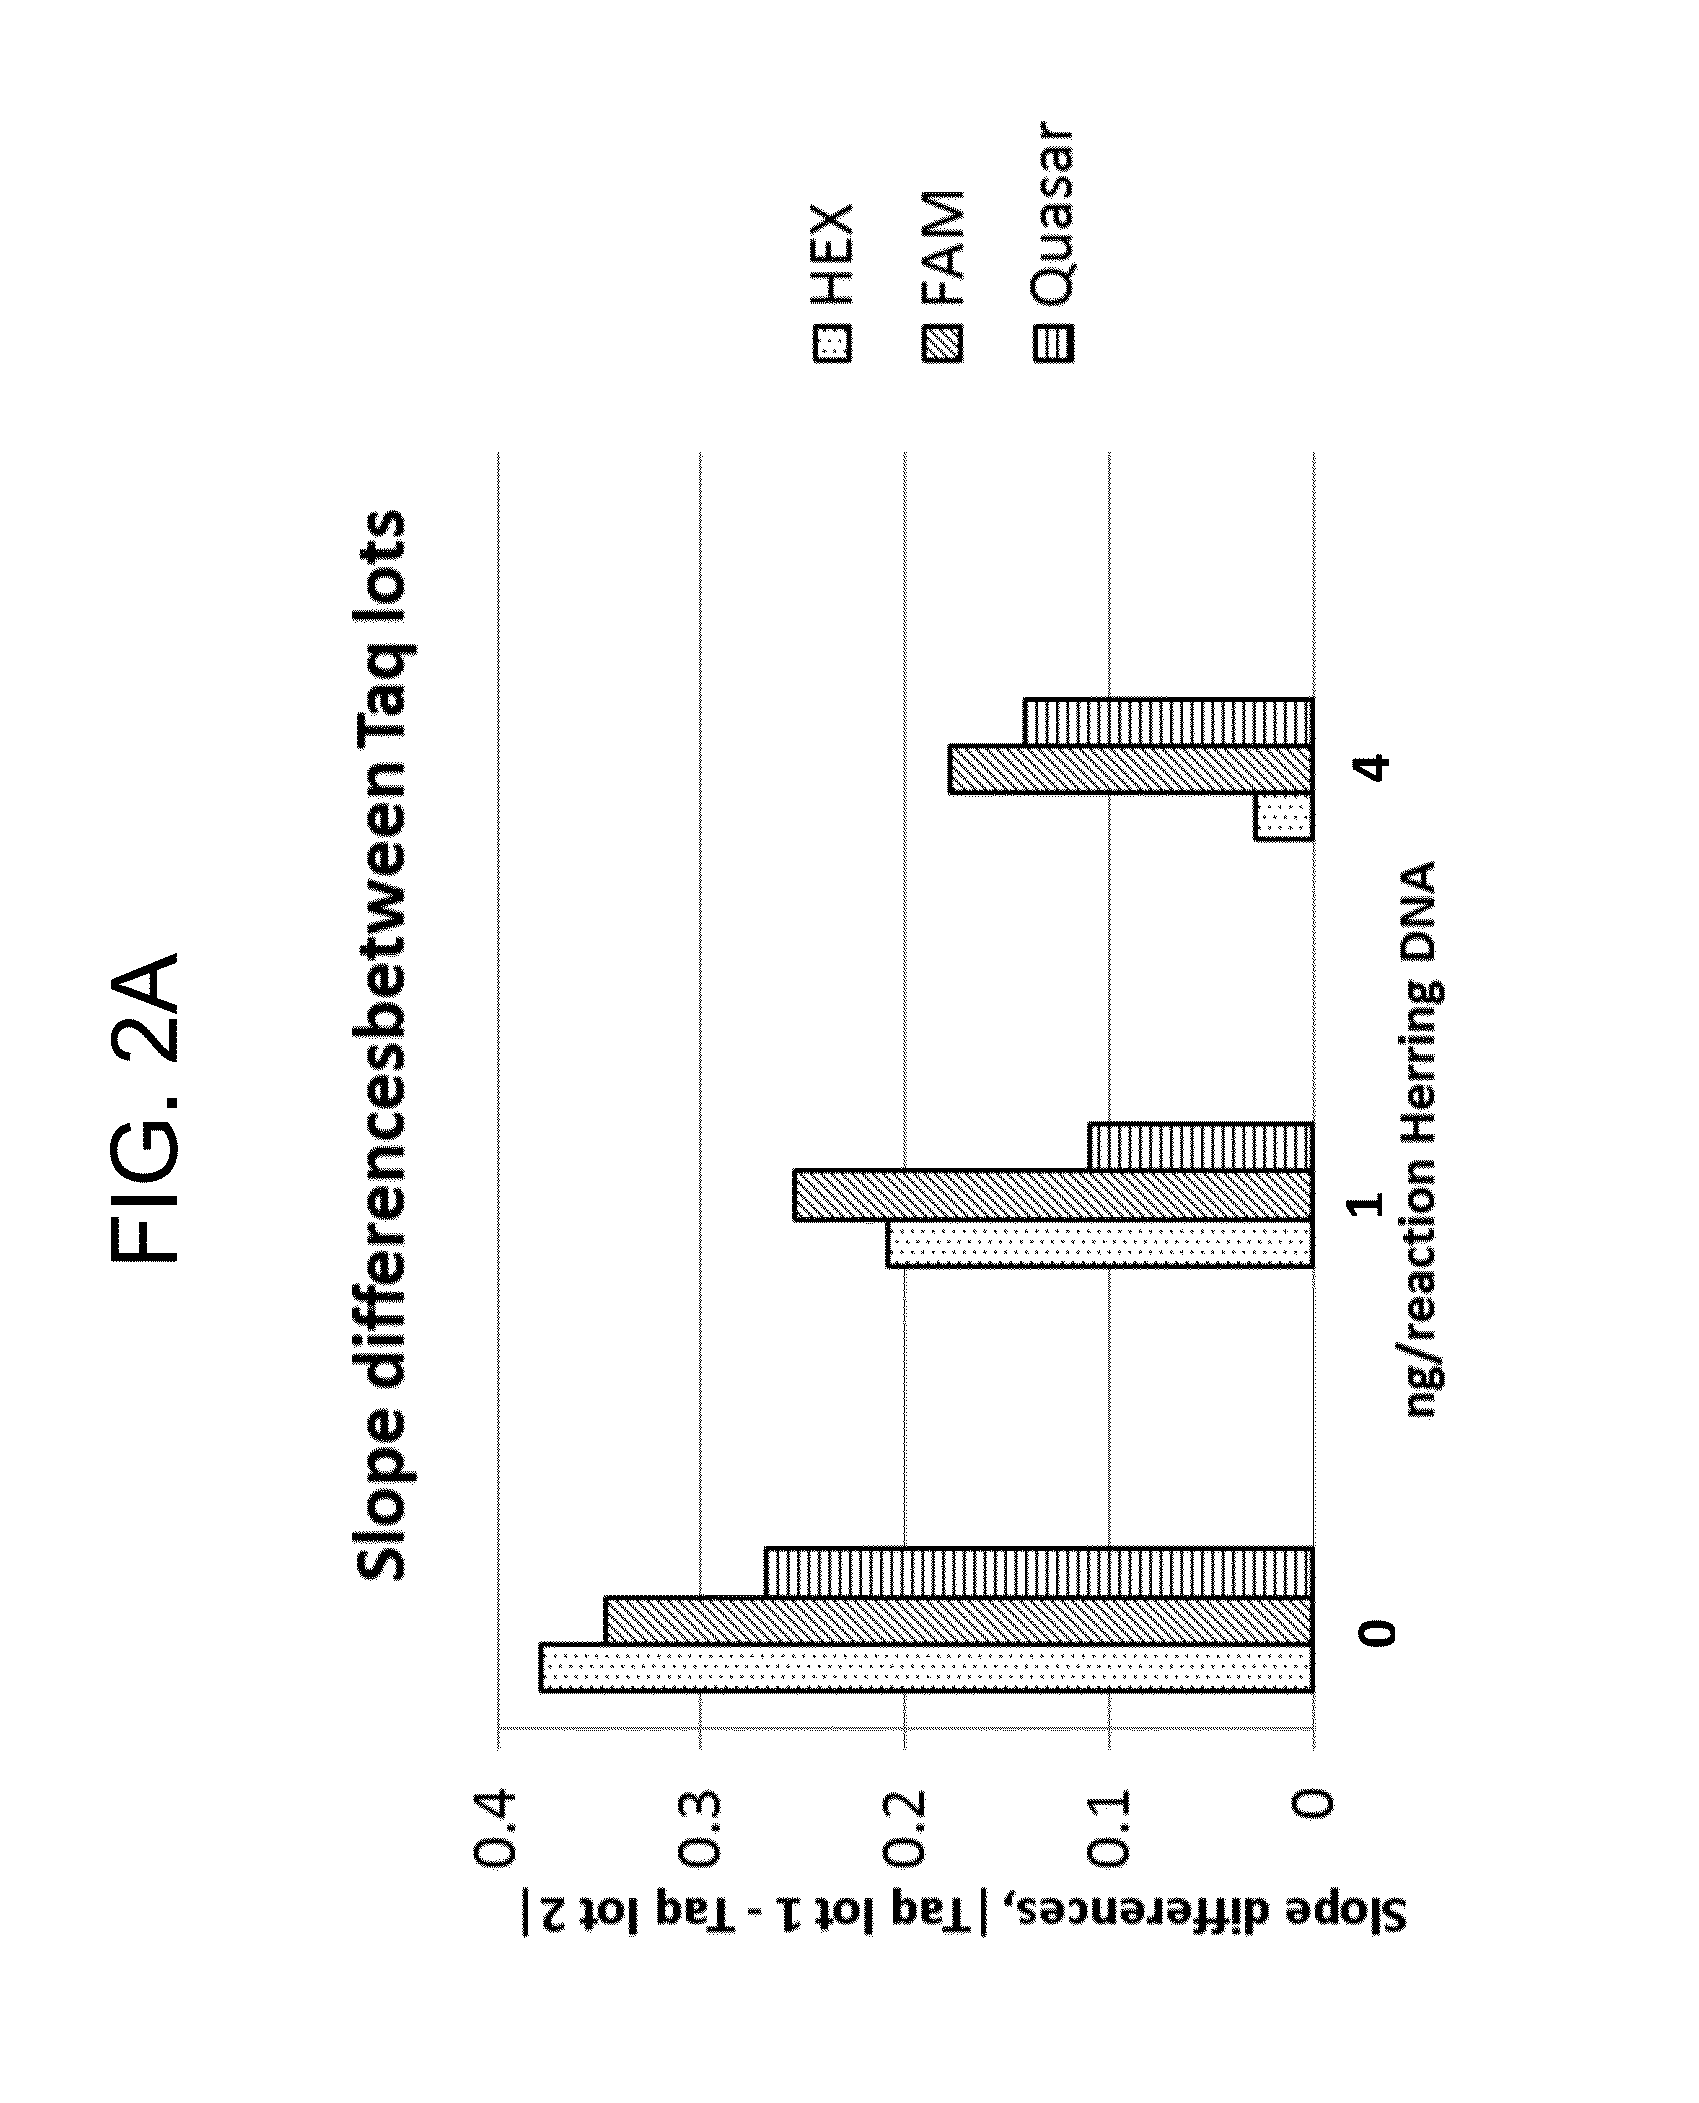
[0105]During the development of embodiments of the technology provided herein, it was hypothesized that the addition of exogenous non-target containing DNA would minimize manufacturing variability in Taq polymerase and / or resemble the non-target DNA that is present in some complex samples such as stool DNA (sDNA) samples that are often used for colorectal cancer screening. To test this hypothesis, varying amounts of mouse and herring DNA were added to KRAS calibrators at 10, 100, 1000 and 10,000 copies per reaction (n=4 replicates each). Then, using two different lots of Taq polymerase (designated “DEV” and “New Pro”), the differences between the standard curves' slopes and intercepts were examined. Concentrations of the reaction components (in nM, except as indicated for dNTPs) are shown below:
KRAS Reverse primer300KRAS 35C probe500ACTB Reverse primer500KRAS 34A probe500KRAS 34A forward primer250KRAS 34C probe500KRAS 34T forward primer250KRAS 35T probe500KRAS 34C forward p...
example 2
[0110]tRNA is often added to calibrator samples used in quantitative PCR, e.g., to minimize sticking of calibrator DNA to vessels. To test whether tRNA had the same effect on polymerase performance in a PCR-invasive cleavage assay as observed with herring DNA, QuARTS reactions were conducted as described above, but in the presence of 20 ng / μl of tRNA instead of 4 ng / μl of herring DNA, The results are shown in FIG. 3. Calibration plots for the two lots of Taq are nearly identical in the presence of herring DNA (FIG. 3B), but not in the presence of tRNA (FIG. 3A), indicating that the performance variation is not due to binding of the calibrator DNA to the vessels.
example 3
[0111]During the development of embodiments of the technology, data were collected from experiments in which standard curves were generated from different lots of Taq in the presence of USB / Affymetrix fish (salmon) DNA (Cleveland, Ohio). A comparison of two lots of Promega “Hot Start Go Taq” (indicated as “DEV” and “Pnew”, and present at concentrations of 0.03, 0.05, and 0.07 U / μl; Promega Corp., Madison, Wis.) in the KRAS QuARTS assay with the addition of 200 ng / reaction of USB / Affymetrix fish DNA showed that the standard curves were nearly identical between the two Taq lots for all three dyes (Table 3). FIG. 4 shows plots of the data from the 0.05 and 0.07 U / μ1 reaction sets.
TABLE 3delta Cp, DEV lot Taq − Pr new lot TaqTaq concentration 0.03 U / μLTaq concentration 0.05 U / μLTaq concentration 0.07 U / μLTargetFAMHEXQuasar 670FAMHEXQuasar 670FAMHEXQuasar 670KRAS1e1 cp / rxn−0.58−0.05−0.260.17−0.170.110.01−0.38−0.28Calibrator:1e2 cp / rxn−0.01−0.11−0.050.360.32−0.130.751.220.4138A, 35C,1e3 c...
PUM
| Property | Measurement | Unit |
|---|---|---|
| Concentration | aaaaa | aaaaa |
| Concentration | aaaaa | aaaaa |
| Thermal stability | aaaaa | aaaaa |
Abstract
Description
Claims
Application Information
 - R&D
- Intellectual Property
- Life Sciences
- Materials
- Tech Scout
- Unparalleled Data Quality
- Higher Quality Content
- 60% Fewer Hallucinations
Browse by: Latest US Patents, China's latest patents, Technical Efficacy Thesaurus, Application Domain, Technology Topic, Popular Technical Reports.
© 2025 PatSnap. All rights reserved.Legal|Privacy policy|Modern Slavery Act Transparency Statement|Sitemap|About US| Contact US: help@patsnap.com


