Systems and methods for hemodynamic detection of circulatory anomalies

a technology of system and method, applied in the field of system, method and apparatus for detection of circulatory anomalies, can solve the problems of causing debilitating and life-threatening consequences, no available method suitable for widespread screening for the presence of pfo, and significant risk of initiating tia, stroke or heart attack

Inactive Publication Date: 2014-05-08
CARDOX
View PDF5 Cites 2 Cited by
  • Summary
  • Abstract
  • Description
  • Claims
  • Application Information

AI Technical Summary

Problems solved by technology

The presence of these now cerebral emboli in the brain arterial flow can produce debilitating and life-threatening consequences.
If patients undergoing sclerotherapy are among the portion of the population with a PFO, creation of emboli that may bypass the filtering aspect of the lungs creates a significant risk of initiating a TIA, stroke or heart attack.
Unfortunately, there is currently no available method suitable for widespread screening for the presence of a PFO when the patient experiences early warning signs signaling an ischemic incident, or the patient exhibits or is exposed to an elevated risk of a stroke.
Typically, patients experience discomfort and the test is hardly suited for screening.
The TEE test is also expensive, with an equipment total cost of between $75,000 and $322,000.
The TTE procedure also requires the use of expensive equipment and exhibits relatively poor sensitivity, by some reports as low as 60%.
Unfortunately, approximately 20% of the population has a cranial bone that is too thick for sonic transducing to “see” the mid-cerebral artery, and equipment costs range between approximately $30,000 to $45,000.
A continuing difficulty with existing methods is the efficacy of using microbubble contrasts as a circulatory tracking indicator.
Microbubbles are created just prior to use, are a transient structure, and decidedly non-uniform in creation and application.
It is difficult if not impossible for microbubbles to be used for quantitative measurements, and thus clinicians are forced to rely on a simple binary positive or negative result assessment.
In part, the inability to effectively quantify the conductance of a shunt is revealed in the relatively low sensitivity of the existing methods.
A further problem with existing methods is the difficulty in effectively detecting the circulatory tracking indicator in the form of microbubbles.
Each of the existing methods, including the TEE, TTE and TCD methods, suffer from barriers for routine use for screening, whether due to the need for anesthesia or expensive equipment.
One difficulty with improving the present technology in circulatory tracking reagents is that there heretofore has been no animal model available for screening a variety of different circulatory tracking reagents and their compatible detection systems.
In addition, there is likewise a significant unmet need for a highly sensitive, quantitative low-cost method for evaluating the effectiveness and durability of the shunt closure at three to four time points following the percutaneous closure of the right-to-left shunt.

Method used


Image

  • Systems and methods for hemodynamic detection of circulatory anomalies
  • Systems and methods for hemodynamic detection of circulatory anomalies
  • Systems and methods for hemodynamic detection of circulatory anomalies

Examples


example 1

Calculation of Flow Rate of Human Subject with Single Right-to-Left Shunt

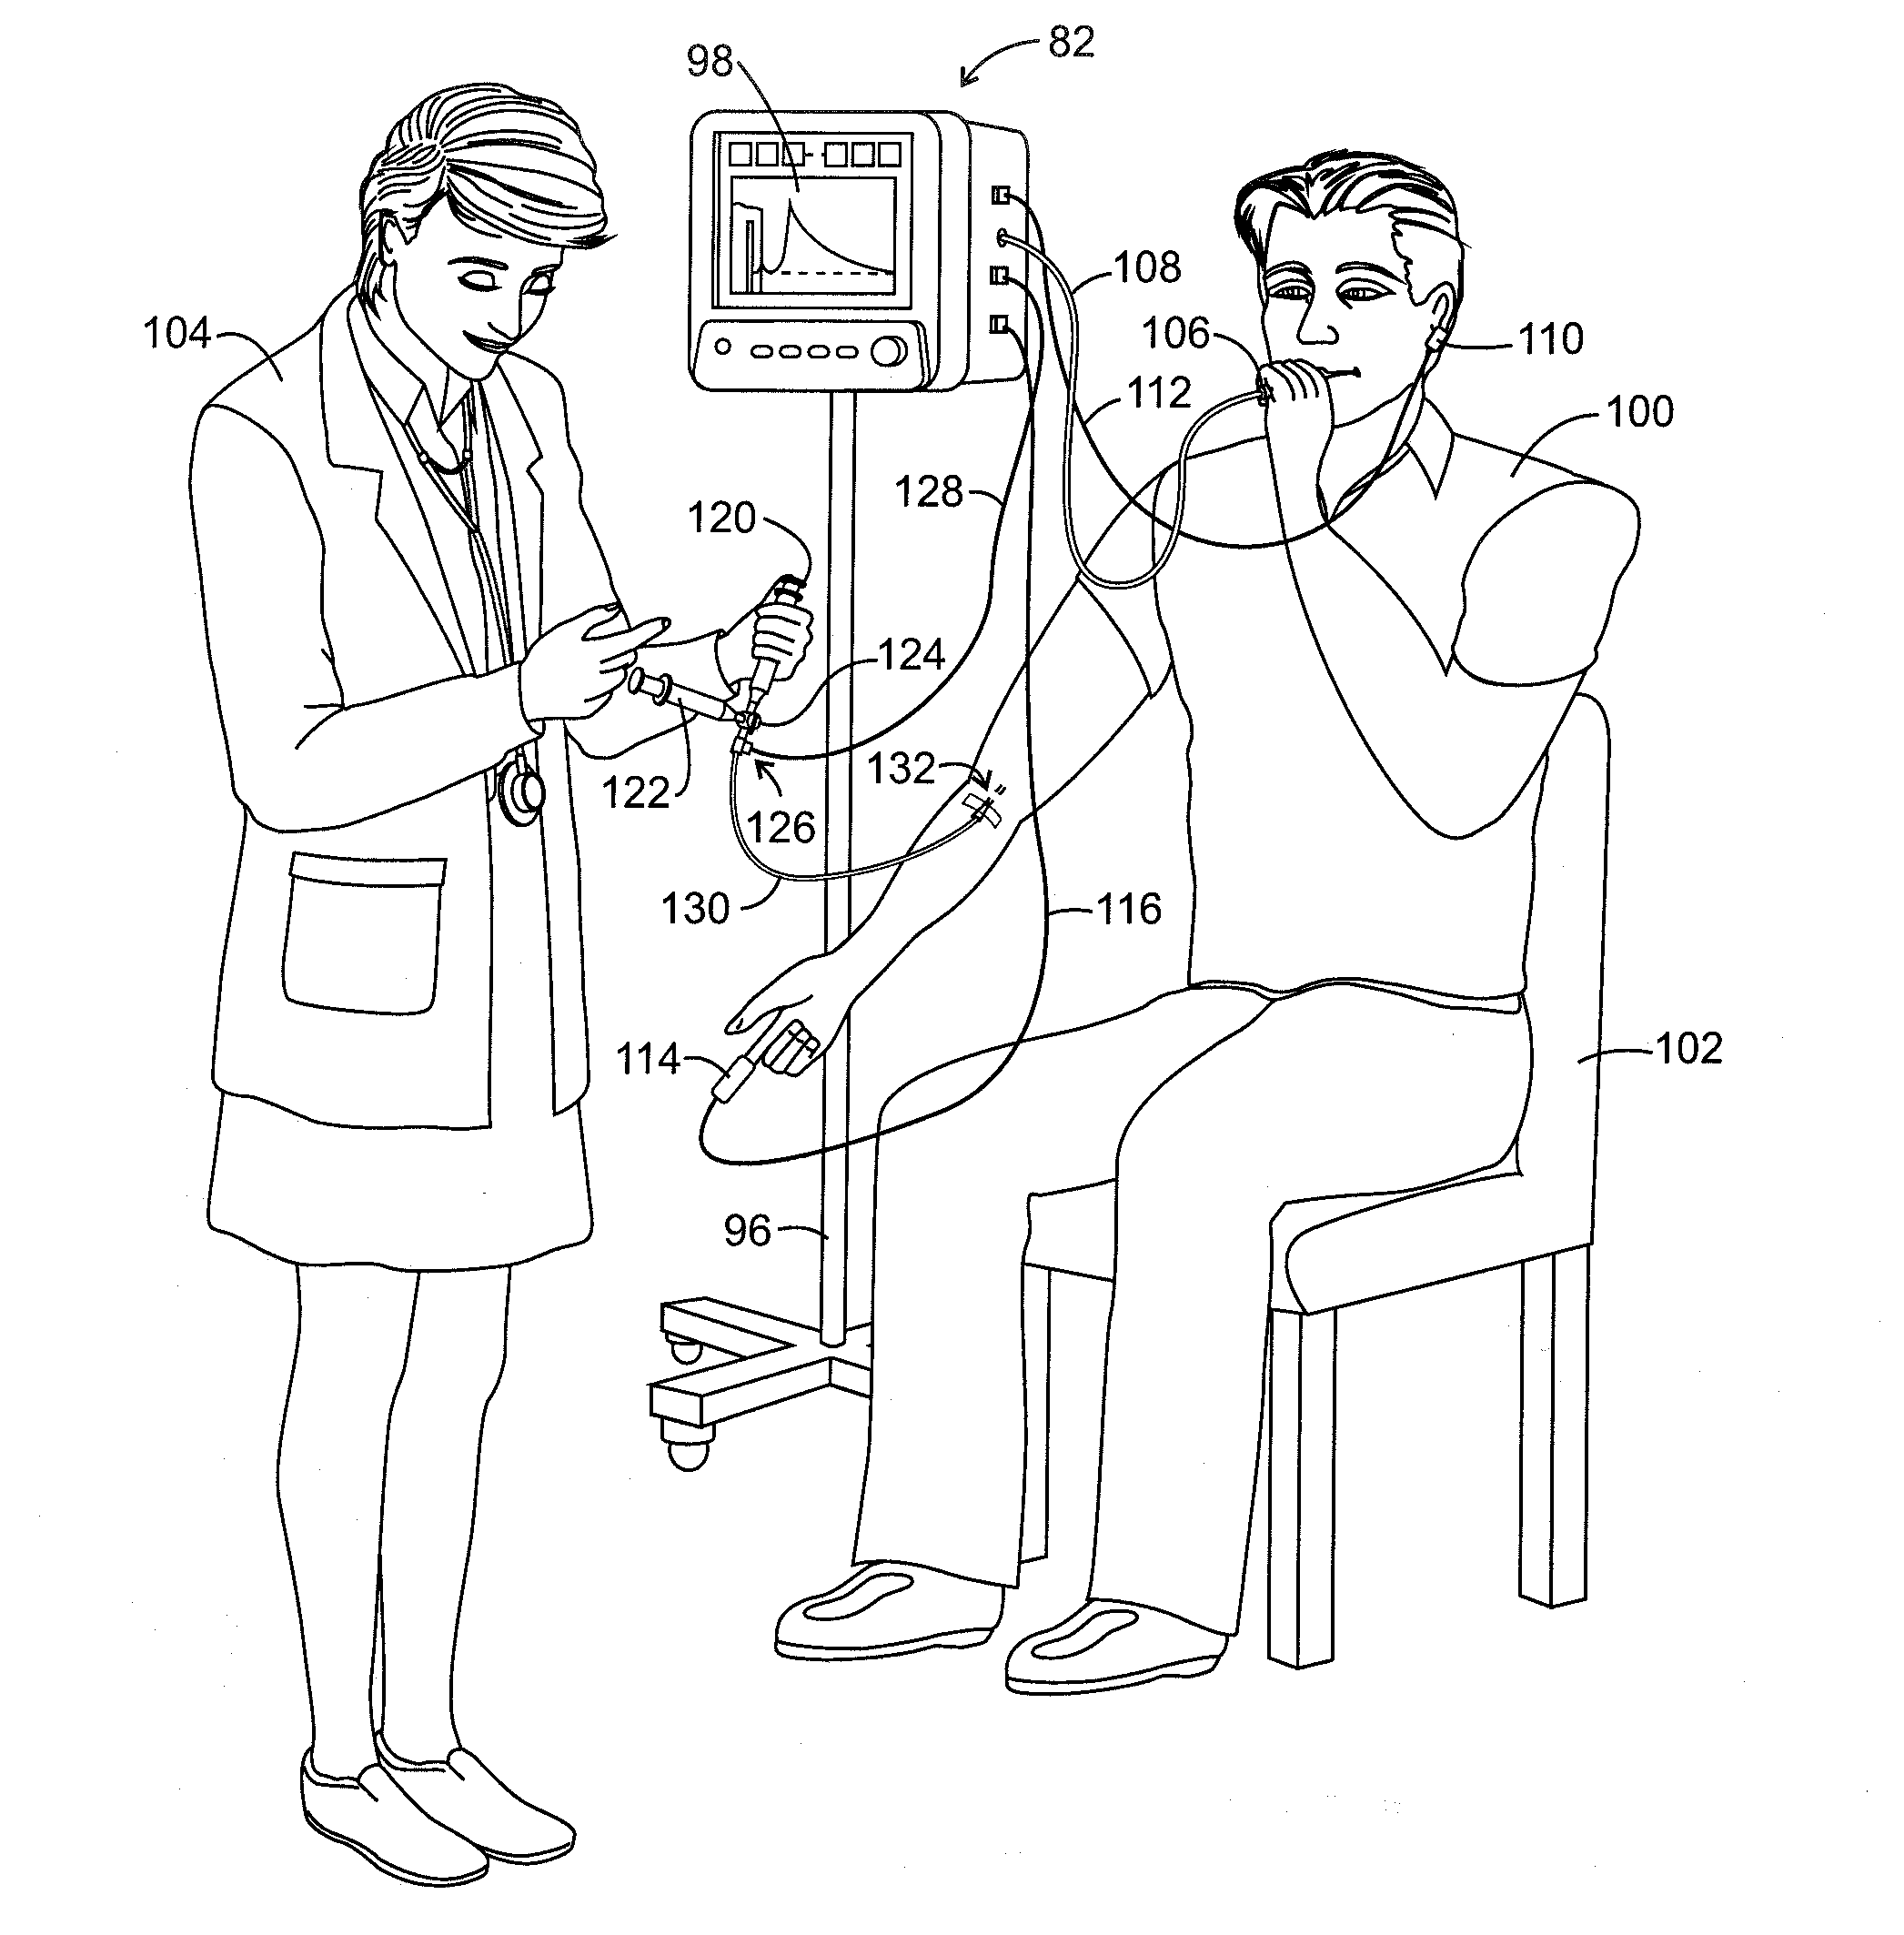
[0257]This example involves the calculation of the flow rate or Shunt Conductance of a human subject with a single right-to-left shunt, as seen in FIG. 9 using Equation 24 and assuming the following parameters:

[0258]SI=Stroke Index for Normal Subject=46 ml / m2;

[0259]H=Height of subject=70 inches;

[0260]W=Weight of subject=160 pounds;

[0261]HR=measured average heart rate during period of measurement of indicator concentration as a function of time=1.0 beats / second (i.e., 60 beats / minute);

[0262]A1=calculated area under indicator / dilution curve derived from measured fluorescence signal level (in units of millivolts) vs. time (in seconds) associated with right-to-left shunt=40.5 millivolts-seconds; and

[0263]A2=calculated area under indicator / dilution curve derived from measured fluorescence signal level (in units of millivolts) vs. time (in seconds) associated with blood flow through lungs and back to left atrium of h...

example 2

Calculation of Flow Rate of Human Subject with Two Right-to-Left Shunts

[0264]This example involves the calculation of the flow rate or Shunt Conductance of a human subject with two right-to-left shunts, as seen in FIG. 11, using Equations 25 and 26 and assuming the following parameters:

[0265]SI=Stroke Index for Normal Subject=46 ml / m2;

[0266]H=Height of subject=72 inches;

[0267]W=Weight of subject=185 pounds;

[0268]HR=measured average heart rate during period of measurement of indicator concentration as a function of time=1.2 beats / second (i.e., 60 beats / minute);

[0269]A1=calculated area under indicator / dilution curve derived from measured fluorescence signal level (in units of millivolts) vs. time (in seconds) associated with a first right-to-left shunt=45.0 millivolts-seconds;

[0270]A2=calculated area under indicator / dilution curve derived from measured fluorescence signal level (in units of millivolts) vs. time (in seconds) associated with right-to-left shunt=65.7 millivolts-seconds;

[...

example 3

System and Method for Testing Circulatory Tracking Indicators and Detectors

[0321]The present disclosure also describes exemplary methods for testing systems for monitoring cardiac output, circulatory behavior of blood fluids, and blood circulation, including circulation within peripheral tissues of a human body and organs, such as the heart, brain or liver. For example, a method is described for utilizing an experimental animal body for determining the efficacy of circulatory tracking systems by emplacing an injection catheter into the circulatory system or a chamber of the heart in a test animal with a functioning circulatory system and heart. Once the injection catheter is emplaced, a number of variables in a circulatory tracking system to be tested may be altered. For instance, a series of circulatory tracking reagents being tested with the method may be injected into the circulatory system of the test animal, and detector systems compatible with the circulatory tracking reagent ...


PUM


Abstract

Systems and methods for detecting circulatory anomalies such as, for example, right-to-left cardiac and pulmonary shunts. A fluorescing indicator is injected into the bloodstream of a subject. An optical sensor is used to transcutaneously excite the indicator into fluorescence and to transcutaneously detect the fluorescence, and a relative concentration of the indicator is determined as a function of time. An indicator dilution curve is generated from the relative concentration readings, the curve shape is analyzed for the indication of a shunt and, if a shunt is detected, a ratiometric area under the curve analysis is performed and combined with a calculated cardiac output value to provide a shunt conductance value. A Valsalva maneuver may be performed as a part of the method. System embodiments may include a controller / monitor that monitors, times, cues and / or analyzes various steps of a shunt detection test.

Description

CROSS-REFERENCE TO RELATED APPLICATIONS[0001]This application is a continuation of U.S. application Ser. No. 12 / 418,866 filed on Apr. 6, 2009, which claims the benefit of Provisional Application No. 61 / 156,723 filed on Mar. 2, 2009 and Provisional Application No. 61 / 080,724 filed on Jul. 15, 2008, all of which are hereby incorporated by reference herein.TECHNICAL FIELD[0002]The present invention generally relates to a system, method and apparatus for detection of circulatory anomalies in the mammalian body. Important types of such anomalies involve the heart and include anomalies generally referred to as right-to-left cardiac shunts.BACKGROUND[0003]An anomaly commonly encountered in humans is an opening between chambers of the heart, particularly an opening between the left and right atria, i.e., an Atrial Septal Defect, creating a right-to-left atrial shunt, or between the left and right ventricles, i.e., a Ventricular Septal Defect (VSD), creating a right-to-left ventricular shunt...

Claims


Application Information

Patent Timeline
Patent Type & Authority Applications(United States)
IPC IPC(8): A61B5/0275A61B5/00
CPCA61B5/6815A61B5/0275A61B5/0059A61B5/02416A61B5/029A61B5/6816A61B5/6826A61B5/6838
Inventor EGGERS, PHILIP E.EGGERS, ANDREW R.EGGERS, ERIC A.
Owner CARDOX
Why Eureka
Try Eureka