Imaging mass analysis data processing method and imaging mass spectrometer

a mass analysis and data processing technology, applied in chemical methods analysis, instruments, material analysis, etc., can solve the problems of limiting the capacity of the main memory that is actually available, difficult to read full-size such high-resolution imaging mass analysis data as described above into the main memory, etc., to improve the accuracy of comparison of mass analysis result images

Active Publication Date: 2014-10-23
SHIMADZU CORP
View PDF6 Cites 15 Cited by
  • Summary
  • Abstract
  • Description
  • Claims
  • Application Information

AI Technical Summary

Benefits of technology

[0058]In the imaging mass analysis data processing method and the imaging mass spectrometer according to the present invention, for the imaging mass analysis data obtained from a plurality of different samples, even if the arrays of mass-to-charge points constituting a mass spectrum are different for each sample, the arrays of the mass-to-charge points can be equalized by correcting intensity values. Further, even if the measurement point intervals are different for each sample, the measurement point intervals can be equalized by newly setting a virtual measurement points and correcting intensity values such that a mass spectrum at the virtual measurement points are obtained. Because the measurement point intervals and the arrays of the mass-to-charge ratio are equalized in this way, the imaging mass analysis data of the plurality of samples can be treated as if they were one imaging mass analysis data. As a result, even if the measurement point intervals and the like are not equal originally, a statistical analysis or the simultaneously display of mass analysis result images can be performed, in order to compare the plurality of imaging mass analysis data. Further, a conventional processing for one imaging mass analysis data can be applied without any change, which is simple. Further, the accuracy of comparison of the mass analysis result images is improved.

Problems solved by technology

Hence, if mass spectrometric imaging is performed at a high mass resolving power and a high spatial resolving power, the total amount of data per sample is enormous.
However, there is a restriction on the capacity of the main memory that is actually available in the general personal computer, and hence it is difficult to entirely read such high-resolution imaging mass analysis data as described above into the main memory.
In this case, it is necessary to limit the range of images that can be created and displayed for mass analysis result in accordance with the restriction on the amount of data readable into the main memory, or, otherwise, use a part of an external memory device such as a hard disk drive as a virtual main memory, in which case the processing speed inevitably deteriorates.
The ionization method of a MALDI ion source which is normally used for imaging mass spectrometers is suitable for biological samples, but it has a disadvantage in that the ion intensity fluctuates relatively large for each measurement (that is, for each laser irradiation).
However, such summing is not always effective for eliminating fluctuations in ion intensity for each measurement point.
Hence, even if a mass analysis result image is created using the ion intensity values at a specific mass-to-charge ratio obtained for each measurement point, the created mass analysis result image may not show the true distribution of a substance.
Such work is much complicated, and may lower the accuracy of comparison evaluation.
As a result, the operator may make erroneous subjective determination and evaluation.
It is difficult to create peak matrices for a statistical analysis from the imaging mass analysis data collected under such a condition, regardless of whether or not to combine the peak matrices respectively generated from the plurality of imaging mass analysis data as described above.

Method used


Image

  • Imaging mass analysis data processing method and imaging mass spectrometer
  • Imaging mass analysis data processing method and imaging mass spectrometer
  • Imaging mass analysis data processing method and imaging mass spectrometer

Examples


Embodiment Construction

[0072]An embodiment of an imaging mass analysis data processing method and an imaging mass spectrometer using the method according to the present invention is hereinafter described with reference to the attached drawings.

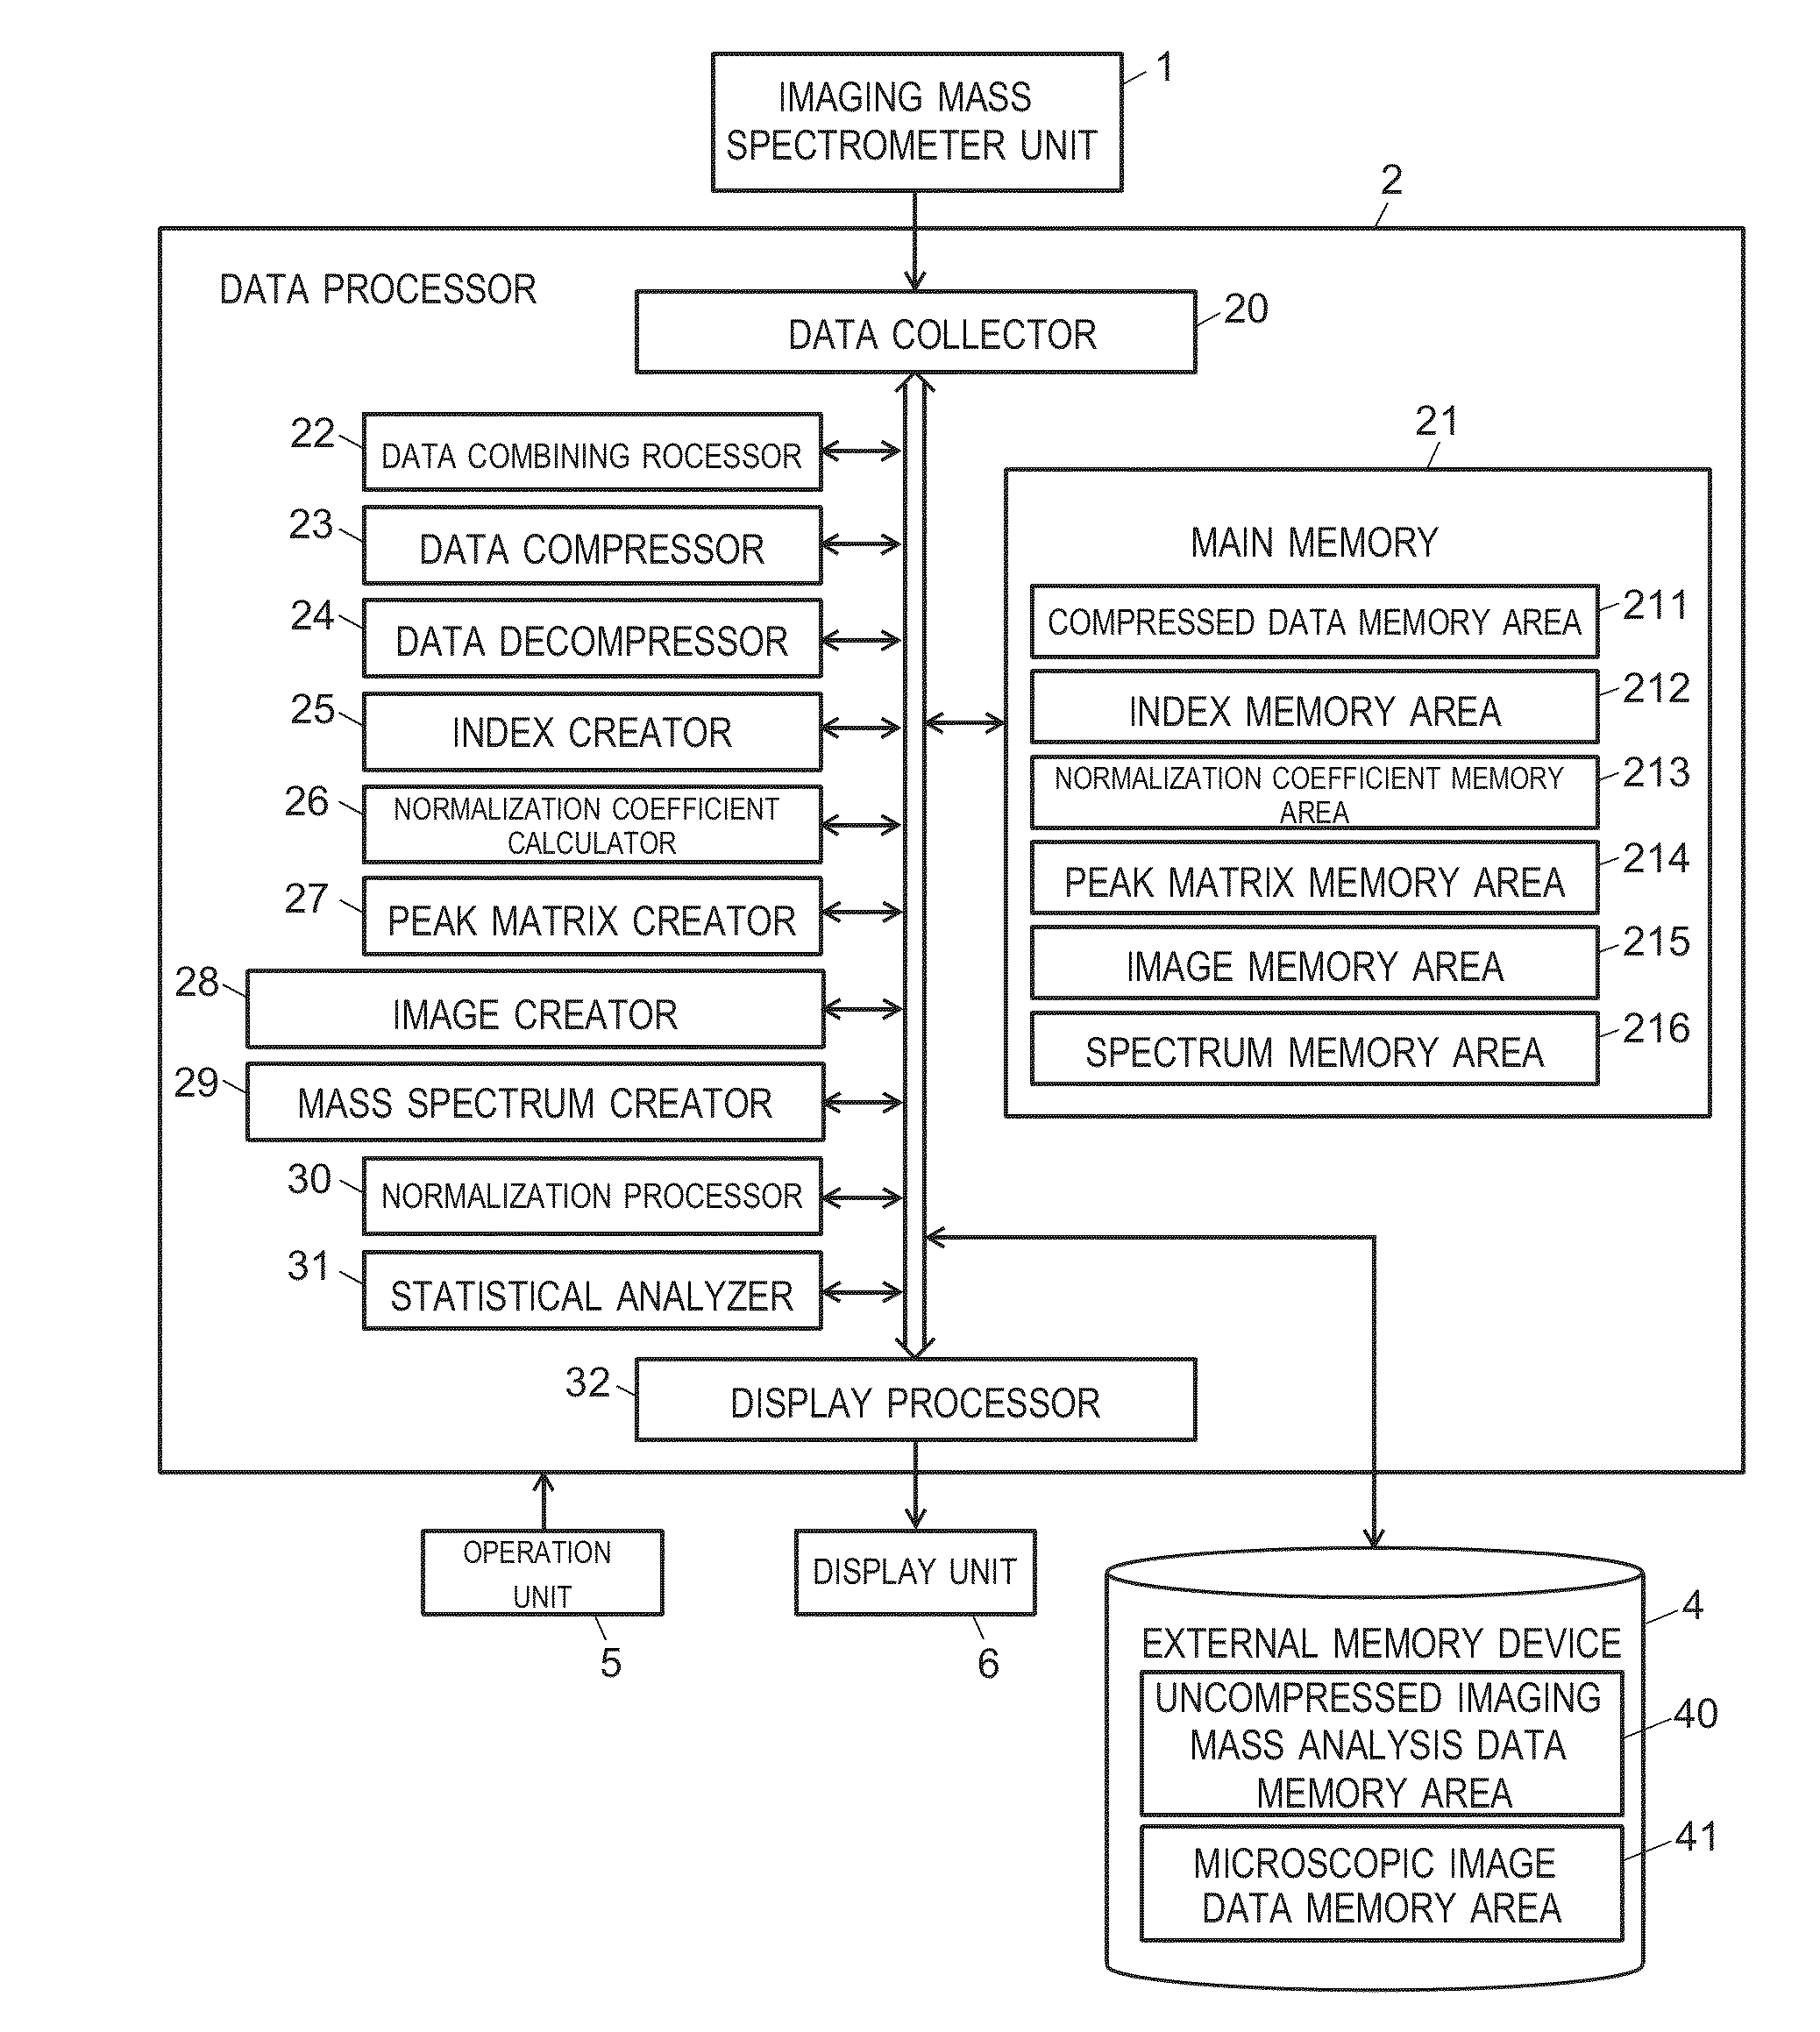
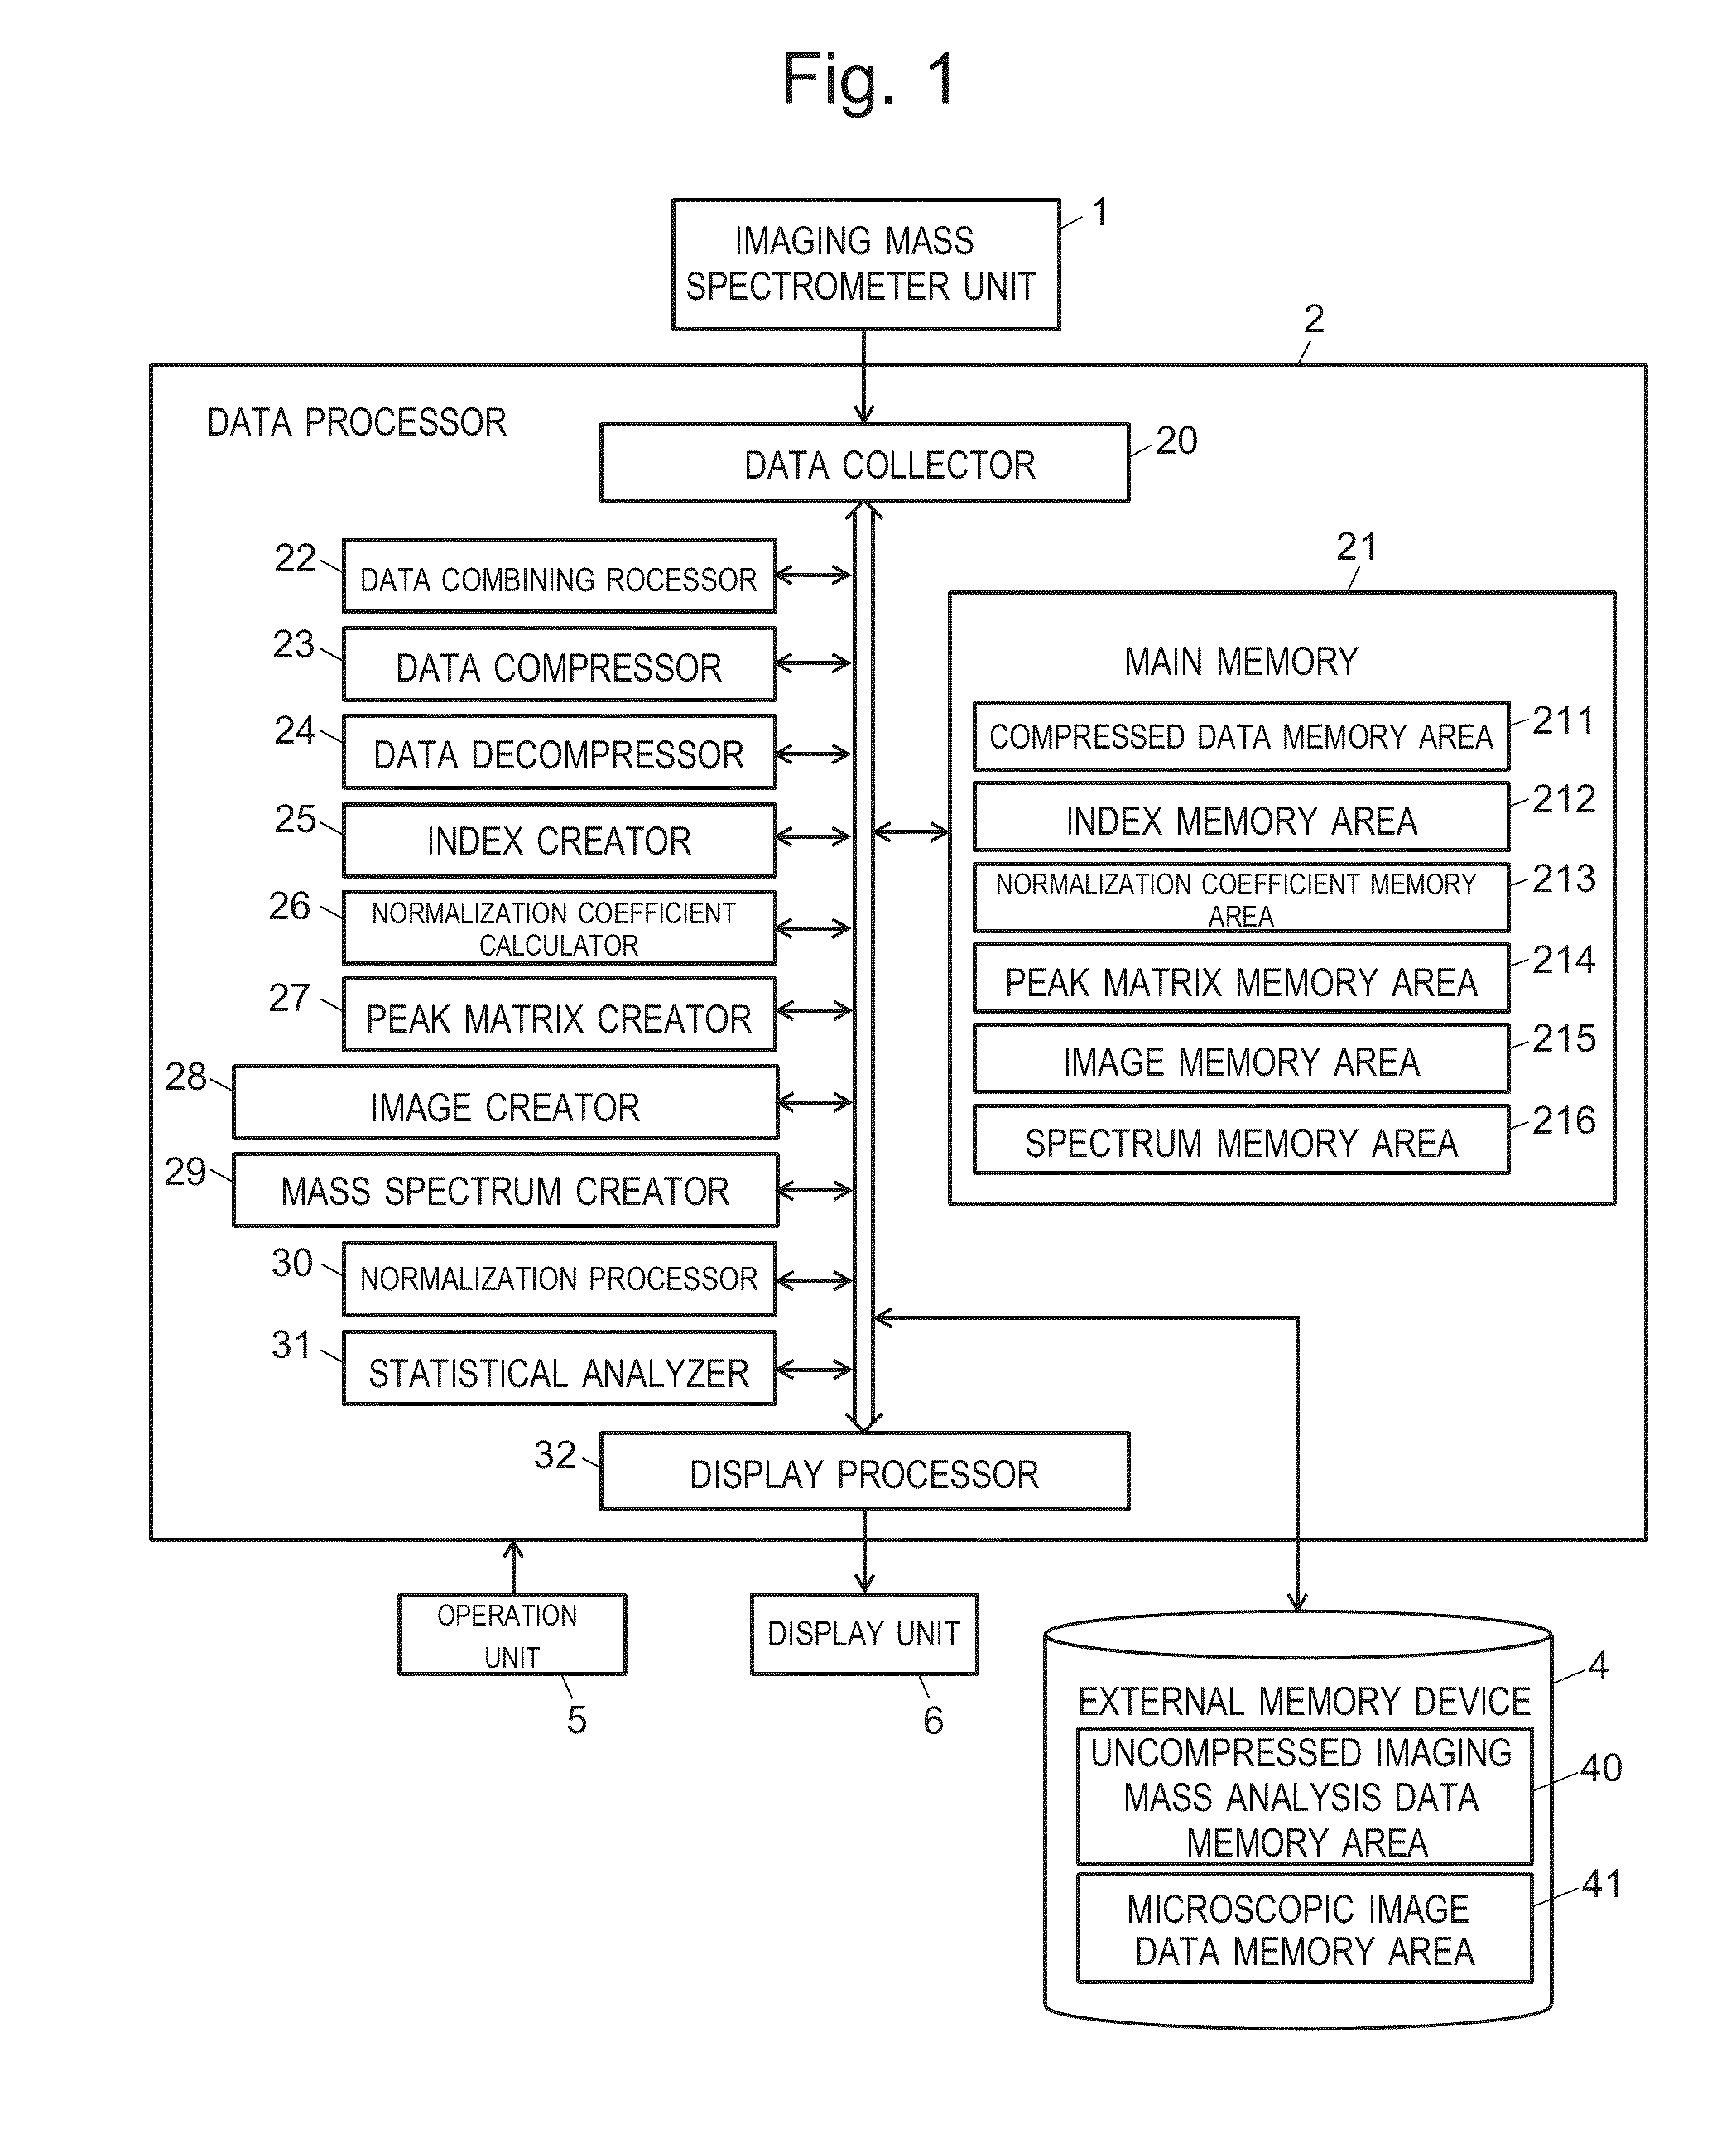
[0073]FIG. 1 is a configuration diagram showing a main part of an imaging mass spectrometer system capable of implementing the imaging mass analysis data processing method that is an embodiment of the present invention.

[0074]The imaging mass spectrometer system includes: an imaging mass spectrometer unit 1 for performing a mass analysis on each of a large number of two-dimensional measurement points on a sample and obtaining mass spectrum data within a predetermined mass-to-charge ratio range for each of the measurement points; a data processor 2 for performing various types of data processing (to be described later) on the obtained data; a large-capacity external memory device 4 (for example, a hard disk drive (HDD) and a solid state drive (SSD)) for storing the ra...


PUM


Abstract

If spatial measurement point intervals in imaging mass analysis data of two samples to be compared are different and the degrees of spatial distribution spreading of substances are compared, one of the data is defined as a reference, the measurement point intervals in the other of the data are redefined so as to be equalized to the reference, and a mass spectrum at each virtual measurement point set as a result of the redefinition is obtained through interpolation or extrapolation based on a mass spectrum at an actual measurement points. If the arrays of the m/z values of mass spectra are different for each sample, the m/z value positions of the mass spectrum in one of the data are defined as a reference, and the intensity values corresponding to the reference m/z values are obtained through interpolation or extrapolation for the mass spectrum of the other of the data.

Description

TECHNICAL FIELD[0001]The present invention relates to a data processing method suitably applicable to an imaging mass spectrometer capable of obtaining an image showing the distribution of the ion signal intensity at a specific mass-to-charge ratio or within a mass-to-charge ratio range on a sample (such an image is hereinafter called a “mass analysis result image”), and relates to an imaging mass spectrometer using the data processing method.BACKGROUND ART[0002]Mass spectrometric imaging is a technique for examining the distribution of a substance having specific mass by performing a mass analysis on each of a plurality of small measurement areas (micro-areas) within a two-dimensional region on a sample, such as a piece of biological tissue. This technique is increasingly applied to, for example, discovery and development of new medicines, discovery of biomarkers, and investigation on the causes of various diseases. Mass spectrometers designed for mass spectrometric imaging are gen...

Claims


Application Information

Patent Timeline
Patent Type & Authority Applications(United States)
IPC IPC(8): H01J49/00
CPCH01J49/0004H01J49/0036
Inventor IKEGAMI, MASAHIROKAJIHARA, SHIGEKI
Owner SHIMADZU CORP
Why Eureka
Try Eureka