
Graphical Process Variable Trend Monitoring, Predictive Analytics and Fault Detection in a Process Control System

a technology of process variable and trend monitoring, applied in the field of process control system, can solve the problems of difficult for a user to see and understand the real-time data itself, much less the temporal field, and the display of real-time process variable values via the p&id does not effectively support the detection of changes in these real-time values over tim

Active Publication Date: 2016-02-11
FISHER-ROSEMOUNT SYST INC
View PDF11 Cites 30 Cited by
  • Summary
  • Abstract
  • Description
  • Claims
  • Application Information

AI Technical Summary

Benefits of technology

The process control monitoring system described in this patent text uses graphic trend symbols to help operators detect and monitor changes in process variables in a plant. The system collects and displays data from field devices as graphic elements, which may show attributes like rate of change, direction of change, change desirability, or current value information. The system also includes a navigation pane that provides context and helps operators quickly navigate through the plant to monitor different parts and levels. This makes it easier for operators to quickly identify and respond to changes in process variables.

Problems solved by technology

Unfortunately, however, the display of real-time values in P&IDs does not effectively support the detection of changes in these real-time values over time.
In other words, the display of real-time process variable values via the P&ID does not enable the user of the P&ID to easily detect or understand trends within the real-time data being depicted.
In fact, because the P&IDs tend to cram real-time values within the screen spaces not used by the equipment depicted in the quasi-spatially realistic display, it may be difficult for a user to see and understand the real-time data itself, much less the temporal trends within that data.
Besides operating to hide real-time data within more graphical clutter, these more complex P&IDs typically include inconsistent layouts (from P&ID to P&ID), making locating the real-time parameter values harder and harder for users who must switch between multiple different P&IDs.
In effect, these recent trends merely exacerbate clutter within the P&IDs, which further slows searches for process parameter data made by the users.
As a result, an operator using a P&ID to monitor a process, may quickly lose focus in the vast amount of information presented in the P&ID or may miss important process variable trends or patterns emerging within the process because the operator is presented with such an expansive amount of detailed data.
Moreover, this immense amount of data, especially in a large, complex process plant, is difficult to view, much less to absorb and to understand using only a P&ID and (potentially other supporting graphs or diagrams, such as process variable trend graphs, accessible via the P&ID).
As a result, the operator may exert unnecessary time and energy in locating and comparing a current value of a process variable with a setpoint value, a desired value, etc.
Moreover, by not detecting or identifying problems during the process more quickly, such as a worsening condition of a particular process variable, etc., the operator may be slow to react to correct a potential runaway process that could result in serious injuries, property damage, environmental contamination, or even death.
Additionally, navigation within the P&ID of a large-scale, complex process plant may pose difficulties for the operator.
Because of the hierarchical nature and the large scope of process plants, navigating to different portions or areas of the process plants via the P&ID may be confusing, difficult, and counterintuitive.
Depending on the current hierarchical level or detail level of a representation of the process plant that the control operator is viewing via a P&ID, the operator may have trouble properly determining the current location within the representation of the process plant that is displayed within a viewport within the context of the other areas of the process plant.
That is, there is typically no consistent stimulus-response mapping between the navigation hyperlinks and what these hyperlinks lead to, leaving a less experienced operator with an uncertain feeling when navigating through a series of interconnected P&IDs.
Moreover, the hyperlinks provided to the operator are generally only for navigation within a current hierarchical level and do not provide additional options for navigation throughout the locations and hierarchy within the representation of the process plant.
In other words, the P&ID lacks the capability for the operator to “drill down” into more detailed, hierarchical levels while maintaining the context of the entire representation of the process plant.
For example, if a different area of the representation of the process plant requires immediate attention of the operator, such as a process variable in the different area that is leading to a runway condition of the process, the operator may have trouble determining, and subsequently navigating to, the location of the different area in the process plant relative to the current location of the process plant.
As a result, the operator may endure unpredictable navigation (e.g., trial and error clicking, etc.) during a time critical incident which may lead to poor decision making of the operator through unnecessary stress and frustration.
Likewise, if the operator does successfully navigate to the location of the different area of the identified problem, the control operator may still need to contend with attempting to obtain the proper level of detail of the process control variables.
At too high of detail level, the operator may possess too little process control information in viewing only the P&ID.
Moreover, the detailed information sources may not be integrated with the P&ID and may require the control operator to view information of various levels of detail that is distributed across multiple separate windows or screens.
Possessing too few or too many details may lead to the control operator making incomplete or slow decisions, respectively, that may cause serious consequences during a critical incident or period.

Method used


Image

  • Graphical Process Variable Trend Monitoring, Predictive Analytics and Fault Detection in a Process Control System
  • Graphical Process Variable Trend Monitoring, Predictive Analytics and Fault Detection in a Process Control System
  • Graphical Process Variable Trend Monitoring, Predictive Analytics and Fault Detection in a Process Control System

Examples


Embodiment Construction

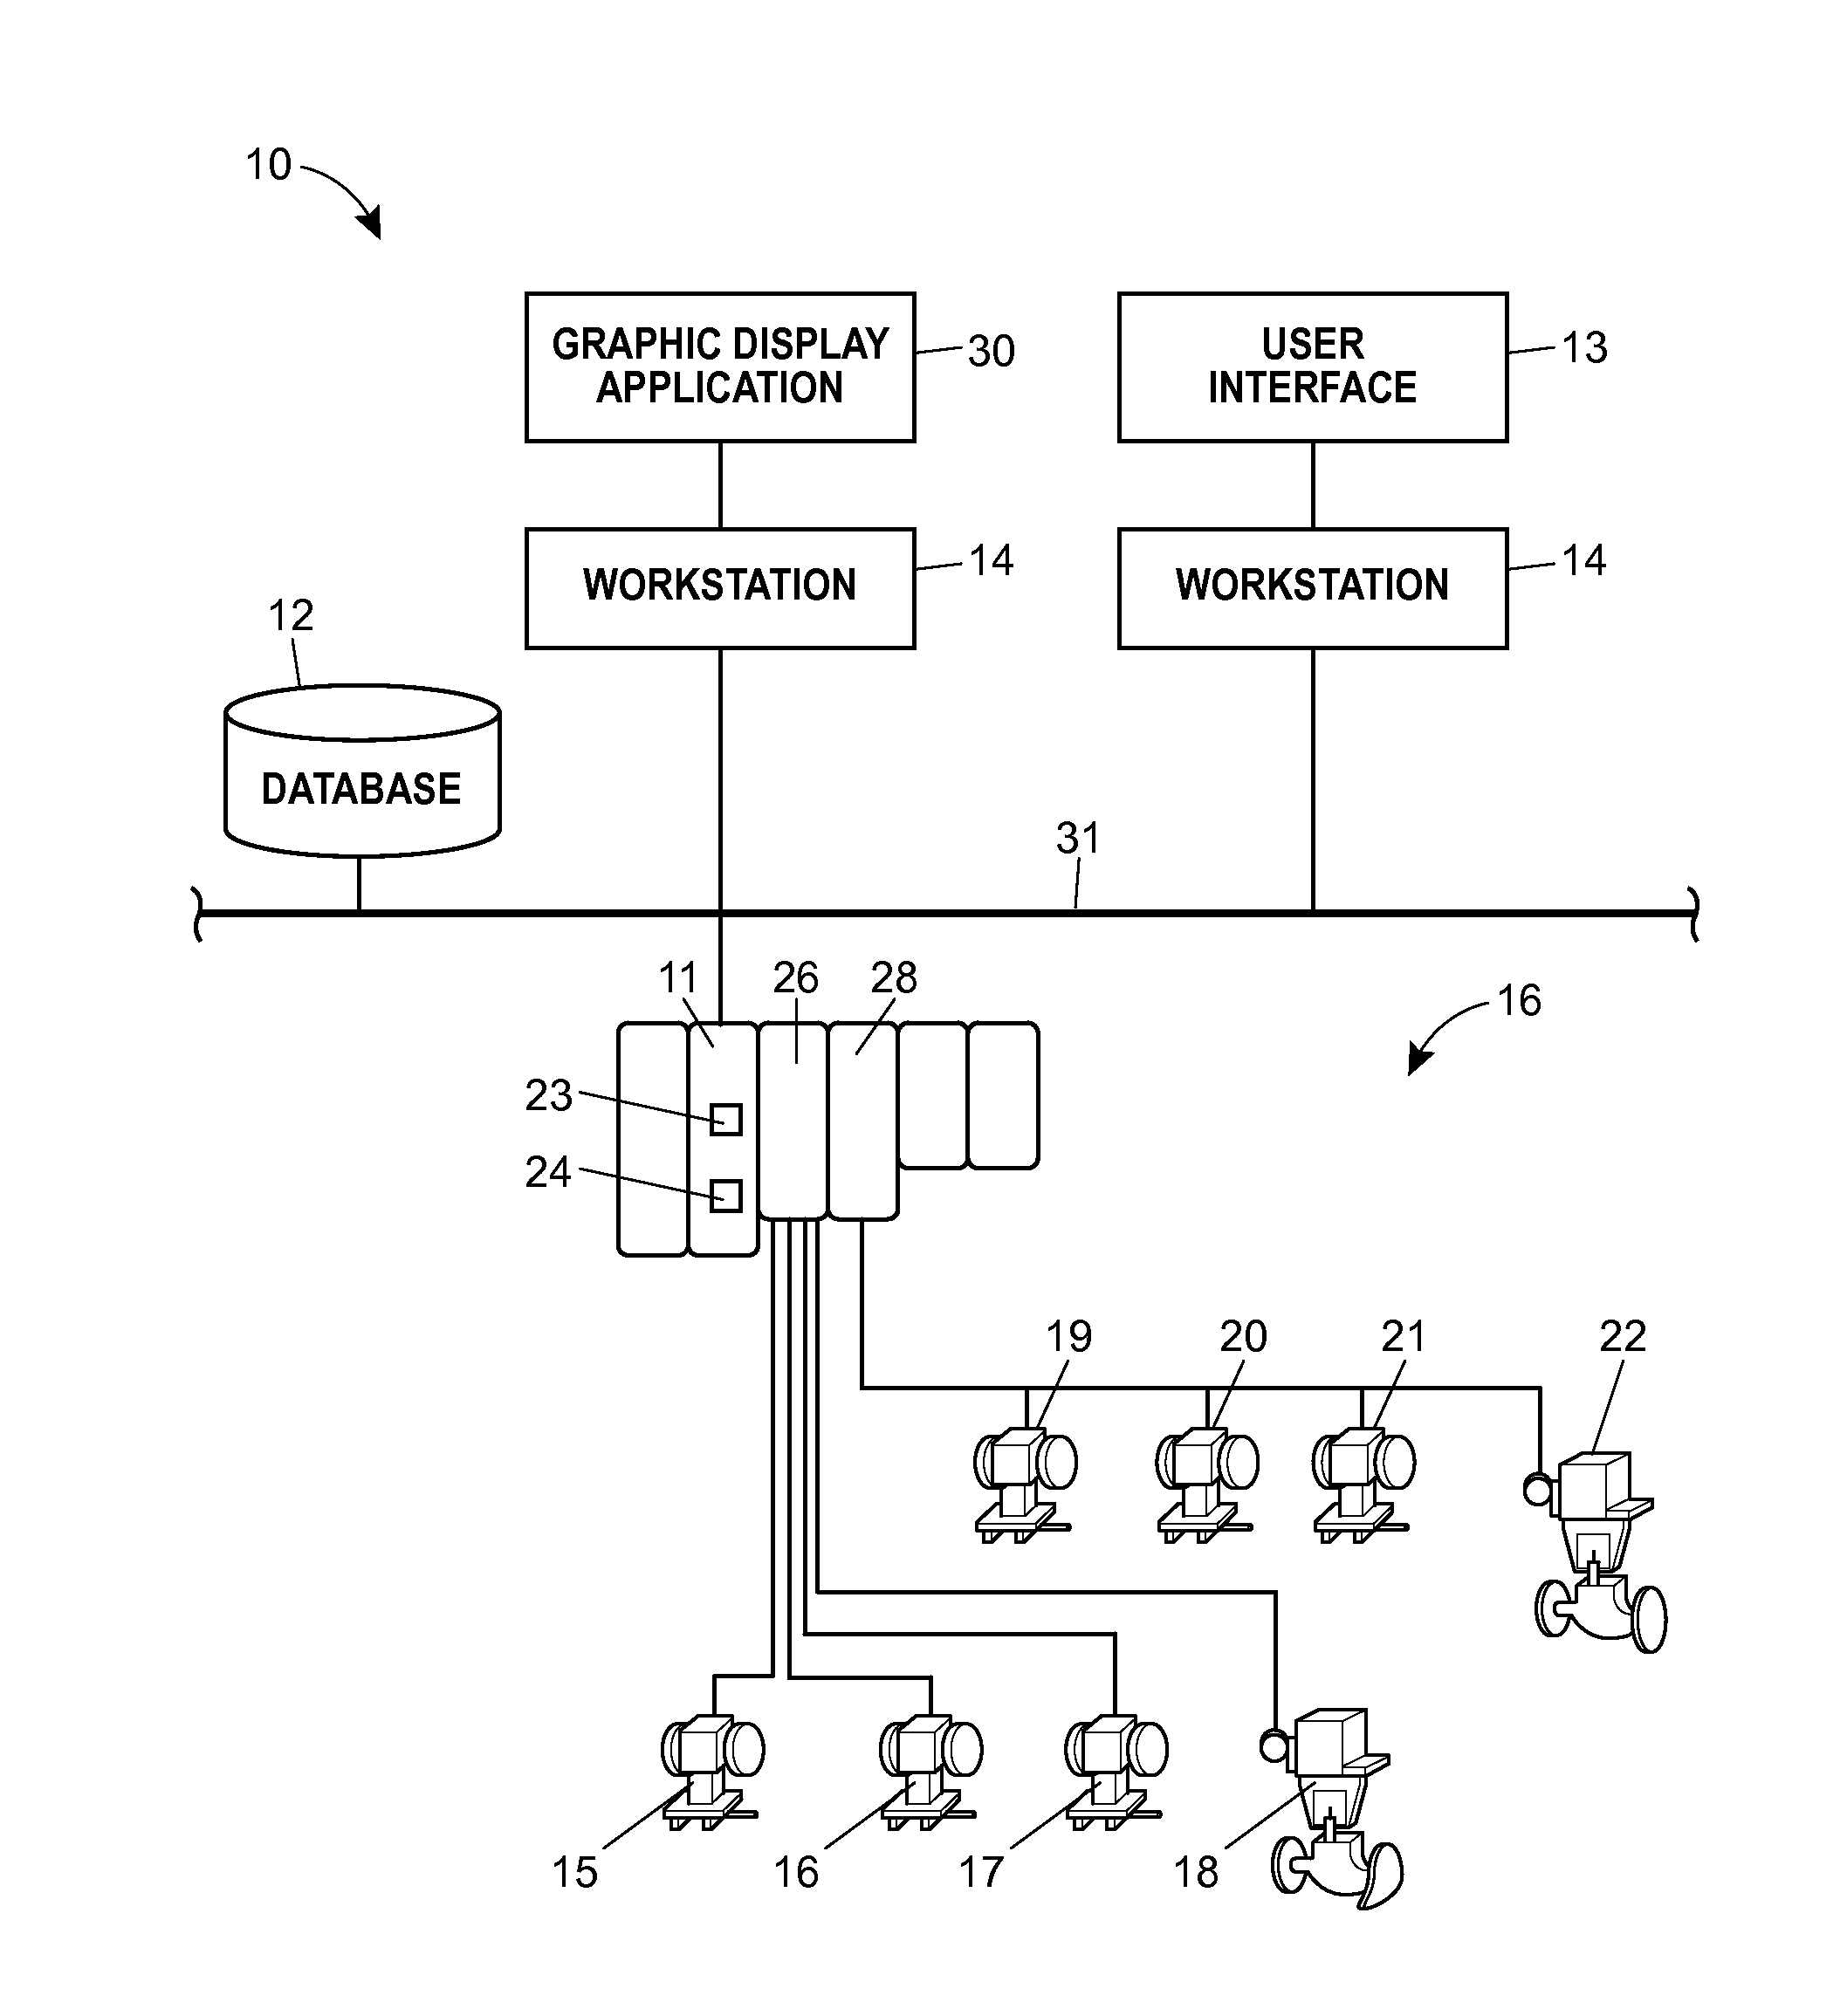
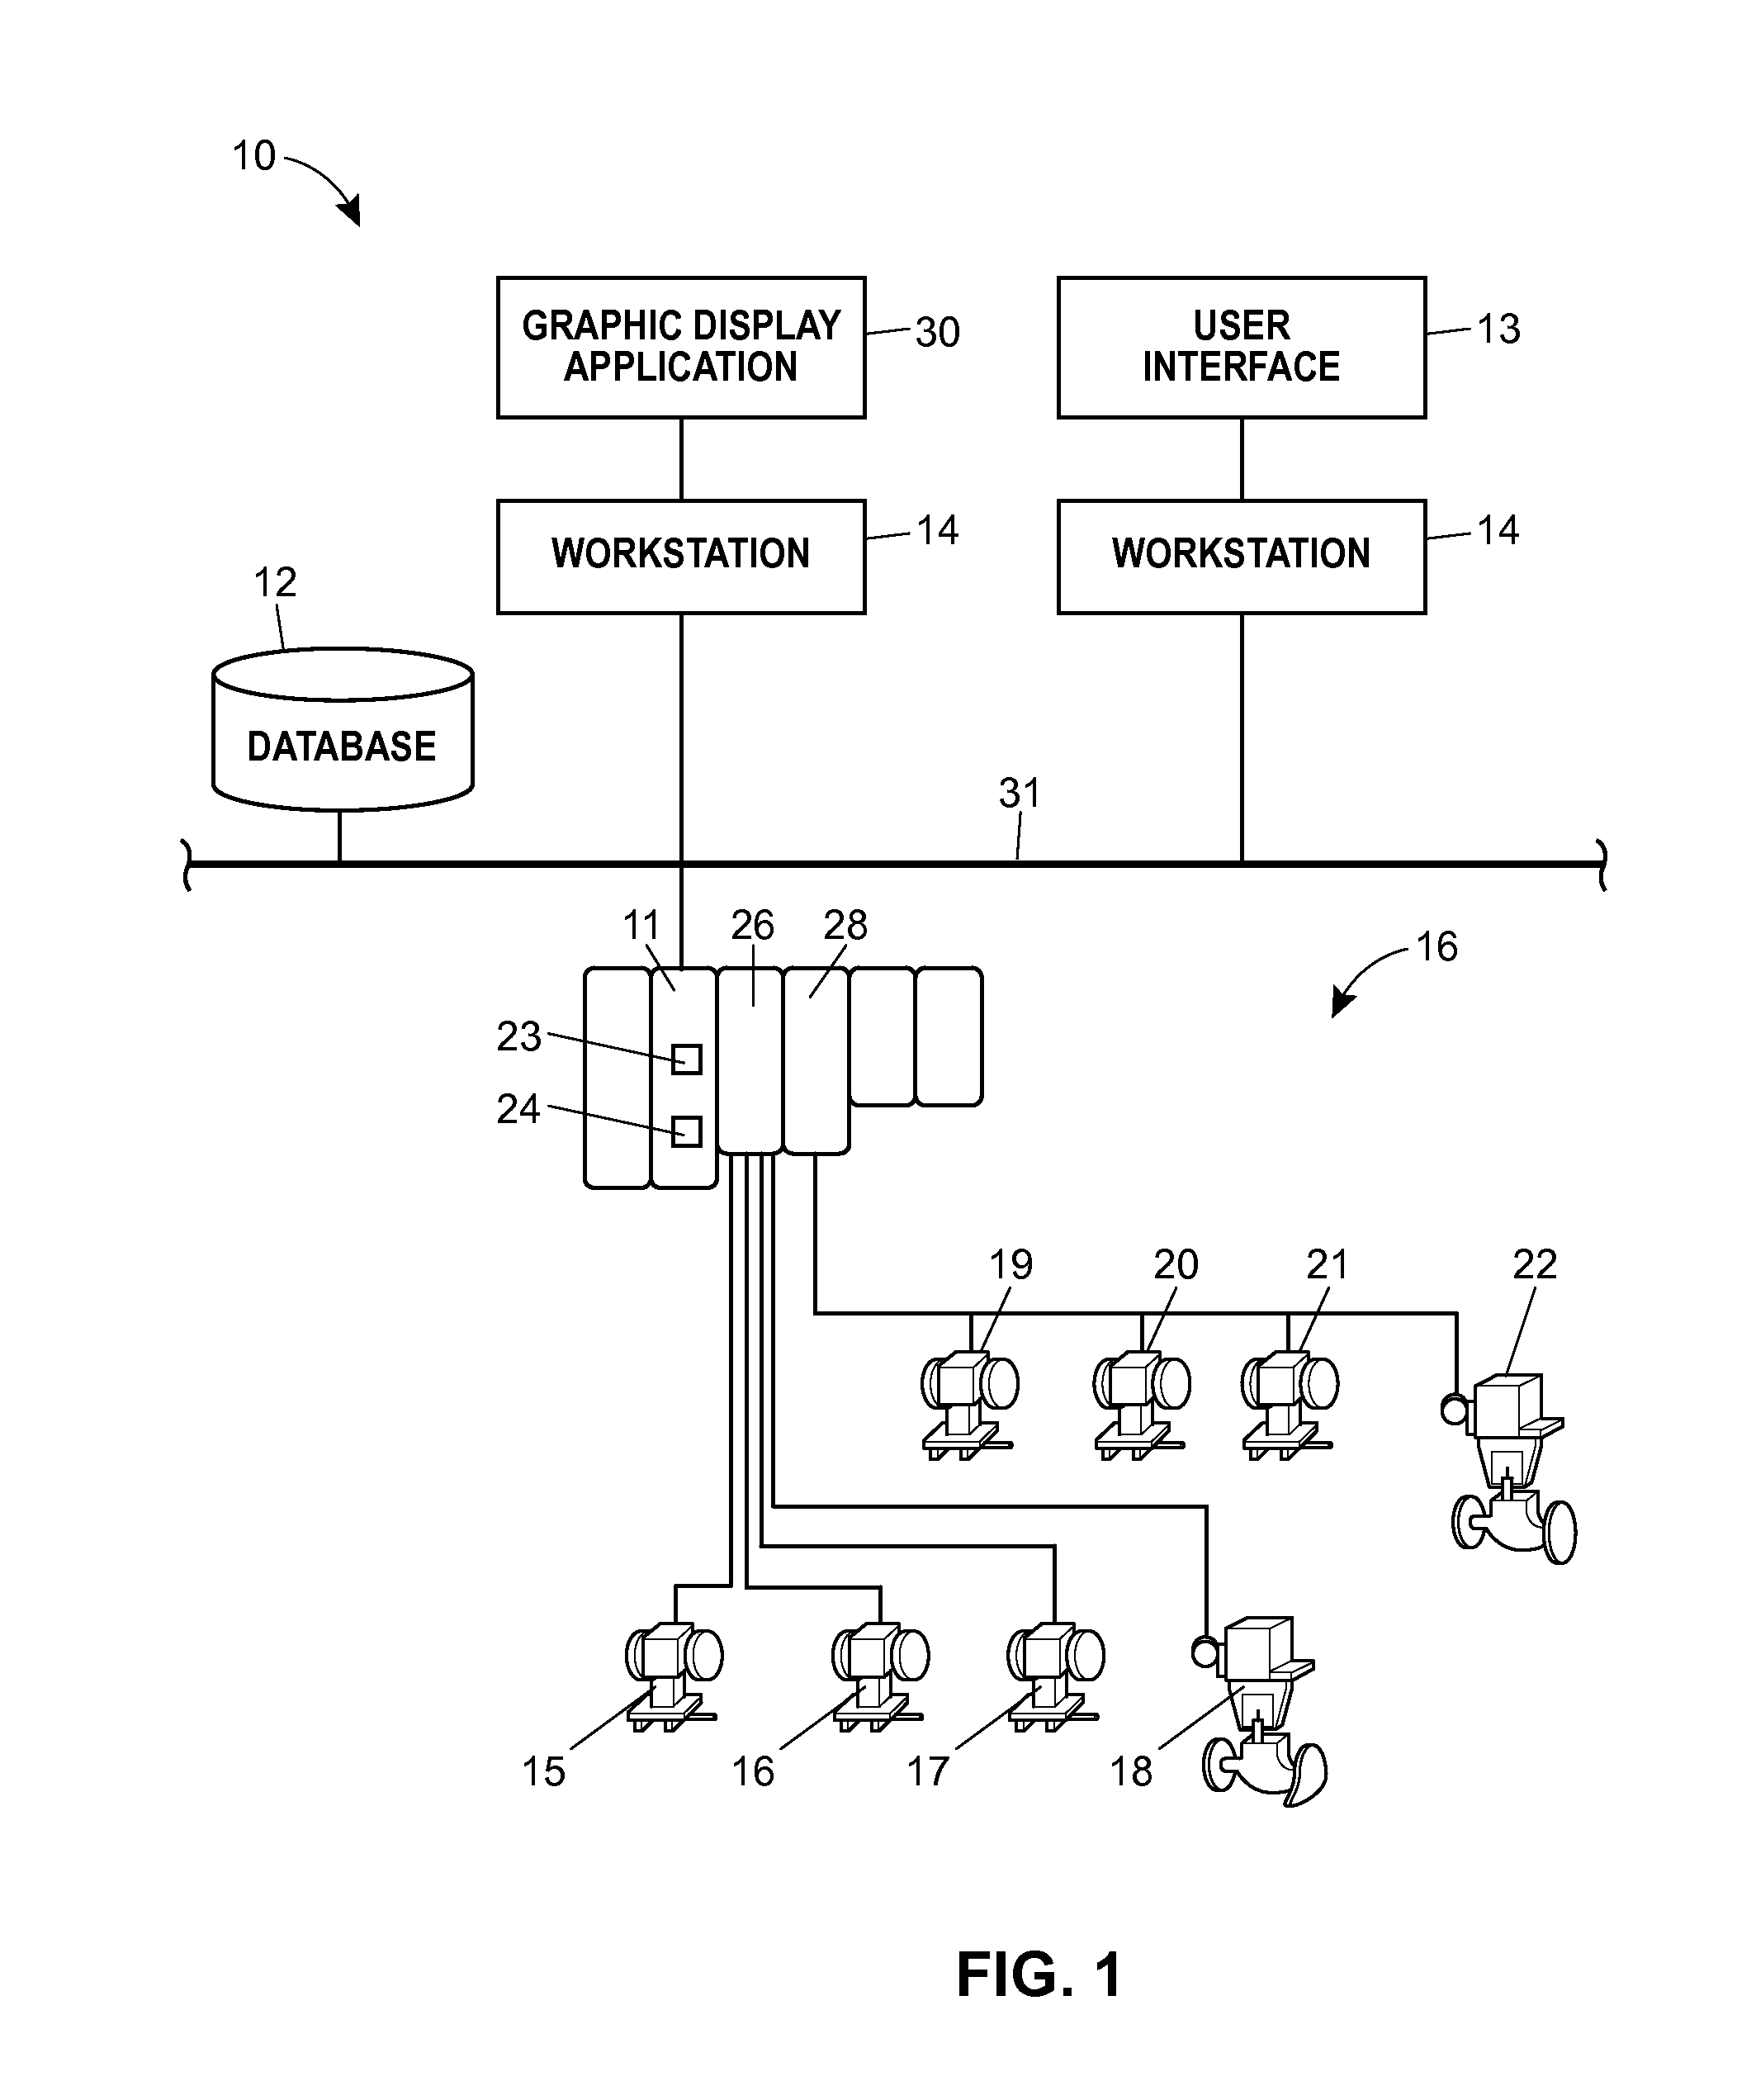
[0041]A process control monitoring system 10 illustrated in FIG. 1 that may be used to implement and to display a graphic trend symbol described herein includes a process controller 11 connected to a database 12 and to one or more host workstations or computers 14 (which may be any type of personal computers, workstations, etc.) via a network bus 31, such as a Ethernet communication network for example. Each workstation 14 may include a memory for storing a plurality of applications including, for example, a graphical display application 30 and may be communicatively coupled to a user interface 13. The controller 11 is also connected to field devices 15-22 via input / output (I / O) cards 26 and 28. The database 12 may be any desired type of data collection unit having any desired type of memory and any desired or known software, hardware or firmware for storing data. The system 10 may also store process variable values or process variable data within the database 12 for use in generati...


PUM


Abstract

A process control monitoring system for a process control plant uses graphic trend symbols to assist in detecting and monitoring trends of process variables within the process control plant. A graphic display application within the process control monitoring system may implement and display each graphic trend symbol to graphically indicate or encapsulate current trend and value information of a process variable within the process control plant. The graphic display application may display the graphic trend symbol in a spatially realistic location within a graphical representation of the process control plant while maintaining the hierarchical structure or each hierarchical level of the process plant. The graphic display application may also include a navigation pane and a zoom feature that enable a user to quickly drill down through tend data to obtain more information and to support problem identification and diagnosis tasks.

Description

RELATED APPLICATIONS[0001]This application is a regular filed application that is a Continuation-In-Part of U.S. patent application Ser. No. 14 / 207,227 entitled “Graphical Process Variable Trend Monitoring for a Process Control System” which was filed on Mar. 12, 2014, which, in turn, claims priority to and the benefit of the filing date of U.S. Provisional Patent Application Ser. No. 61 / 793,282, entitled “Graphical Process Variable Trend Monitoring for a Process Control System” which was filed on Mar. 15, 2013, and is a Continuation-In-Part of U.S. patent application Ser. No. 13 / 859,714, entitled “Systems and Methods to Graphically Display Process Control System Information” which was filed on Apr. 9, 2013, the entire disclosures of each of which are hereby expressly incorporated by reference herein.TECHNICAL FIELD[0002]The present disclosure relates generally to process control systems and, more particularly, to monitoring trends of process variables and hierarchical, graphical na...

Claims


Application Information

Patent Timeline
Patent Type & Authority Applications(United States)
IPC IPC(8): G06T11/20G05B19/418G06F3/0481G06F3/0482G06F3/0484
CPCG06T11/206G05B19/41885G06F3/04817G06F2203/04806G06F3/04842G05B2219/50065G06F3/0482G05B23/0216G05B23/0232
Inventor NIXON, MARK J.BELL, NOELSMALLMAN, HARVEY S.RIETH, CORY A.
Owner FISHER-ROSEMOUNT SYST INC
Learn More