Maldi-tof mass spectrometers with delay time variations and related methods
- Summary
- Abstract
- Description
- Claims
- Application Information
AI Technical Summary
Benefits of technology
Problems solved by technology
Method used
Image

Examples
examples
[0171]FIG. 10A is a graph of calculated resolving power for different focus masses and different length flight tubes. FIG. 10B is a graph of focus mass (kDa) versus calculated mean resolving power for different flight tube lengths.
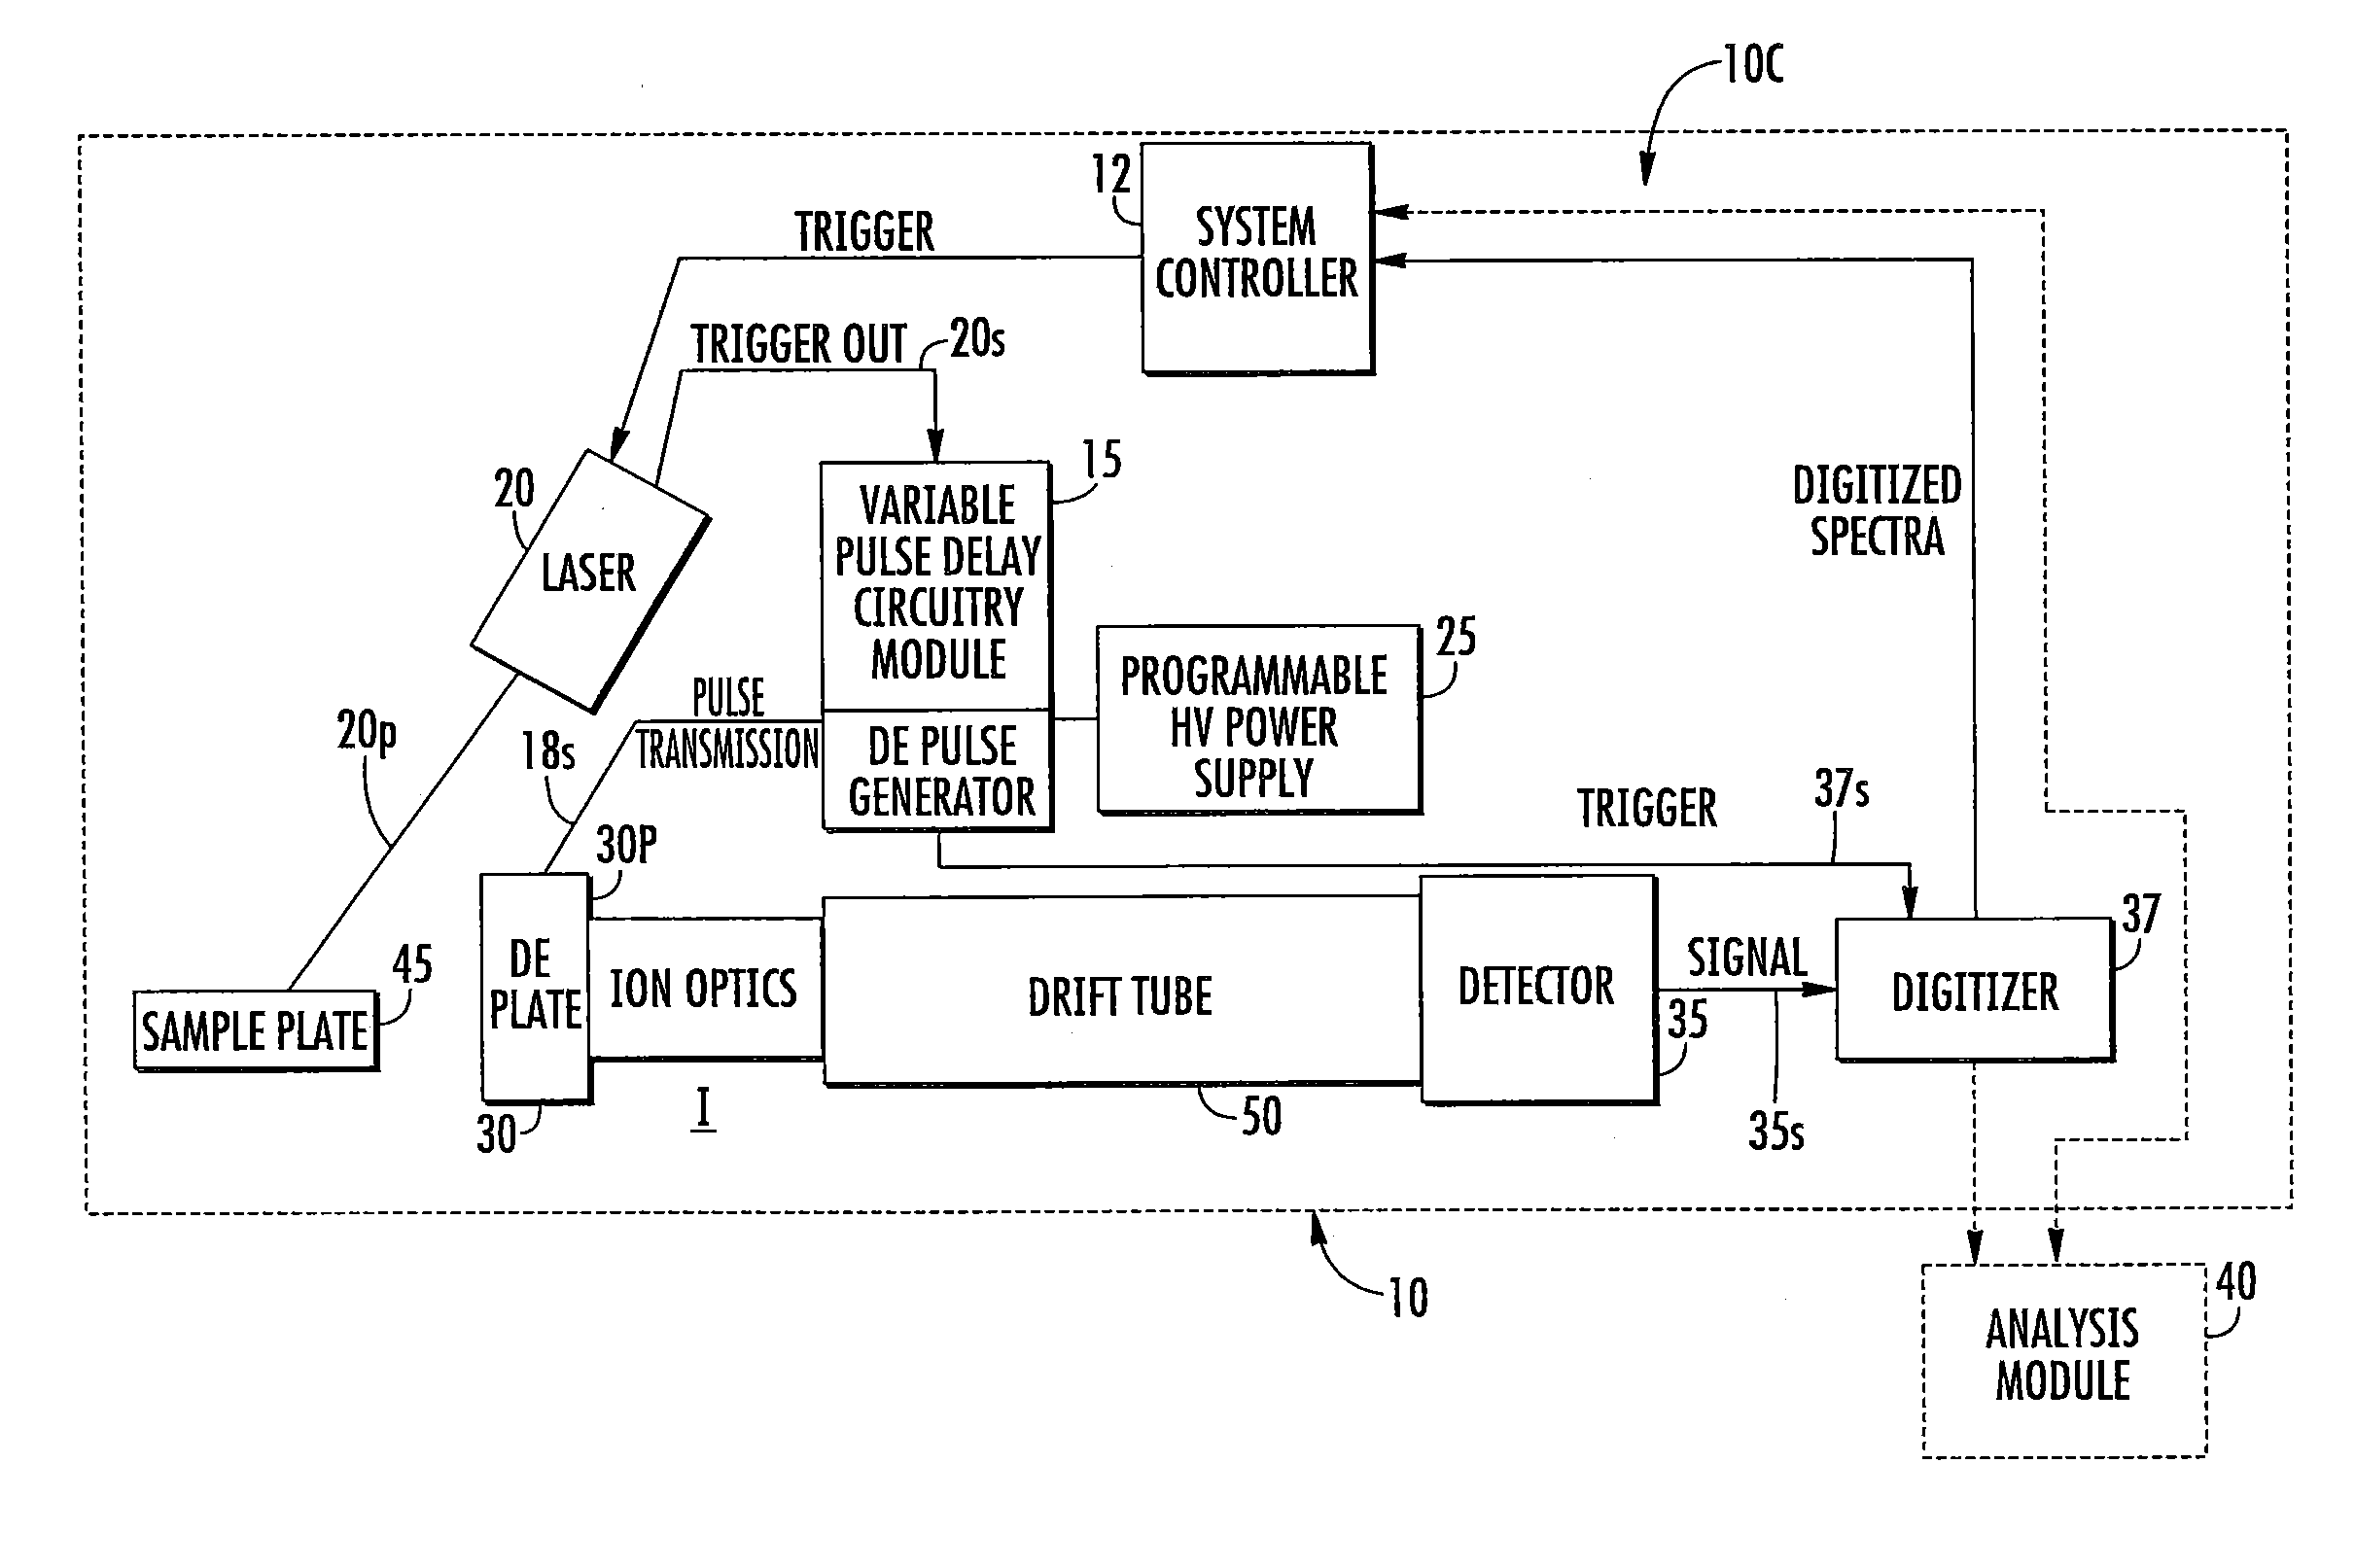
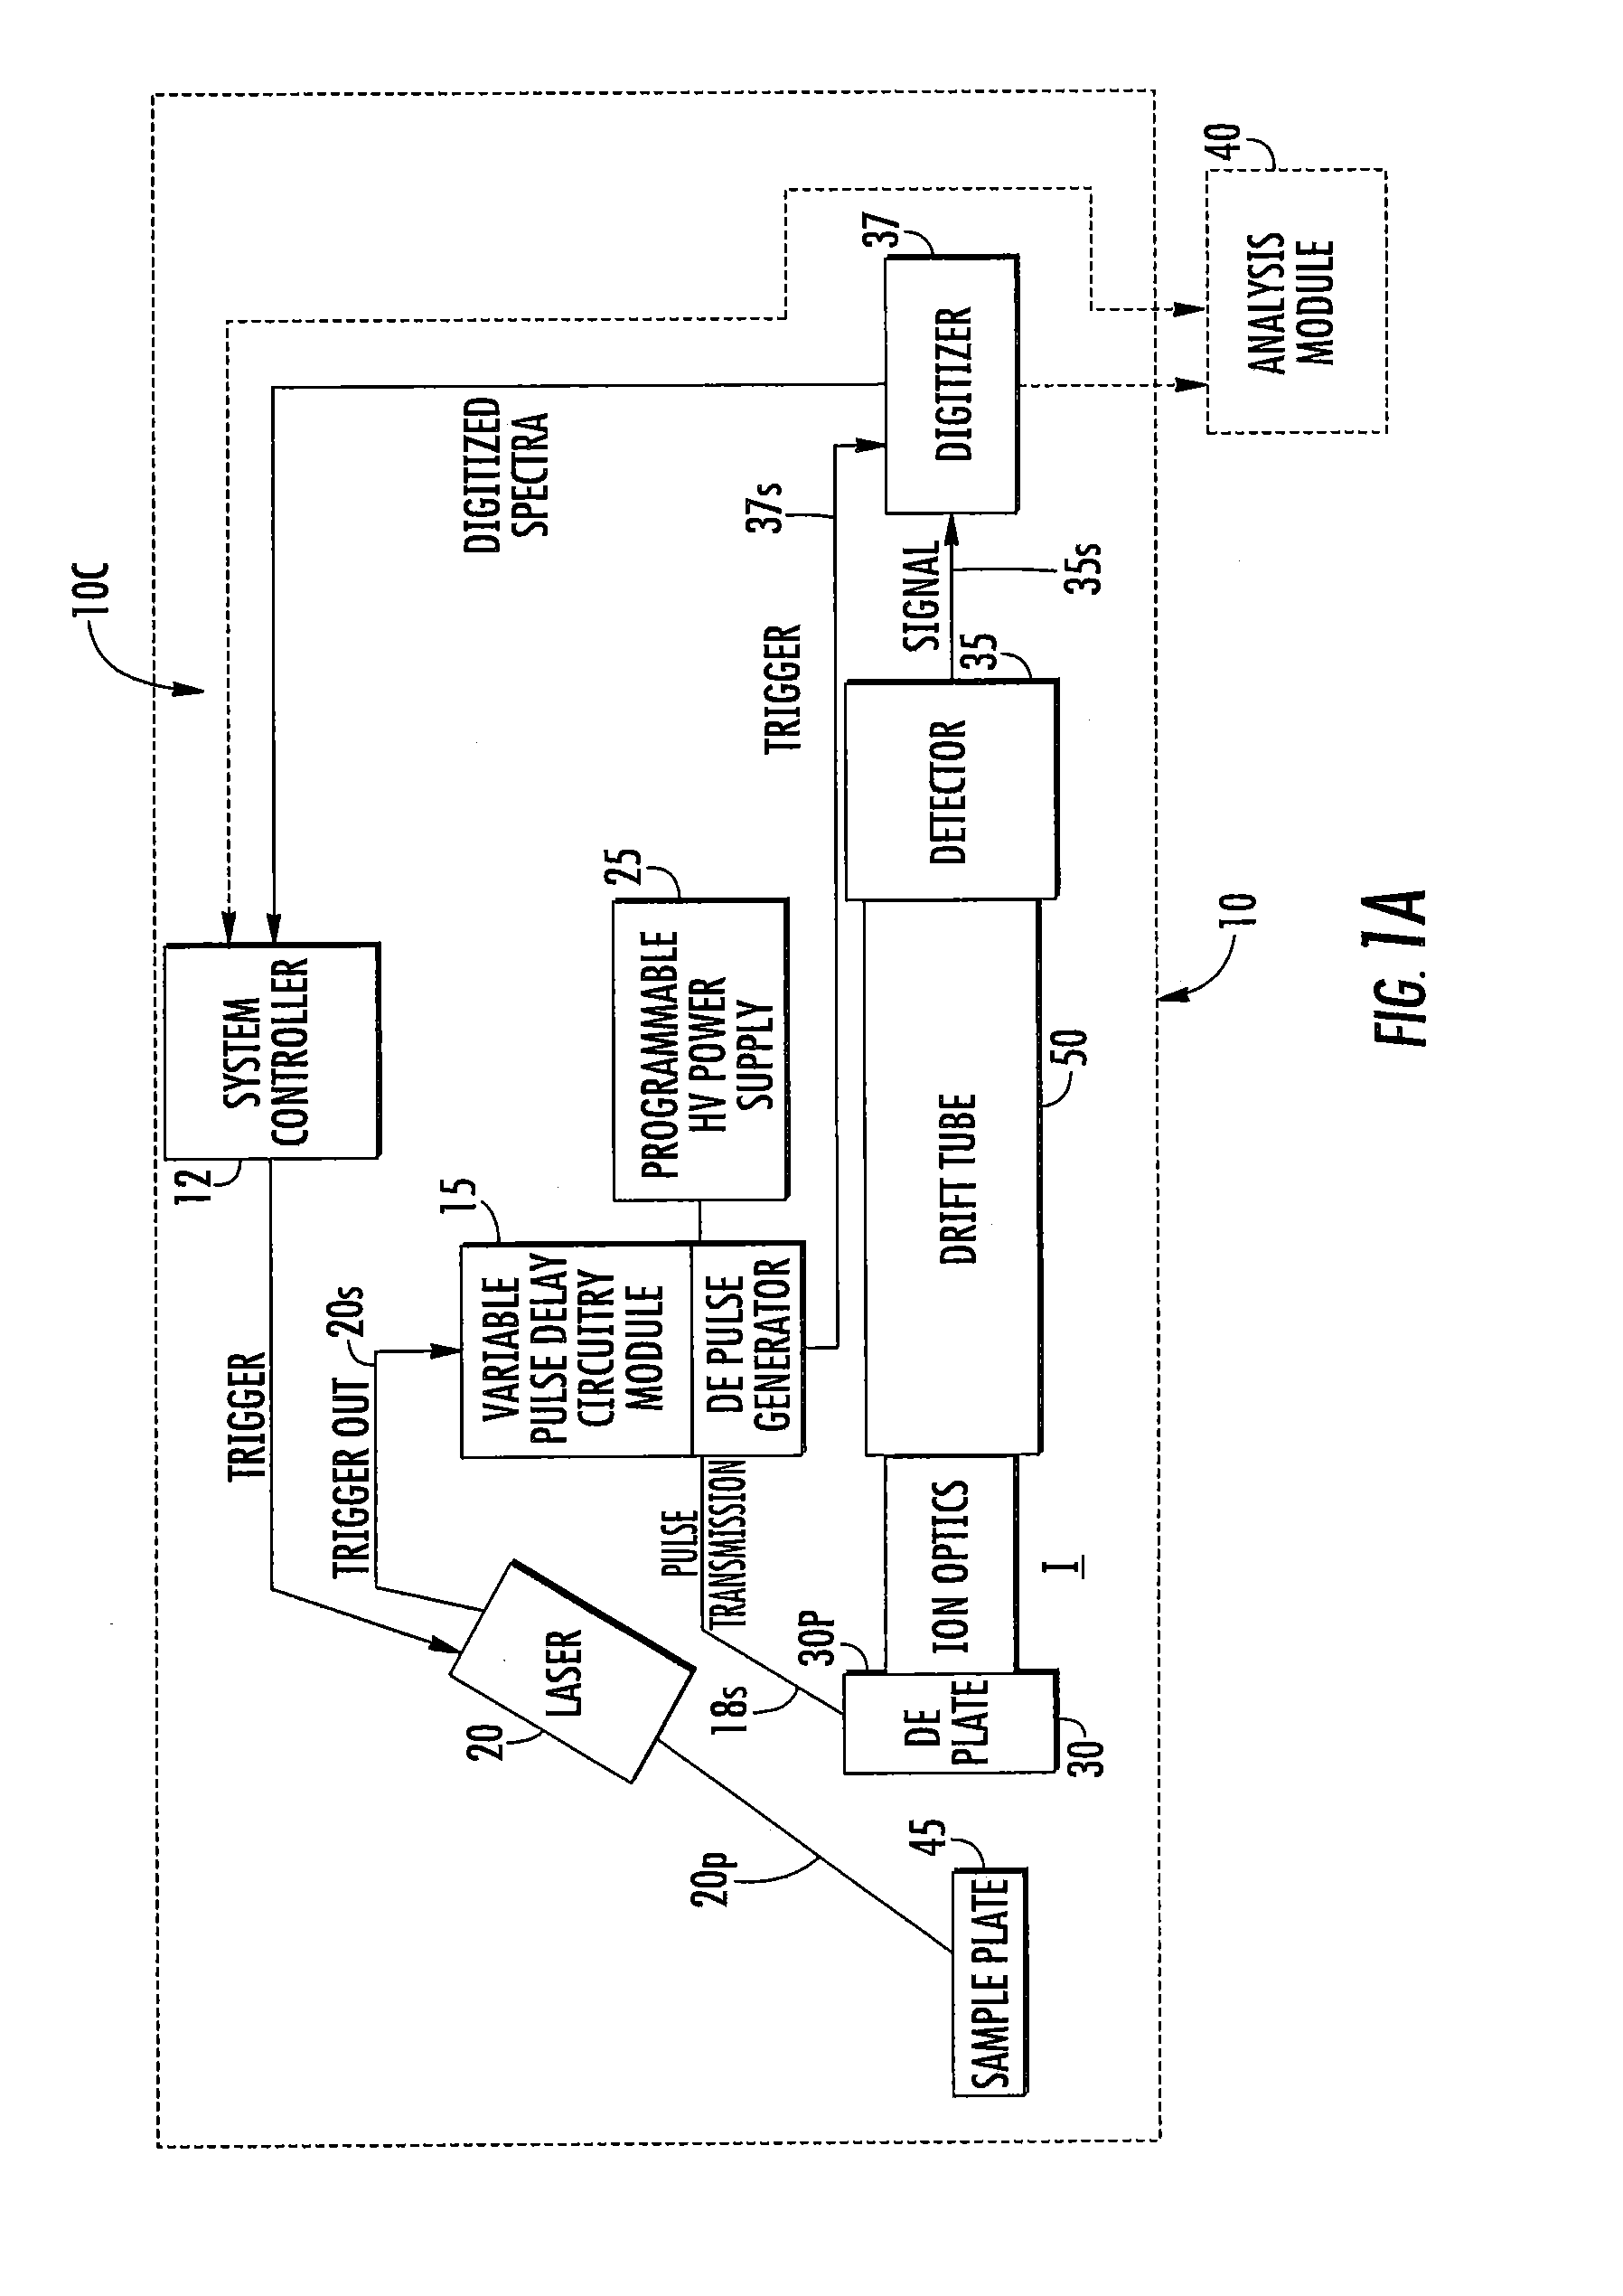
[0172]FIG. 11 is a schematic diagram of a TOF system. Theoretically calculated mean resolving power is higher for the 1.6 m flight tube but makes the footprint of the MS system larger than desired for most table top applications. It is contemplated that the variable extractions to vary the focus mass for a given accelerating voltage and extraction voltage as described above may provide a way to take advantage of higher peak resolving powers for a shorter flight tube, such as, by way of example only, a 0.8 m length flight tube.
[0173]The following equations / assumptions can be used to describe theoretical operation of an MS system for calculating resolving power such as shown in FIGS. 10A / 10B.
[0174]do=5 mm
[0175]d1=10 mm
[0176]y=10
[0177]Va=20 kV
[0178]δx=0.025 m...
PUM
 Abstract
Description
Claims
Application Information