

System And Method For In Vivo Detection Of Fluorescence From An Eye
a fluorescence detection and eye technology, applied in the field of fluorescence imaging and age-related macular degeneration detection, can solve problems such as untreatable vision loss and blindness
- Summary
- Abstract
- Description
- Claims
- Application Information
AI Technical Summary
Benefits of technology
Problems solved by technology
Method used
Image

Examples
example i
Drusen Spectra from 2 Excitation Datasets
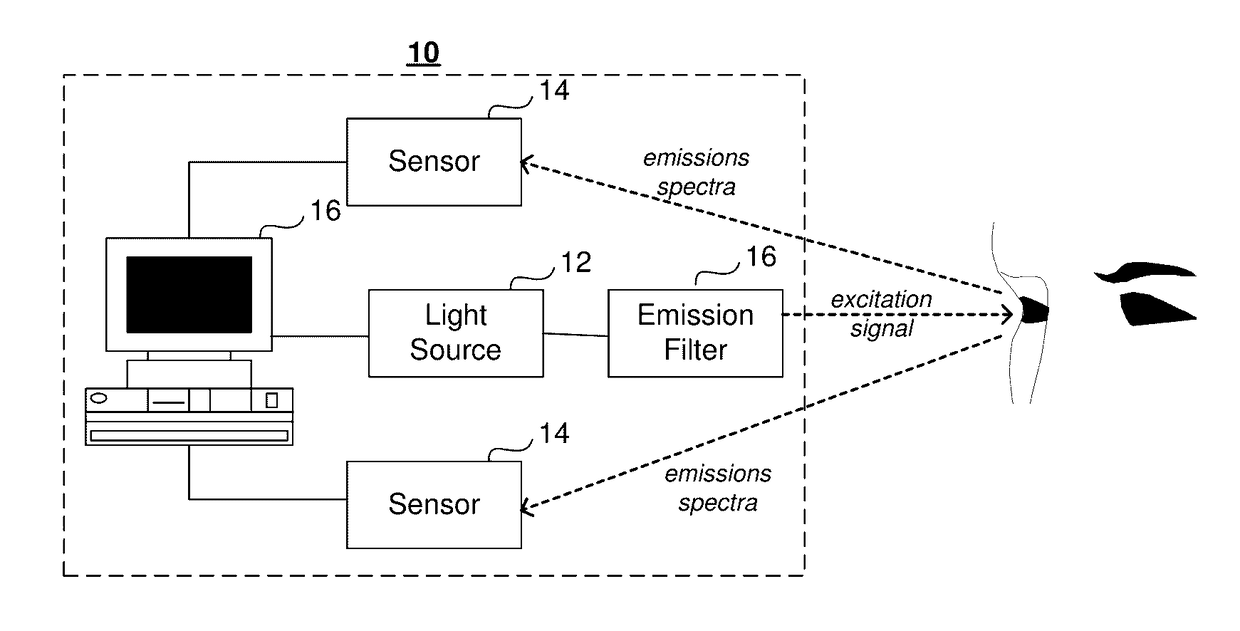
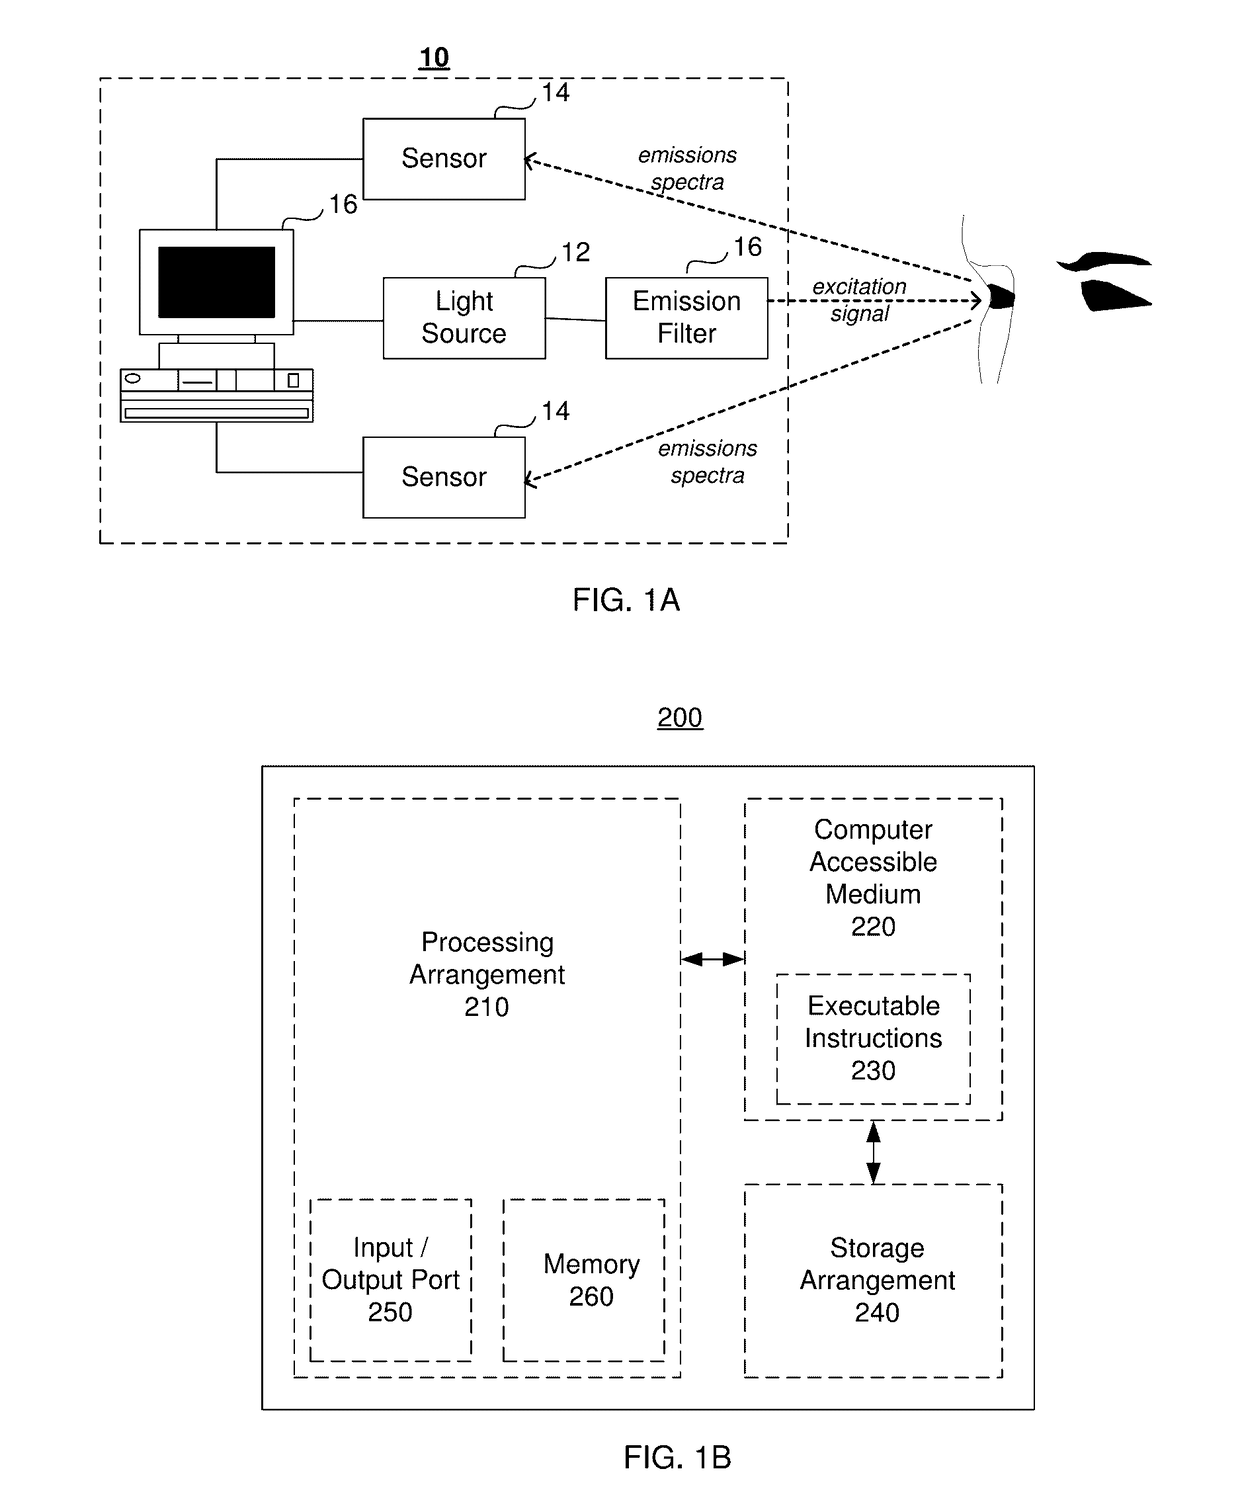
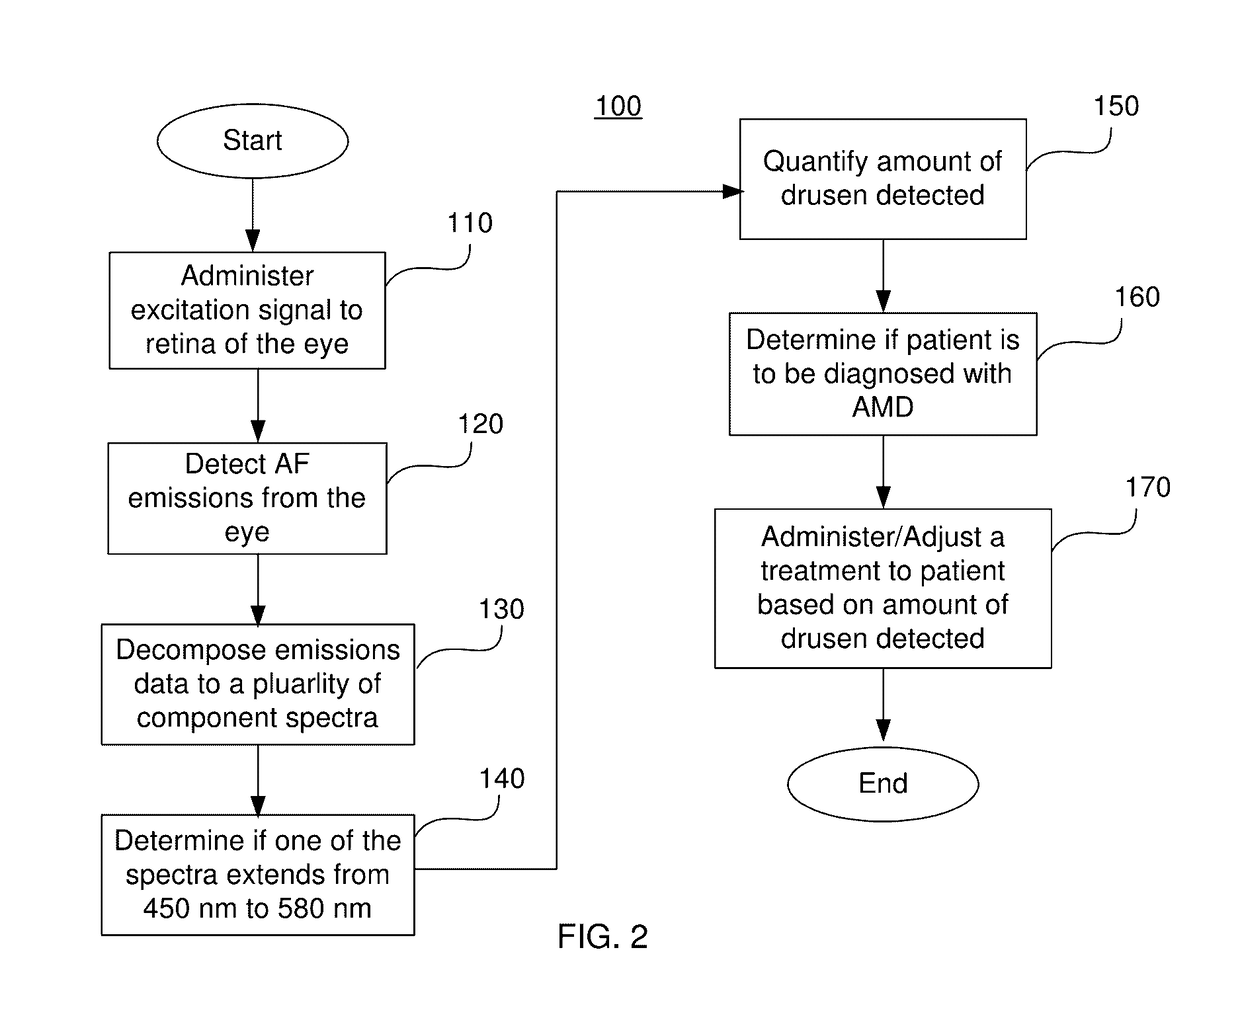
Step 1—Administration of Excitation Signal and Detection of Electromagnetic Emissions Spectrum
[0055]The autofluorescence spectrum of flatmounts of human RPE attached to Bruch's membrane (RPE / BrM) without any retinal pathology was acquired and measured. From chorioretinal tissue, retina and choroid were gently removed to prepare RPE / BrM flat mounts from 5 AMD donor tissues. AMD stage was defined at the time of accession using stereo color photographs and the criteria of the Alabama Age-Related Maculopathy Grading System and confirmed by expert evaluation of the entire flat-mounted macula. Some tissues were also examined using ex vivo spectral-domain optical coherence tomography (acquired with the Spectralis OCT, Heidelberg Engineering, Heidleberg, Germany) to confirm the presence of drusen and abnormal hypo / hyperAF.
[0056]Twelve locations with drusen from the 5 AMD donors were imaged using wide-field epi-fluorescence microcopy. A total of 25 dr...
example 2
Drusen Spectra Identified
[0066]Example II focuses on the identification of the drusen spectrum in RPE / BrM tissue excited at 2 different wavelengths: 436 and 480 nm. As provided above, twelve locations with drusen from 5 AMD donors were imaged and analyzed. The two sets of hyperspectral data obtained at each excitation were analyzed using the NTF algorithm to decompose the emission data to 5 component spectra and component localizations in each tissue. Two-dimensional abundance images of the emissions spectrum was obtained at each wavelength. Composite images shown in FIG. 3 annotate tissue components while FIGS. 4A, 5A shows the spectra recovered in the of the donor tissues and FIGS. 4B, 5B show the recovered abundances and spatial origin (localization) of the corresponding spectrum of that same tissue in histologic detail. It is noted that FIGS. 4A, 4B correspond to images A, C from FIG. 3 while FIGS. 5A, 5B correspond to images B, D from FIG. 3.
[0067]Analysis of the spectra recove...
PUM
 Abstract
Description
Claims
Application Information