Low frequency distributed acoustic sensing

a distributed acoustic sensing and low frequency technology, applied in the field of distributed fiber optic sensing, can solve the problems of many vendors removing lower frequency and ultra-low frequency signals from data, and achieve the effect of improving hydrocarbon production

Active Publication Date: 2017-09-14
CONOCOPHILLIPS CO
View PDF2 Cites 26 Cited by
  • Summary
  • Abstract
  • Description
  • Claims
  • Application Information

AI Technical Summary

Benefits of technology

[0019]h) improving hydrocarbon produc

Problems solved by technology

Unfortunately, the use of high frequency DAS signals for analysis, had led to the rem

Method used


Image

  • Low frequency distributed acoustic sensing
  • Low frequency distributed acoustic sensing

Examples


example 1

In-Well Signal During Injection

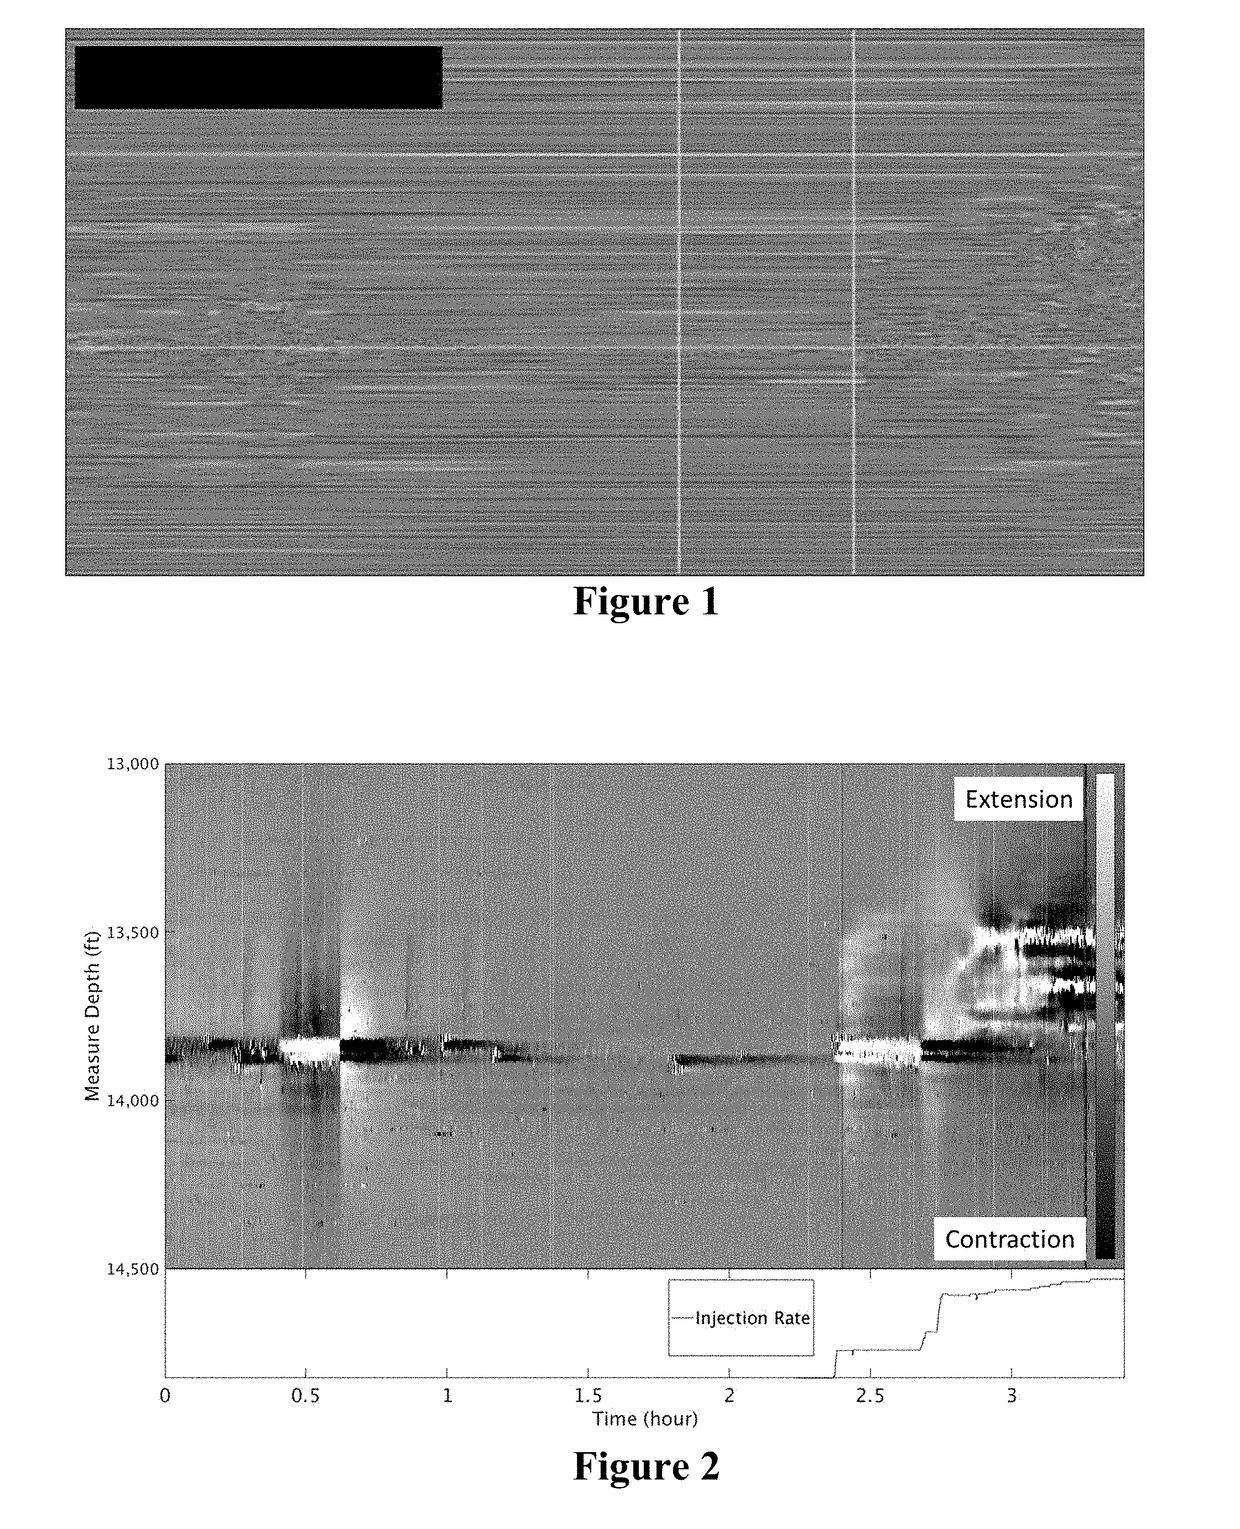
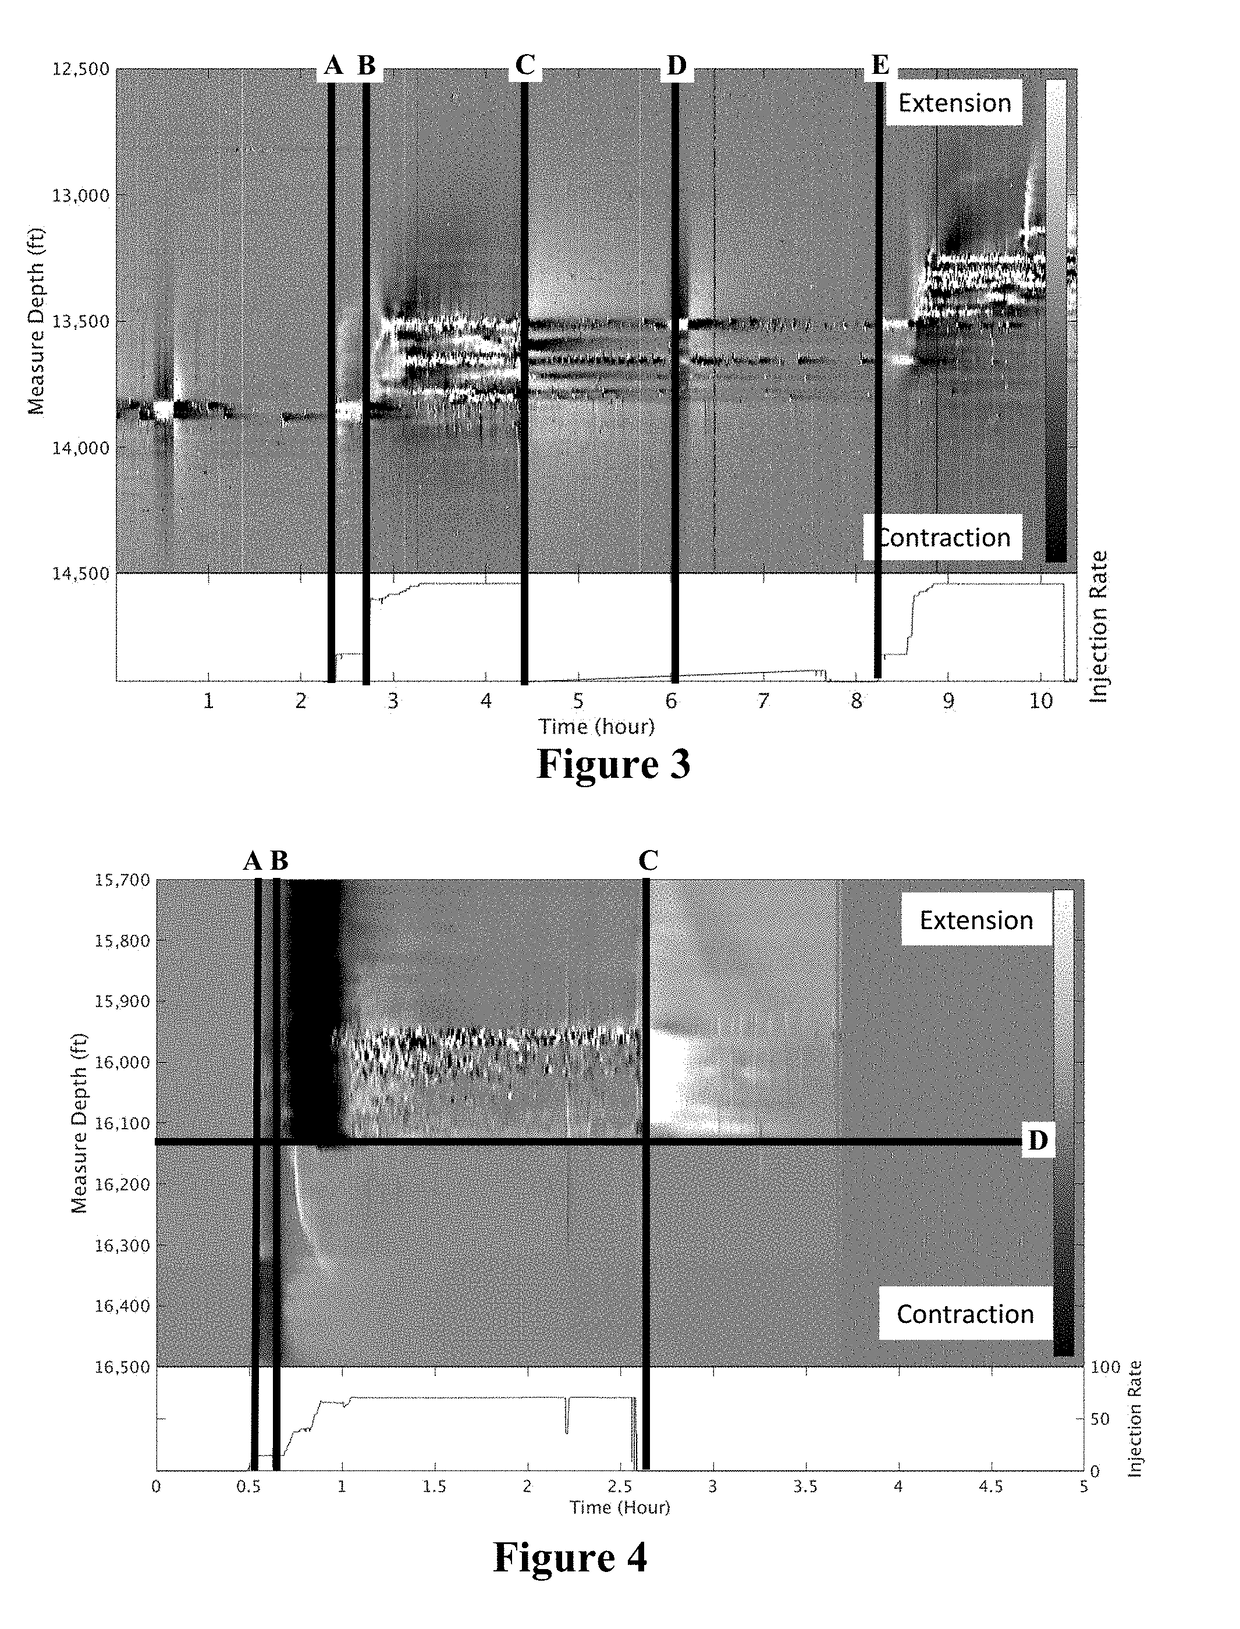
[0053]In example 1, fiber-optic cables are installed outside of the casing and cemented in place along the length of the well during a procedure, in this case during a stage of fracturing. Numerous interrogators are available to record optical signals. In one embodiment, Pinnacle Gen-1 Phase-1 interrogators are used for the recording. The fiber optic cables are interrogated with multiple high-speed laser pulses while monitoring the reflected light signal (Rayleigh scatter) along the fiber. This is repeated in a variety of patterns dependent upon the data being collected. The raw data are sampled at 10 kHz continuously at more than 6000 locations (referred as “channels” in this study) with 1 m spatial separation along the fiber. The gauge length is set to 5 m. When recording, the measured optical phase is differentiated in time, so the raw DAS data is linearly associated with strain rate along the fiber.

[0054]FIG. 4 shows a Low-Frequency In-well signal....

example 2

Cross-Well Signal During Hydraulic Fracturing

[0056]In example 2, fiber-optic cables are installed outside of the casing and cemented in place along the length of an adjacent well. Numerous interrogators are available to record optical signals. In one embodiment, Pinnacle Gen-1 Phase-1 interrogators are used for the recording. The fiber optic cables are interrogated with multiple high-speed laser pulses while monitoring the reflected light signal (Rayleigh scatter) along the fiber. This is repeated in a variety of patterns dependent upon the data being collected. The raw data are sampled at 10 kHz continuously at more than 6000 locations (referred as “channels” in this study) with 1 m spatial separation along the fiber. The gauge length is set to 5 m. When recording, the measured optical phase is differentiated in time, so the raw DAS data is linearly associated with strain rate along the fiber.

[0057]FIG. 3 shows a Low-Frequency Cross-well signal. This data is obtained from an observ...

example 3

In-Well Signal During Production

[0059]The production well with optical fiber installed is shut in for a period of time. During the shut-in period, small differences in formation temperature permeate into the well bore through thermal conduction. When production resumes, the fluid flow within the well causes a measurable wave of temperature fluctuations to move in the direction of the flow. Flow rates along the well can be inferred from these temperature changes, and variations in rates provides an indication of the relative productivity of the well intervals.


PUM


Abstract

The invention relates to DAS observation has been proven to be useful for monitoring hydraulic fracturing operations. While published literature has shown focus on the high-frequency components (>1 Hz) of the data, this invention discloses that much of the usable information may reside in the very low frequency band (0-50 milliHz). Due to the large volume of a DAS dataset, an efficient workflow has been developed to process the data by utilizing the parallel computing and the data storage. The processing approach enhances the signal while decreases the data size by 10000 times, thereby enabling easier consumption by other multi-disciplinary groups for further analysis and interpretation. The polarity changes as seen from the high signal to noise ratio (SNR) low frequency DAS images are currently being utilized for interpretation of completions efficiency monitoring in hydraulically stimulated wells.

Description

CROSS-REFERENCE TO RELATED APPLICATIONS[0001]This application is a non-provisional application which claims benefit under 35 USC §119(e) to U.S. Provisional Applications Ser. No. 62 / 305,758 filed Mar. 9, 2016, entitled “ LOW FREQUENCY DISTRIBUTED ACOUSTIC SENSING,” and Ser. No. 62 / 305,777 filed Mar. 9, 2016, entitled “PRODUCTION LOGS FROM DISTRIBUTED ACOUSTIC SENSORS,” which are incorporated herein in their entirety.STATEMENT REGARDING FEDERALLY SPONSORED RESEARCH[0002]None.FIELD OF THE INVENTION[0003]The present invention relates generally to the use of distributed fiber optic sensing including Distributed Acoustic Sensing (DAS) and Distributed Thermal Sensing (DTS) in subterranean wellbores for hydrocarbon production. In particular this application is directed to detailed completion operations and production monitoring utilizing low frequency monitoring of fiber optic signals including DAS and DTS signals.BACKGROUND OF THE INVENTION[0004]Fiber-optic cables can be installed in vert...

Claims


Application Information

Patent Timeline
IPC IPC(8): E21B47/00E21B47/12E21B43/20E21B43/24E21B43/26E21B43/16
CPCE21B47/00E21B43/26E21B43/16E21B47/123E21B43/2406E21B43/166E21B43/20G01V1/40G01V1/226G01K11/32G01H9/004E21B47/0224E21B47/07E21B47/107E21B47/135E21B47/0228G01B11/161
Inventor JIN, GEMOSHER, CHARLES C.FILICE, FRANK P.KRUEGER, KYLE R.ROY, BAISHALITURA, ALIJURICK, DANA M.
Owner CONOCOPHILLIPS CO
Why Eureka
Try Eureka