
Iterative analyzing method for a medical image

Active Publication Date: 2019-03-28
TAICHUNG VETERANS GENERAL HOSPITAL
View PDF0 Cites 5 Cited by
  • Summary
  • Abstract
  • Description
  • Claims
  • Application Information

AI Technical Summary

Benefits of technology

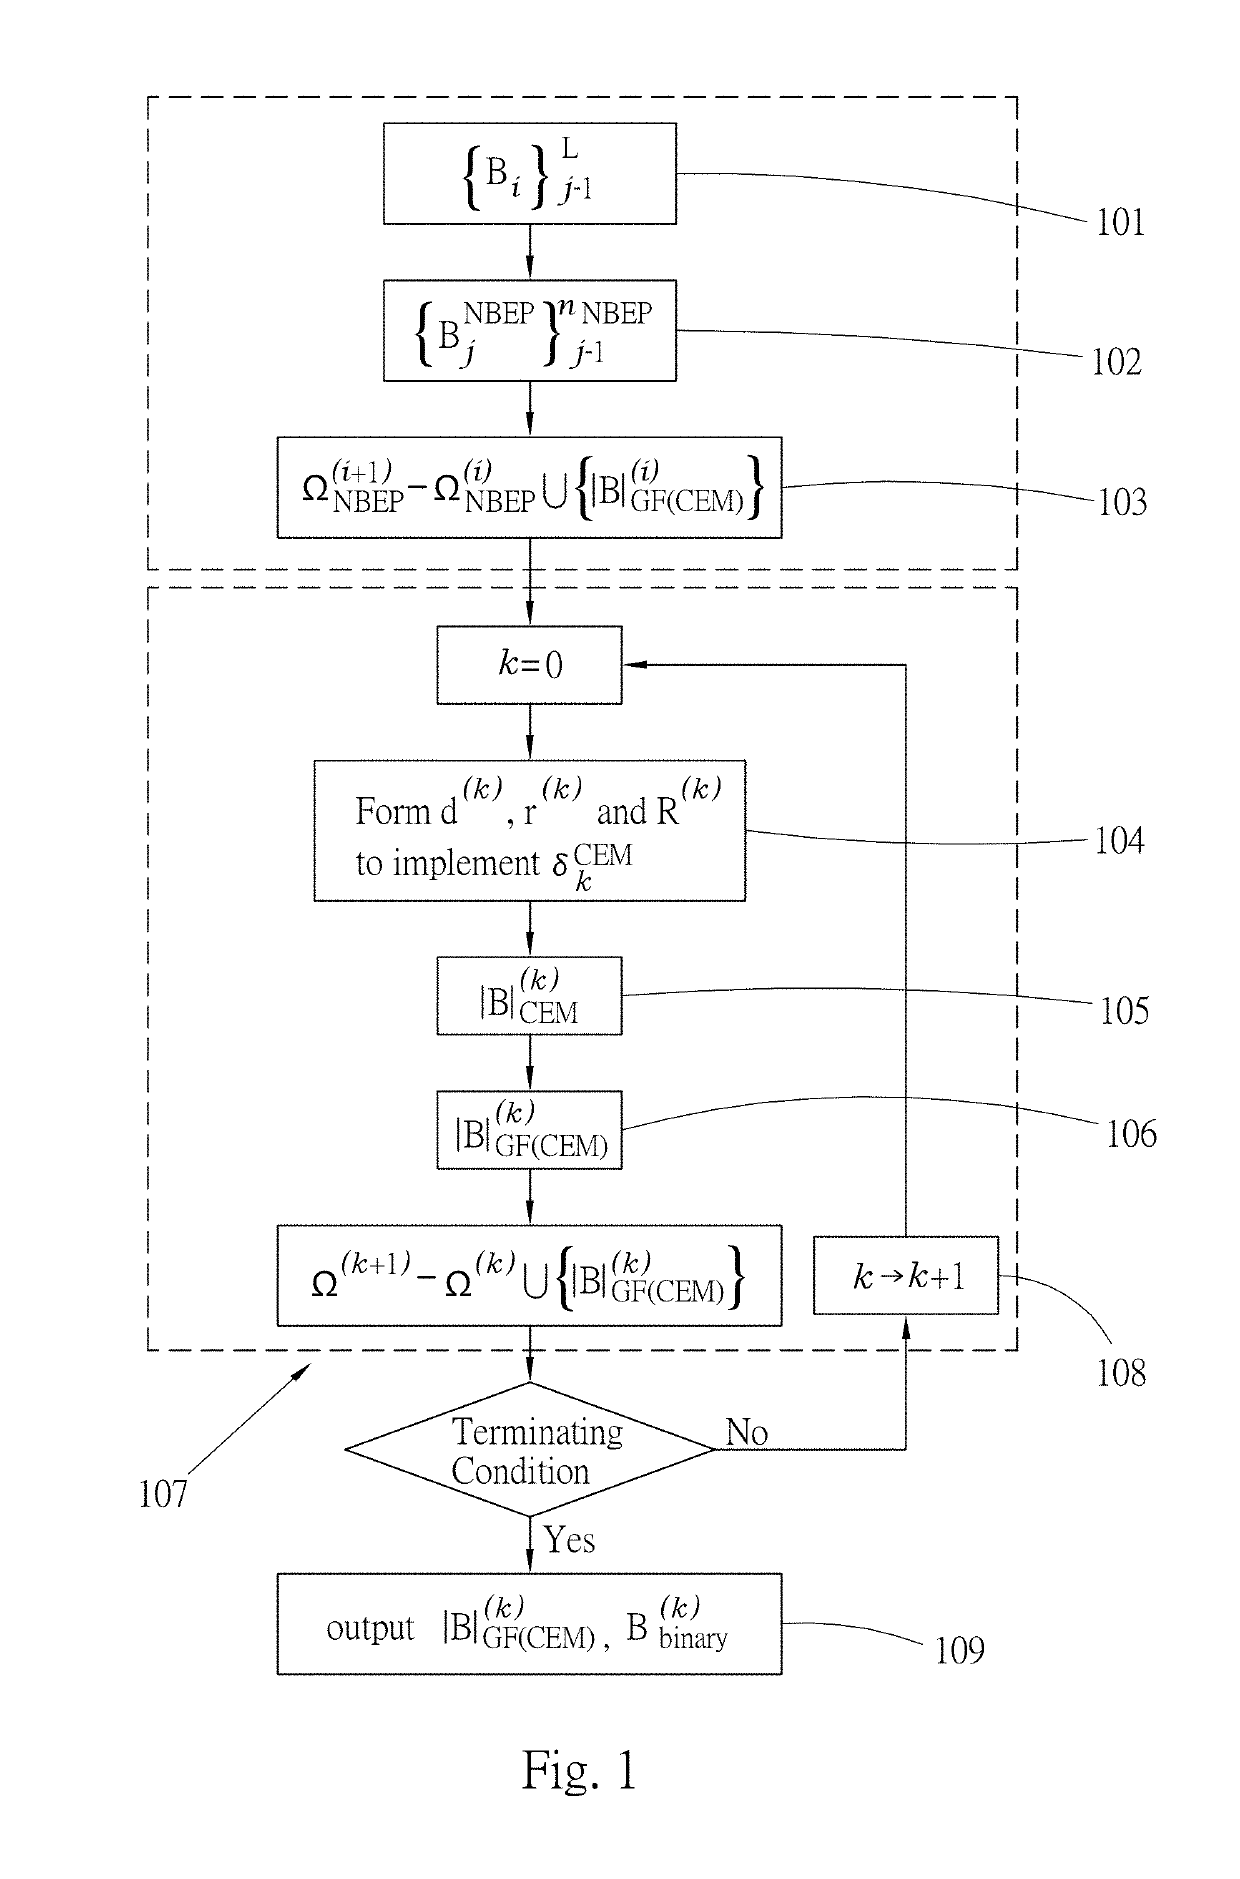
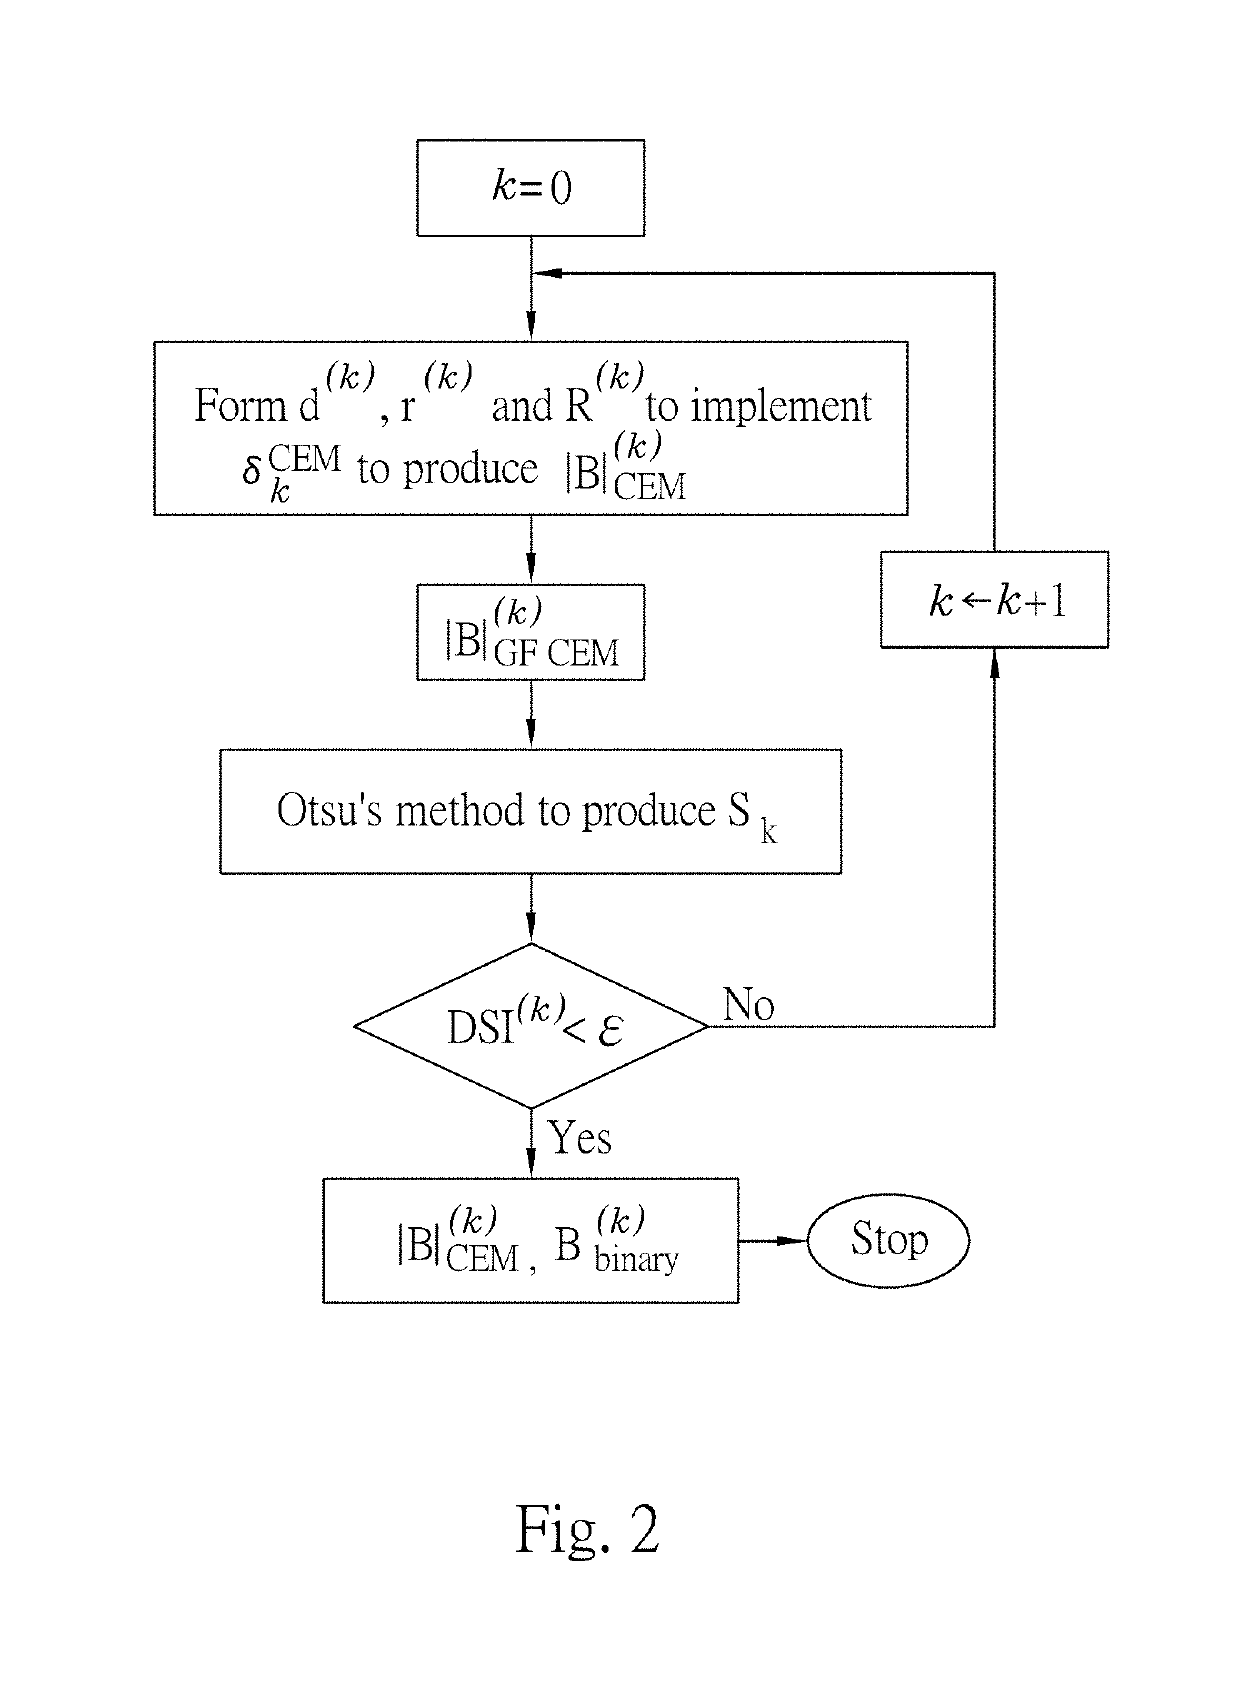
The present invention provides an iterative analyzing method for a medical image that automatically determines when to stop the feedback process. This saves time and ensures that the necessary information is obtained for efficient analysis of the image.

Problems solved by technology

However, at present, it analyzed the white matter hyperintensities of MRI (Magnetic resonance imaging) images by human visual evaluation and classification method which usually has to take a lot of time to complete.
And it will increase the risk of analysis errors because of the manual operation and analysis.
First, it is impossible to provide a threshold for determining the classification. In other words, it can not analyze the area of white matter hyperintensities in the image to classify correctly;
Second, CEM is a linear filter, so CEM can not be used to analyze a nonlinear image, that is, CEM can not analyze the area of white matter hyperintensities in the image.
Third, traditional hyperspectral influence processing method only uses pixels as the basis for analysis, but do not include the spatial information of the image itself, it will cause analyzing errors.

Method used


Image

  • Iterative analyzing method for a medical image
  • Iterative analyzing method for a medical image
  • Iterative analyzing method for a medical image

Examples


example 1

Analyzing the Simulation Sample

[0088]MR brain images containing multiple sclerosis (MS) lesions were obtained from the MR imaging simulator of McGill University, Montreal, Canada for experiments. MS lesions are typically hyperintense on T2 or FLAIR sequence image. FIG. 4a to FIG. 4C shows a slice MR brain image along with the ground truth of MS lesion shown in FIG. 4D. The MR brain images are acquired by the modalities of T1, T2 and PD with specifications provided in BrainWeb site. The thickness of slice is 1 mm with size of 181×217×181 (pixel). Each slice is specified by INU 0% or 20%, denoted by rf0 and rf20 with 6 different levels of noise, 0%, 1%, 3%, 5%, 7% and 9%. The noise in the background of the simulated images is simulated by Rayleigh statistics and signal regions are simulated by Rician statistics, wherein the “percentage (%) of noise” represents the ratio of the standard deviation of the white Gaussian noise to the signal for a reference tissue in terms of %.

[0089]The s...

example 2

Analyzing the Real Sample

[0094]The real MRI brain images were acquired at the Taichung Veterans General Hospital (TCVGH) by Siemens Magnetom Aera 1.5 Tesla MR scanner with a 16-channel phase-array head coil. MR imaging protocol included T1 with 3D MPRAGE, T2 and FLAIR with SPACE technique. Other imaging parameters used for data acquisition were voxel size of 1×1×1 mm, matrix size of 256×256×176, and NEX=1. The protocol for this study was approved by the Ethics Committee of Clinical Research, TCVGH (IRB number: CE16138A). According to a clinical visual inspection criterion, called white matter hyperintensities (WMH), the WMH lesions can be graded by Fazekas with three grades of Fazekas shown in FIG. 11 for illustration.

[0095]The real MRI brain images were analyzed by the iterative analyzing method for a medical image of the present invention and LST, respectively, wherein the parameters used for the method of the present invention were shown in Table 3. The analysis results were show...


PUM


Abstract

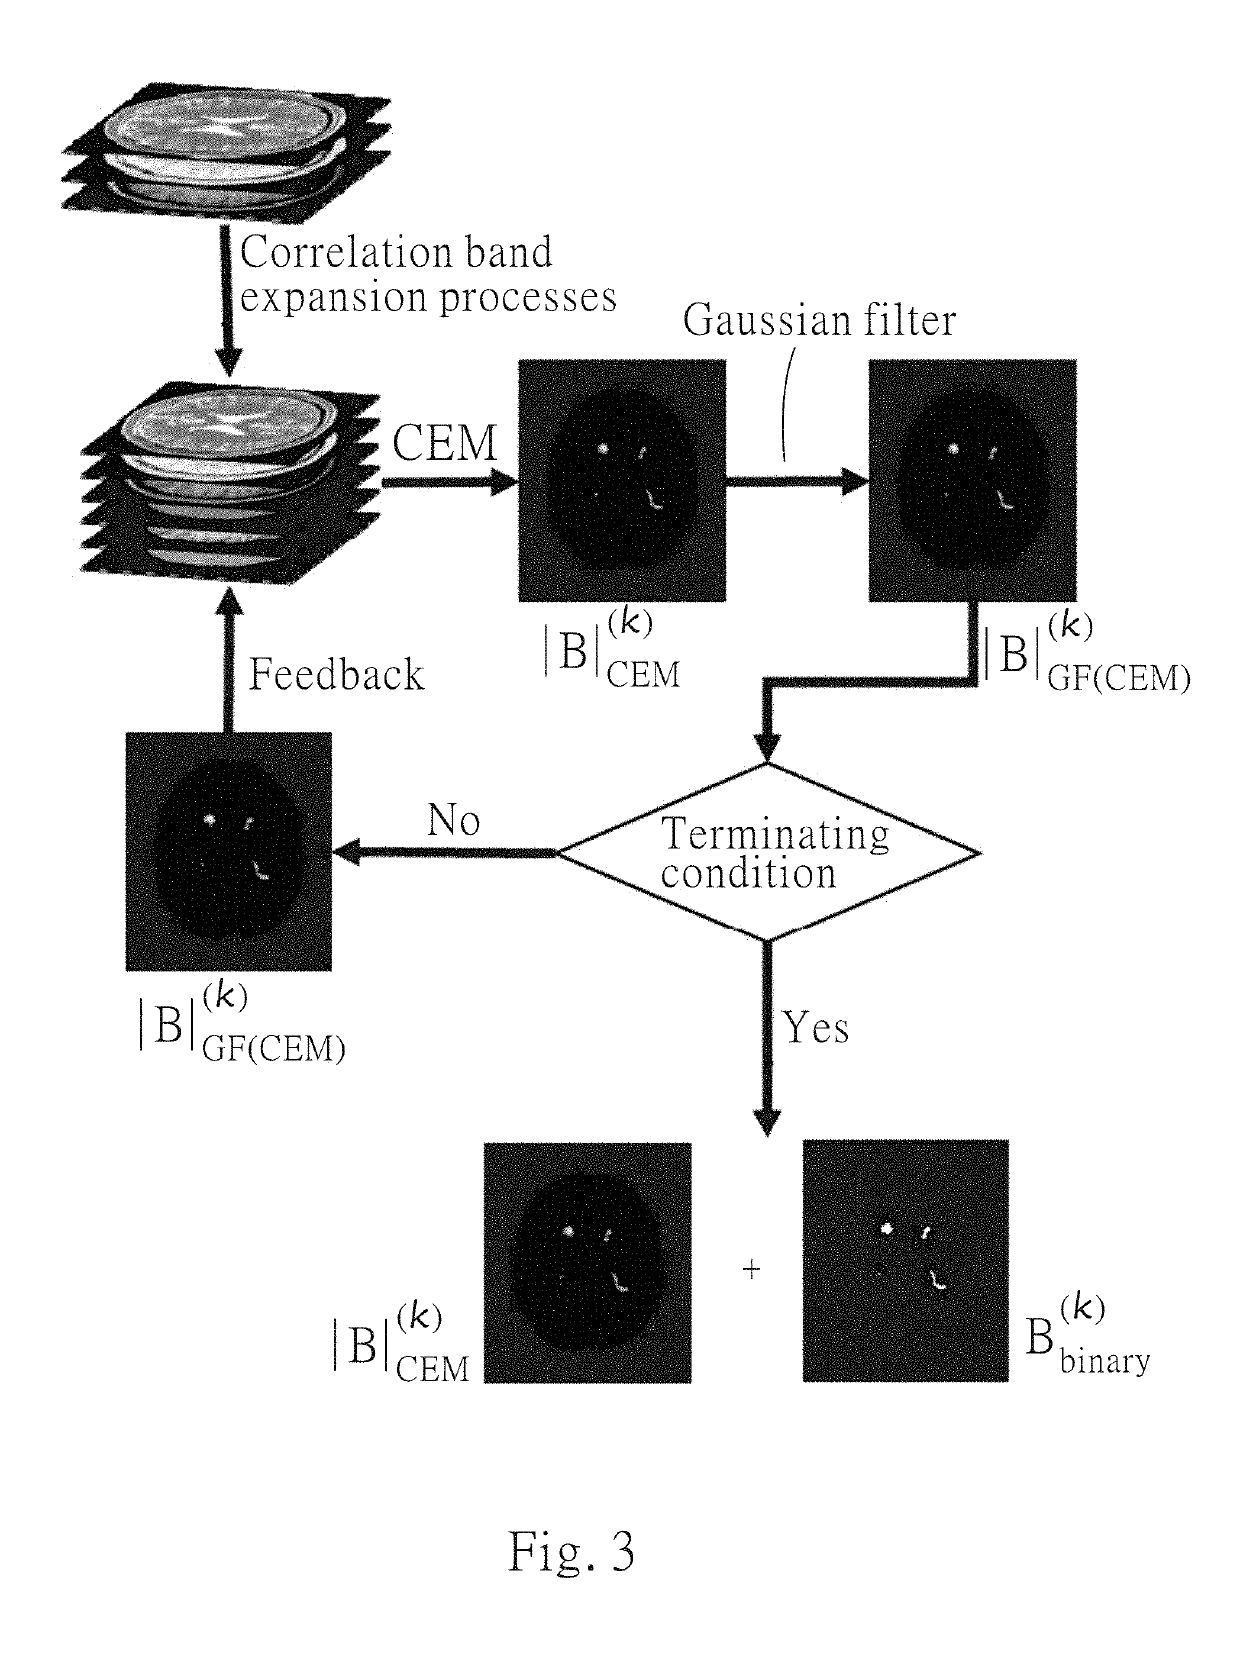
The present invention disclosed an iterative analyzing method, which can detect the lesion in the image quickly. In brief, the iterative analysis method of the medical image disclosed by the present invention is roughly as follows: first, the original spectral image cube is expanded into a spectral image cube by a method of nonlinear dimensional-expansion, and then detecting the target's subpixel by the method of constrained energy minimization to produce an abundance image; the abundance image is fed back to the spectral image cube for create another spectral image cube by the nonlinear method. Furthermore, the abundance image is only used for detecting the subpixel of the target and does not include any spatial information, so, in order to obtain the spatial information of spectral image, it obtains the spatial information around the subpixel by using a blurring tool such as a Gaussian filter. After the spatial information is fed back to the spectral image cube, the subpixel target detection is repeatedly performed until a predetermined termination condition is satisfied.

Description

BACKGROUND1. Field of the Invention[0001]The present application is relative to an analyzing method for images, especially for an iterative analyzing method for a medical image.2. Description of Related Art[0002]White matter hyperintensities (WMH) are T2 or FLAIR sequences have been commonly observed on MR images of elderly people, and related to various geriatric disorders including cerebrovascular diseases, cardiovascular diseases, dementia, and psychiatric disorders. Therefore, many research pointed out that the white matter hyperintensities are the important indicator for detecting or diagnosing diseases, such as calculating the risk of stroke or dementia by the signal of white matter hyperintensities. However, at present, it analyzed the white matter hyperintensities of MRI (Magnetic resonance imaging) images by human visual evaluation and classification method which usually has to take a lot of time to complete. And it will increase the risk of analysis errors because of the m...

Claims


Application Information

Patent Timeline
IPC IPC(8): G06T7/00G06T7/11A61B6/00G06T7/62G06T7/136
CPCG06T7/0012G06T7/11A61B6/5258G06T7/62G06T7/136A61B6/032G06T2207/30096A61B6/5205G06T2207/30016A61B6/5217G06T2211/424G06T2207/10081G06T2207/10088G06T2200/04
Inventor CHANG, CHEIN-ICHEN, CHI-CHANG CLAYTONCHAI, JYH WENCHEN, HSIAN-MIN
Owner TAICHUNG VETERANS GENERAL HOSPITAL
Learn More