Imaging mass spectrometer

a mass spectrometer and mass spectrometer technology, applied in the field of imaging mass spectrometer, can solve the problems of obstructing the use of a device with high mass-resolving power, increasing the size and price of the device, and increasing the measurement time, so as to achieve the effect of high mass-resolving power and inexpensive mass-spectrometer

Active Publication Date: 2019-07-18
SHIMADZU CORP
View PDF1 Cites 3 Cited by
  • Summary
  • Abstract
  • Description
  • Claims
  • Application Information

AI Technical Summary

Benefits of technology

[0027]In the imaging mass spectrometer according to the present invention, for example, even when there is a compound whose mass-to-charge ratio is the same as or extremely close to the mass-to-charge of the target compound (so that they cannot be separated by commonly used mass spectrometers), the influence of the former compound can be eliminated by data processing, and a high-quality mass spectrometric imaging graphic which accurately shows the two-dimensional distribution of the target compound can be created. Even when there are a plurality of compounds whose mass-to-charge ra

Problems solved by technology

However, it is often the case that a large number of compounds are simultaneously detected, particularly when the analysis is performed on a biological sample or the like.
However, the improvement in mass-resolving power has also been accompanied by an increase in size and price of the device as well as an increase in the measurement time.
In some cases, those restrictions may obstruct the use of

Method used


Image

  • Imaging mass spectrometer
  • Imaging mass spectrometer
  • Imaging mass spectrometer

Examples


Embodiment Construction

[0032]One embodiment of the imaging mass spectrometer according to the present invention is hereinafter described with reference to the attached drawings.

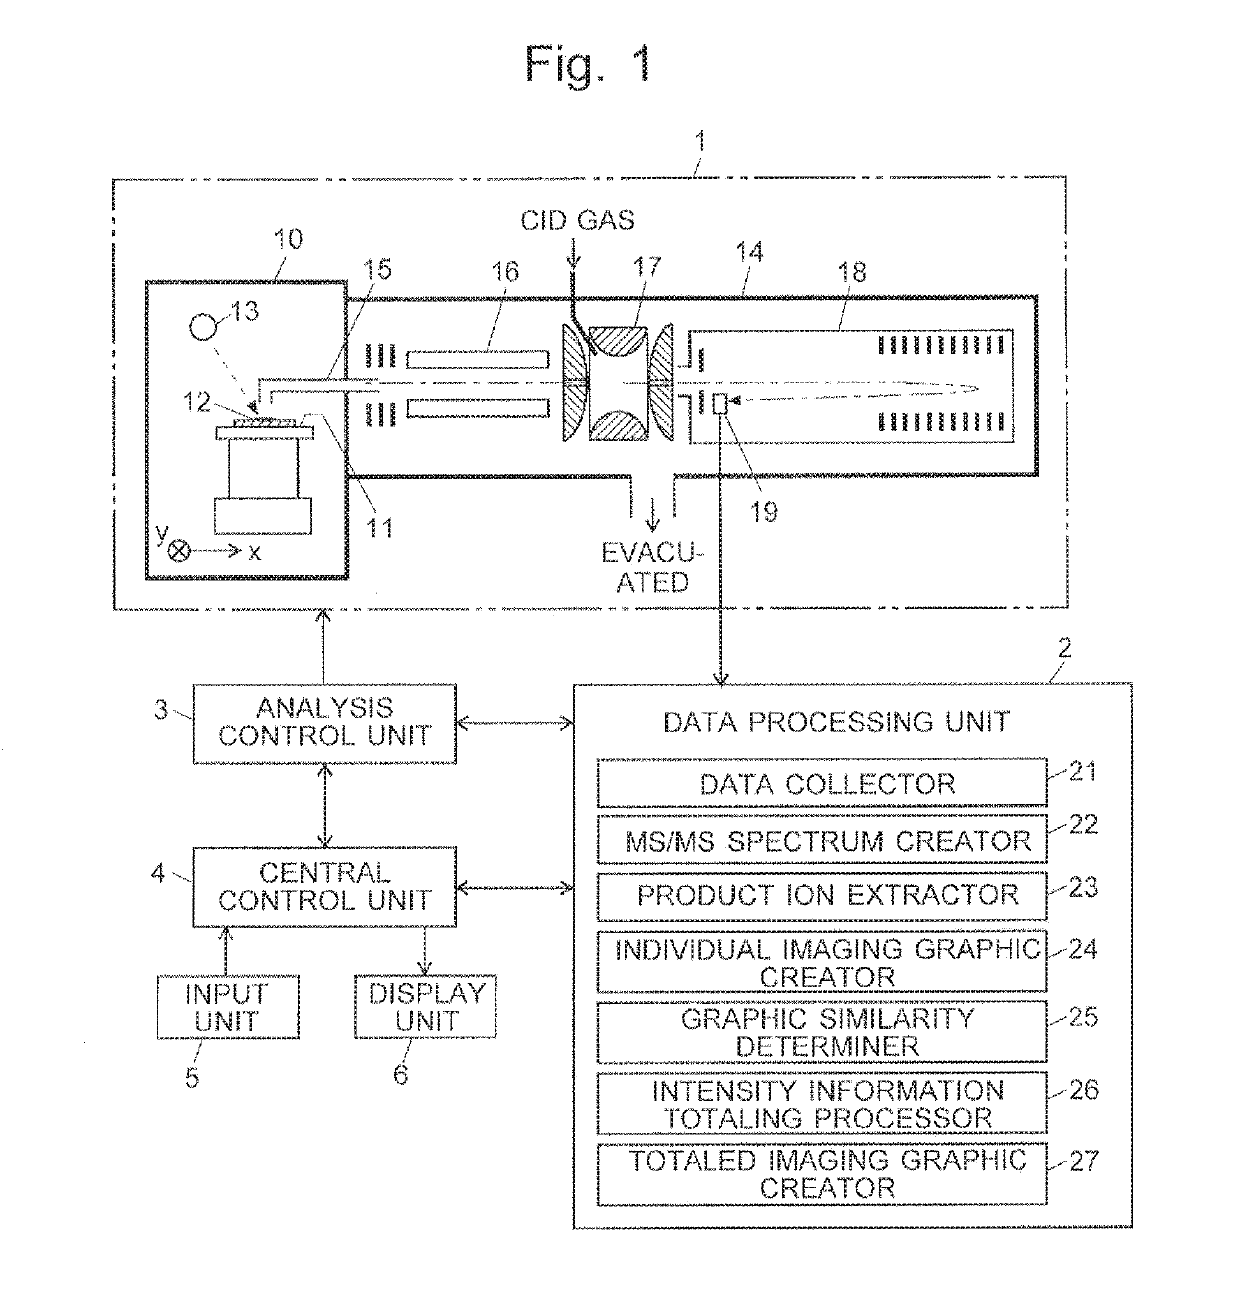
[0033]FIG. 1 is a schematic configuration diagram of the imaging mass spectrometer according to the present embodiment.

[0034]The imaging mass spectrometer according to the present embodiment includes: a measurement unit 1 for performing a mass spectrometric analysis for each of a large number of measurement points (micro areas) within a measurement target area on a sample 12, to acquire mass spectrum data for each micro area: a data processing unit 2 for processing a large amount of data acquired by the measurement unit 1: an analysis control unit 3 for controlling the operation of the measurement unit 1; a central control unit 4 for controlling the entire system as well as managing the user interface and other components; and an input unit 5 and a display unit 6 attached to the central control unit 4.

[0035]The measurement unit 1 i...


PUM


Abstract

An MS2 analysis for one precursor ion is performed to collect data on each micro area within a measurement target area (S1). A plurality of product ions are extracted based on those data (S2), and a mass spectrometric (MS) imaging graphic is created for each m/z of the product ion (S3). Hierarchical cluster analysis is performed on the created MS imaging graphics to group the product ions based on the similarity of the graphics (S4). Product ions having similar distributions are sorted into the same group. Such a group of ions can be considered to have originated from the same compound. Accordingly, the intensity information of a plurality of product ions is totaled in each group and for each micro area (S5), and an MS imaging graphic is created based on the totaled intensity information (S6). Even if there are a plurality of compounds overlapping the precursor ion, the influence of the overlapping can be eliminated through those steps. Thus, a graphic having a higher level of SN ratio, sensitivity and dynamic range than an MS imaging graphic obtained at a single product ion can be created and displayed.

Description

TECHNICAL FIELD[0001]The present invention relates to an imaging mass spectrometer for performing a mass spectrometric analysis on each of a large number of measurement points within a two-dimensional area on a sample and for creating a graphic (or image) which reflects the distribution of a substance, surface condition of the sample, etc., within the two-dimensional area, based on the information obtained by the analysis.BACKGROUND ART[0002]Mass spectrometric imaging is a technique for investigating the distribution of a substance having a specific mass by performing a mass spectrometric analysis at each of a plurality of measurement points (micro areas) within a two-dimensional area on a sample, such as a biological tissue section. This technique has been increasingly applied in various areas, such as the drug discovery, biomarker search, and identification of the causes of diseases. Mass spectrometers for carrying out mass spectrometric imaging are generally called “imaging mass ...

Claims


Application Information

Patent Timeline
IPC IPC(8): H01J49/00
CPCH01J49/0004H01J49/0036H01J49/004
Inventor TAKESHITA, KENGO
Owner SHIMADZU CORP
Why Eureka
Try Eureka