Analysis processing method using impedance spectrum data, impedance spectrum data analysis processing system, and impedance spectral analysis processing program

a technology of analysis processing and impedance spectrum data, applied in capacitor manufacturing, sustainable manufacturing/processing, instruments, etc., can solve the problems that the value set obtained by applying the formulas (a) and (b) may not be able to reproduce and achieve high accuracy and reproducibility. the effect of the measured impedance spectrum data

Pending Publication Date: 2021-09-23
NAT INST FOR MATERIALS SCI
View PDF4 Cites 2 Cited by
  • Summary
  • Abstract
  • Description
  • Claims
  • Application Information

AI Technical Summary

Benefits of technology

[0028]A method of analysis processing using measured impedance spectrum data of the present invention includes the steps of: determining whether to reset a maximum value and / or a minimum value of a logarithmic relaxation time used for calculation; setting the number to be divided at equal intervals in a range of the logarithmic relaxation time set; and applying regularized least squares to analyze parameters R∞, T, L, and Rl with respect to the range of the logarithmic relaxation time so as to satisfy the above formula (A).
[0029]The present inventor has found that, by employing a new formula (A) in consideration of the capacitor component and the inductor component, it is possible to obtain various parameters that reproduce the measured impedance spectrum data even in the case of data in which, as exemplified by the impedance of a primary battery, a secondary battery, a corrosive system, or a capacitor, the absolute impedance value does not converge to a constant value due to a decrease in frequency, or the absolute impedance value hasn't converged to a constant value. By using the parameters obtained in this way, relaxation time distribution analysis can be performed on the impedance spectrum data described above. In addition, since the present invention determines whether to reset the maximum value and / or the minimum value of the logarithmic relaxation time used in calculation, and sets the number of equally divided intervals in the set logarithmic relaxation time range, it is possible to reproduce the measured impedance spectrum data with high accuracy when the parameters are obtained based on the above formula (A). By employing such an analysis processing method, it is possible to provide an analysis processing system and a program for executing it.

Problems solved by technology

However, according to Non Patent Literature 1, for data in which, as exemplified by the impedance of a primary battery, a secondary battery, a capacitor, or a corrosive system, the absolute impedance value does not converge to a constant value due to a decrease in frequency, or the absolute impedance value hasn't converged to a constant value, the Rk value set obtained by applying the formulas (a) and (b) may not be able to reproduce the measured impedance spectrum data.

Method used


Image

  • Analysis processing method using impedance spectrum data, impedance spectrum data analysis processing system, and impedance spectral analysis processing program
  • Analysis processing method using impedance spectrum data, impedance spectrum data analysis processing system, and impedance spectral analysis processing program
  • Analysis processing method using impedance spectrum data, impedance spectrum data analysis processing system, and impedance spectral analysis processing program

Examples


example 1

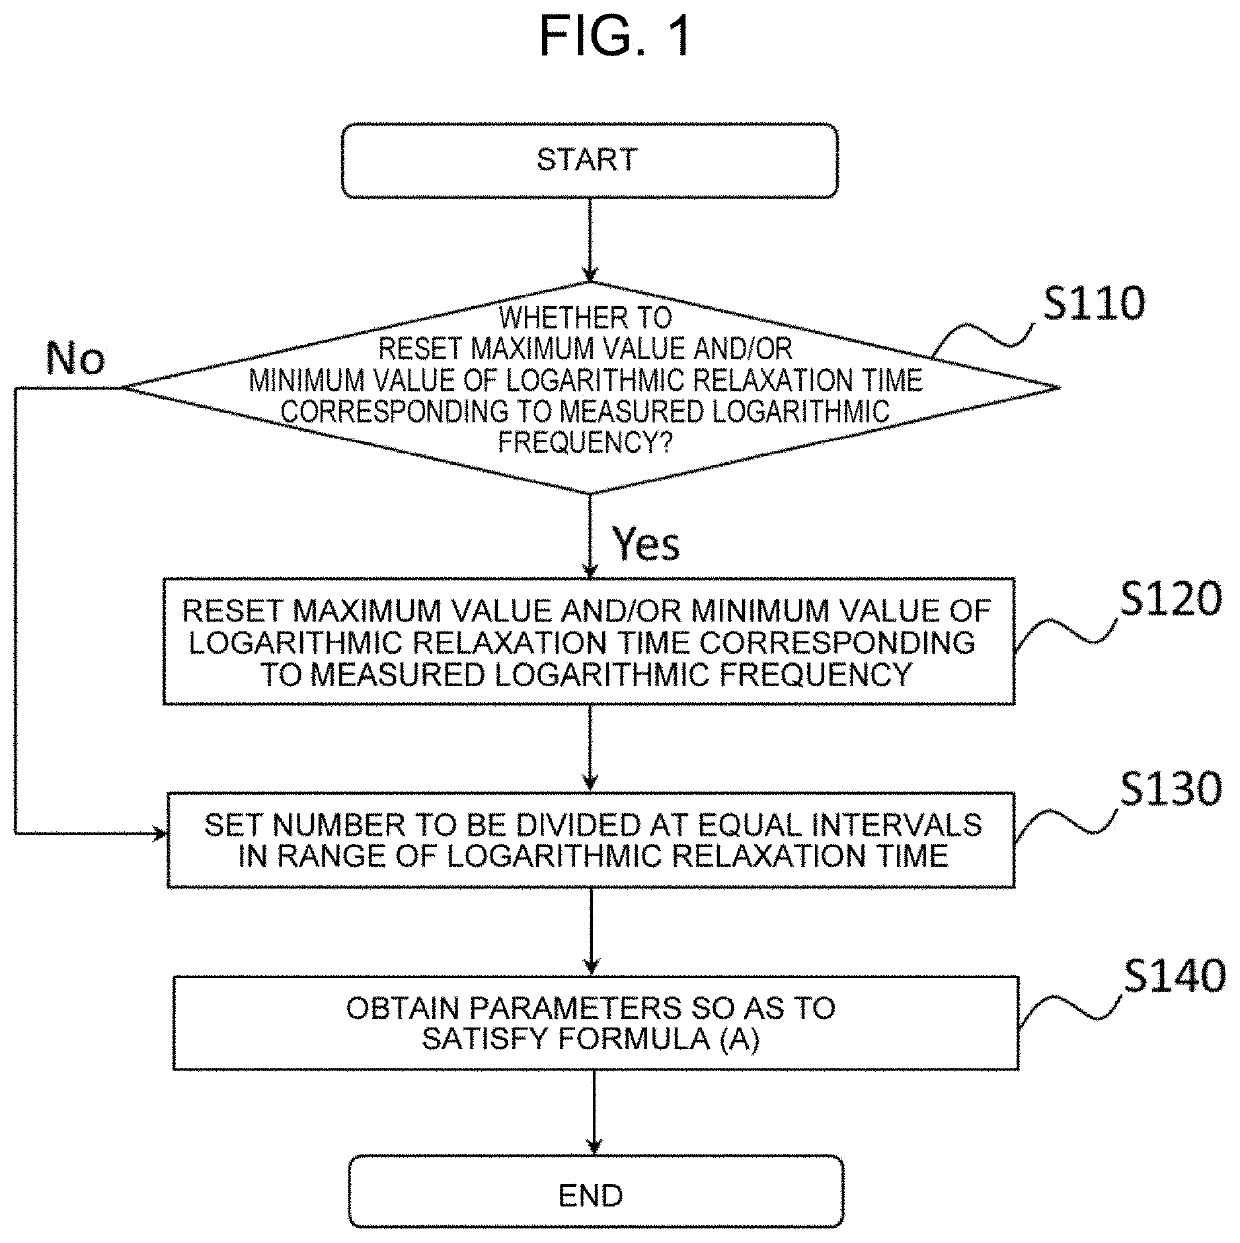
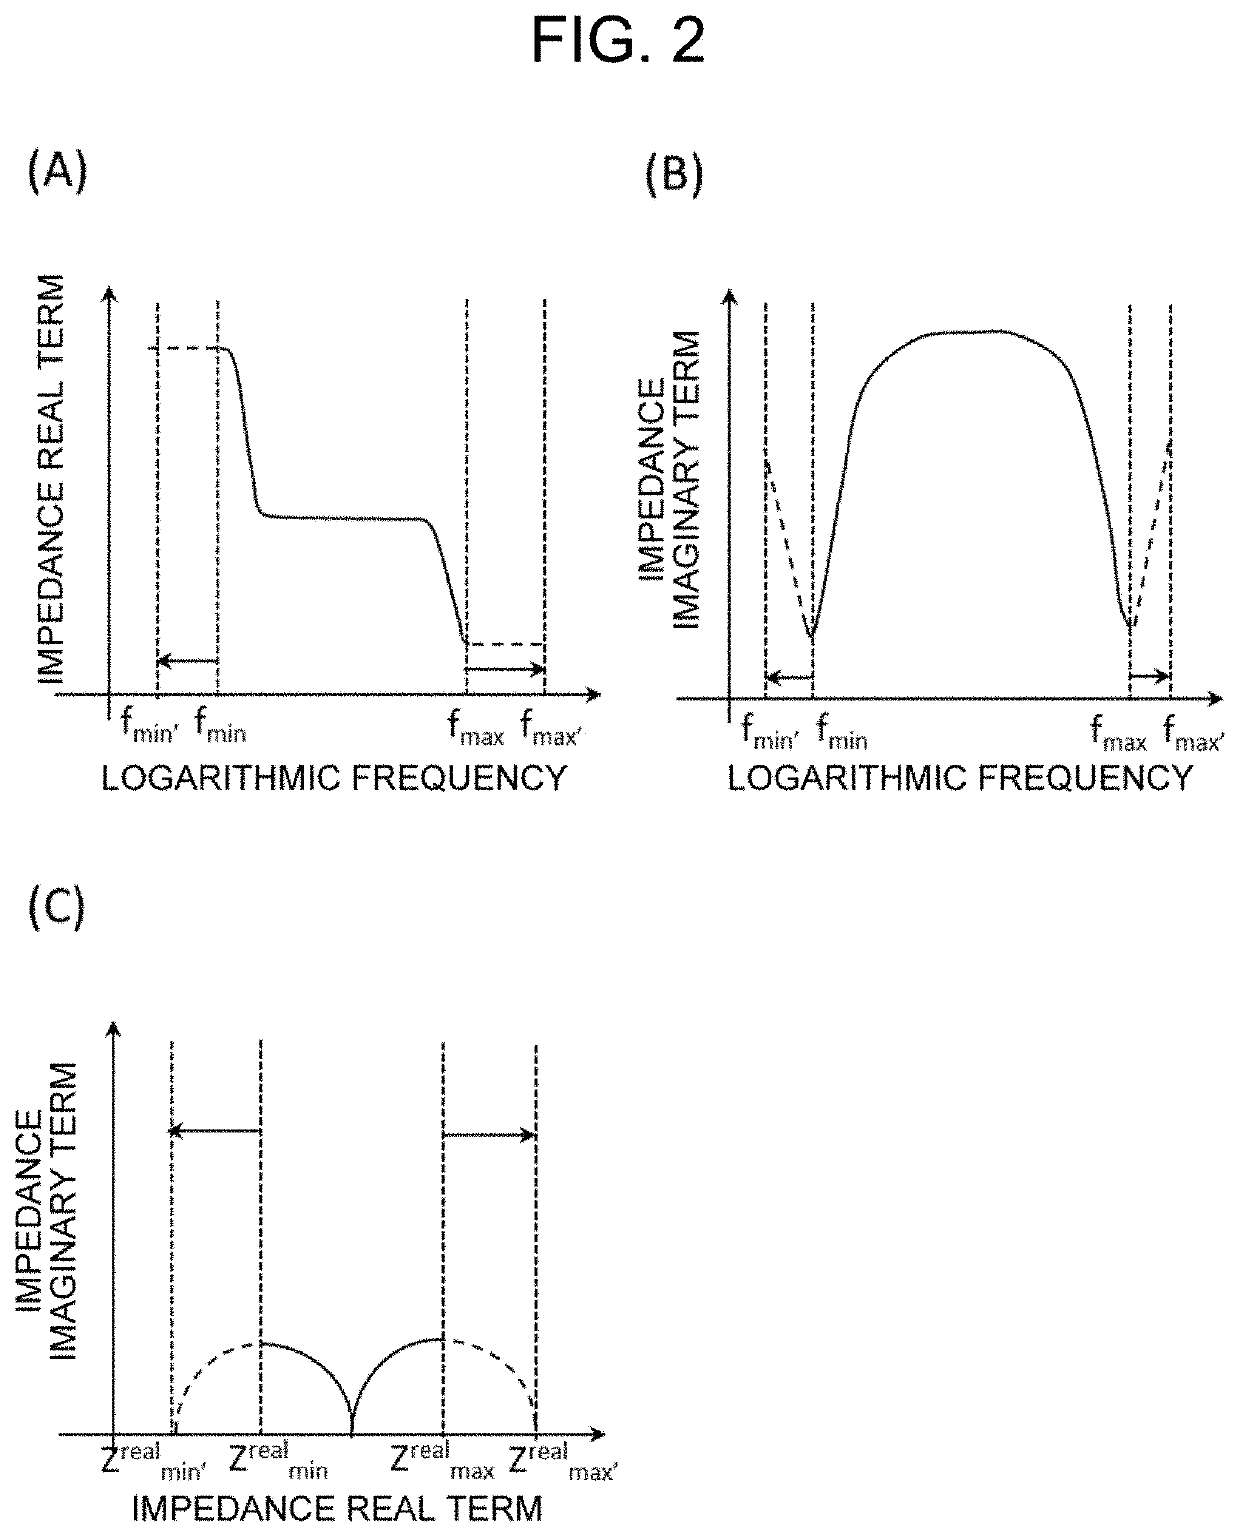
[0113]In Example 1, the analysis processing method shown in FIGS. 1 to 4 was carried out based on the impedance spectrum data (FIG. 7) measured by the same electric circuit as in Comparative Example 1. Specifically, FIGS. 7(A) to 7(C) and FIG. 8 were referred to, and it was determined whether to reset the maximum value and / or the minimum value of the logarithmic relaxation time corresponding to the measured logarithmic frequency (step S110 in FIG. 1). The determination was made visually.

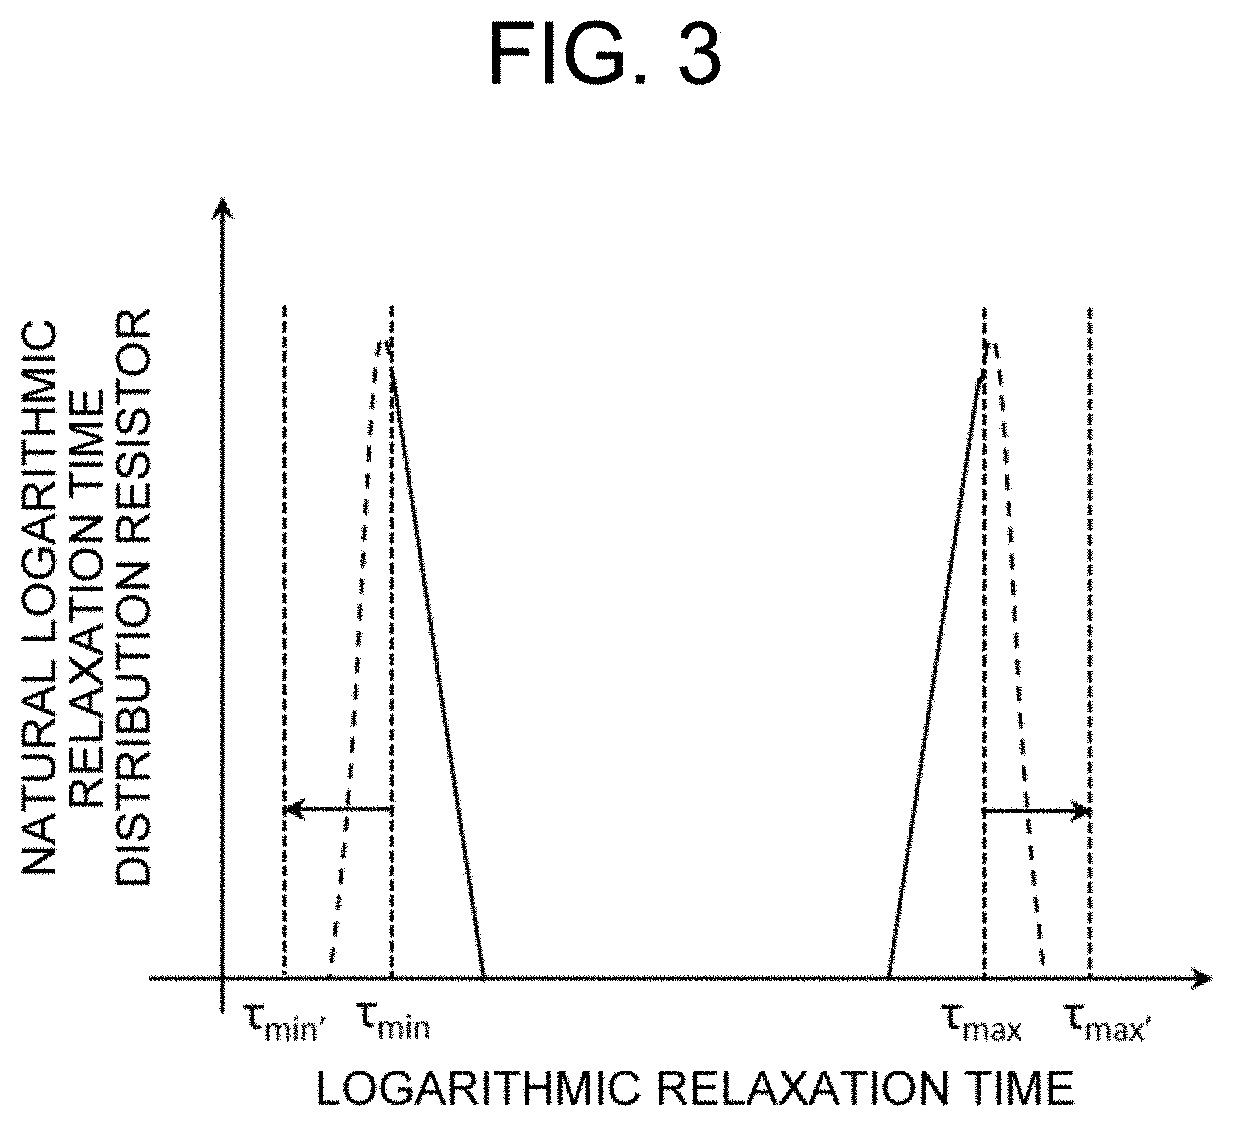
[0114]The maximum value and minimum value of the logarithmic relaxation time were manually reset to log(1 / (2π×10−2 [s])) and log(1 / (2π×109 [s])) so that the impedance real term would be a plateau on the low frequency side and the high frequency side beyond the measured logarithmic frequency range (1 Hz to 1 MHz) in FIG. 7A, so that the impedance imaginary term would have a peak on the low frequency side and the high frequency side beyond the measured logarithmic frequency range (1 Hz to 1 MHz) in FIG...

example 2

[0127]In Example 2, the analysis processing method shown in FIGS. 1 to 4 was carried out based on the impedance spectrum data (FIG. 12) measured by the same coin-type lithium battery as in Comparative Example 2. Specifically, FIG. 13 was referred to, and it was determined whether to reset the maximum value and / or the minimum value of the logarithmic relaxation time corresponding to the measured logarithmic frequency (step S110 in FIG. 1).

[0128]The maximum value and minimum value of the logarithmic relaxation time were manually reset to log(1 / (2π×10−3 [s])) and log(1 / (2π×106 [s])) so that as if Rk had a peak beyond the range of the logarithmic relaxation time in FIG. 13.

[0129]The number to be divided at equal intervals in the range of the logarithmic relaxation time set was manually set to 10 points per digit of the relaxation time on a logarithmic scale (step S130 in FIG. 1). Next, regularized least squares was applied to analyze parameters R∞, T, L, and Rl with respect to the range...

example 3

[0141]In Example 3, the analysis processing method shown in FIGS. 1 to 4 was carried out based on the impedance spectrum data (FIG. 17) used in Comparative Example 3. Specifically, FIG. 18 was referred to, and it was determined whether to reset the maximum value and / or the minimum value of the logarithmic relaxation time corresponding to the measured logarithmic frequency (step S110 in FIG. 1).

[0142]The maximum value and minimum value of the logarithmic relaxation time were manually reset to log(1 / (2π×10−2 [s])) and log(1 / (2π×106 [s])) so that as if Rk had a peak beyond the range of the logarithmic relaxation time in FIG. 18.

[0143]The number to be divided at equal intervals in the range of the logarithmic relaxation time set was manually set to 10 points per digit of the relaxation time on a logarithmic scale (step S130 in FIG. 1). Next, regularized least squares was applied to analyze parameters R∞, T, L, and Rl with respect to the range of the logarithmic relaxation time set and t...


PUM

PropertyMeasurementUnit
impedance spectrumaaaaaaaaaa
logarithmic relaxation timeaaaaaaaaaa
logarithmic frequencyaaaaaaaaaa

Abstract

This method for analysis processing by using measured impedance spectrum data includes: a step for determining whether to reset the maximum value and / or the minimum value of logarithmic relaxation time corresponding to a measured logarithmic frequency on the basis of the measured impedance spectrum data; a step for setting the number of equal-interval divisions within the range of the logarithmic relaxation time set in the determination step; and a step for analyzing parameters R∞, T, L, and Rl for the range of the set logarithmic relaxation time so as to satisfy a prescribed expression (A) by applying a regularized least-squares method.

Description

TECHNICAL FIELD[0001]The present invention relates to an analysis processing method using impedance spectrum data, an impedance spectrum data analysis processing system, and an impedance spectral analysis processing program.BACKGROUND ART[0002]As a method for analyzing measured impedance spectrum data, a method for obtaining a continuous relaxation time distribution is known (see, for example, Non Patent Literature 1). According to Non Patent Literature 1, when the frequency (f) taken at logarithmically equal intervals and the complex impedance (Z) are obtained as measurement data, the complex impedance is analyzed as being given by the following formulas (a) and (b). R∞ and Rk in the formula (a) are undecided values and are parameters necessary for reproducing the measurement data.[MATH.⁢1]Z⁡(fp)≈R∞+∑k=1N⁢Rk1+2⁢π⁢⁢j⁢⁢exp⁡(ln⁢⁢τk)⁢exp⁡(ln⁢⁢fp)⁢Δlnτ(a)ln⁢⁢τk=-ln⁡(fk2⁢π)(b)[0003]Here, k is the sequence number of the logarithmic relaxation time, p is the sequence number of the measured...

Claims


Application Information

Patent Timeline
Patent Type & Authority Applications(United States)
IPC IPC(8): G01R27/28H01M10/04H01M10/052H01M10/42G01R31/389
CPCG01R27/28H01M10/0422G01R31/389H01M10/4285H01M10/052H01M8/04537H01G13/00Y02E60/50Y02P70/50H01M10/48H01G11/14G01R31/367G01R31/64
Inventor KOBAYASHI, KIYOSHI
Owner NAT INST FOR MATERIALS SCI
Why Eureka
Try Eureka