Method for automated analysis of apical four-chamber images of the heart

an automatic analysis and digital image technology, applied in image analysis, image enhancement, medical science, etc., can solve the problems of increasing labor intensity, tedious tracing of endocardial borders on two-dimensional echocardiograms, and high subjective selection of borders, so as to maximize the long axis length of the left ventricle

Inactive Publication Date: 2004-03-16
FLORIDA UNIV OF A FLORIDA
View PDF17 Cites 108 Cited by
  • Summary
  • Abstract
  • Description
  • Claims
  • Application Information

AI Technical Summary

Benefits of technology

The "long axis" refers to an image of the heart which visualizes structures in a plane parallel to the longitudinal axis; in other words, the axis extending from the apex or tip of the heart to the base, which can include the aorta and posterior portions of the left and right atrium. While a parastemal long axis view can be obtained (that is a view from along side the sternum) a preferred long axis view in the present invention is the apical long-axis view; a view which is taken typically from the 5th or 6th intercostal space near the anterior axillary line and is taken from that position on the lateral chest aiming back towards the base of the heart. The typical orientation is then one where the apex of the heart is near the apex of the sector scan with the left ventricle to the left, right ventricle to the right and then posterior to these, near the bottom of the scan, the left atrium again in the left posterior portion and the right atrium in the fight posterior portion of the scan. In a preferred long axis view, the long axis passes through the epicardial apex. It is realized by echocardiographers, however, the probe or ultrasound transducer can frequently not be placed in a position to achieve this. What is expected as the best possible position which maximizes the long axis length of the left ventricle; that is, the distance from the epicardial apex to the mitral valve plane.

Problems solved by technology

Tracing of endocardial borders on two-dimensional echocardiograms, however, is tedious and the selected borders may be highly subjective.
Manually defining such boundaries becomes increasingly labor intensive when the analysis of a complete cardiac cycle is needed to provide a description of the systolic and diastolic wall motion pattern, or when a number of echocardiographic frames have to be processed in order to obtain an extended time-history of cardiac function.
However, most researchers have had difficulties with image enhancement and boundary detection with echocardiographic images because of the low signal-to-noise ratio and large discontinuities in such images.

Method used


Image

  • Method for automated analysis of apical four-chamber images of the heart
  • Method for automated analysis of apical four-chamber images of the heart
  • Method for automated analysis of apical four-chamber images of the heart

Examples


first embodiment

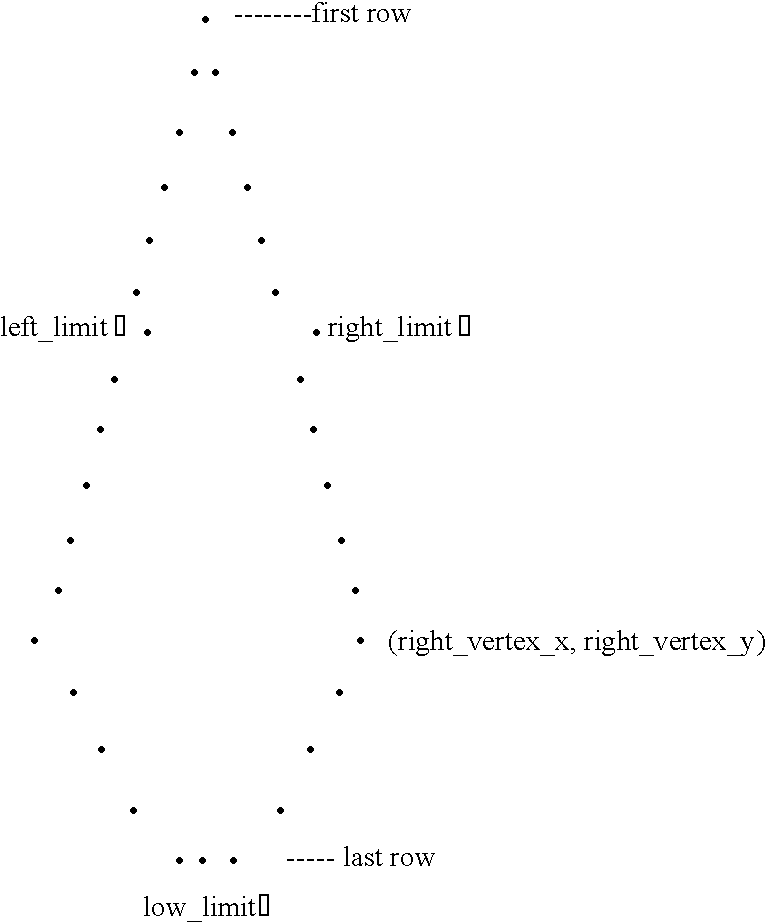
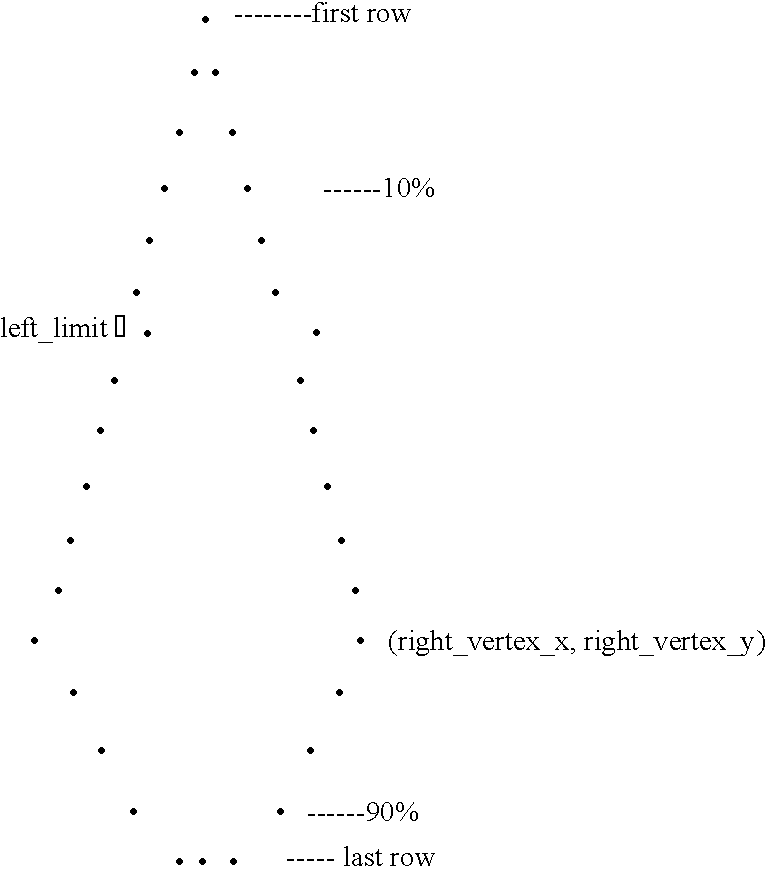
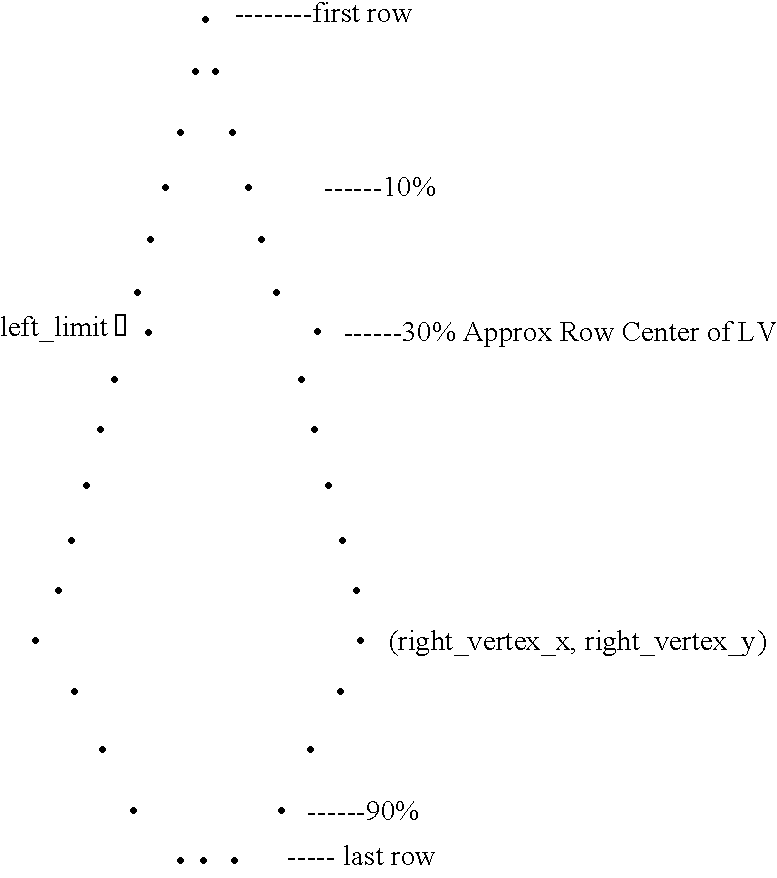
The first step in the automated process of the present invention is to determine the center-point of the left ventricle and a search region for border discrimination. The center-point is estimated in one embodiment by using circular arc filters to determine the approximate positions of the epicardial and endocardial borders. In another preferred embodiment, the center-point is estimated by first determining the position of the posterior epicardium using a circular arc filter, and then making an approximation of the positions of the right and left epicardium using elliptical arc filters. Once the center-point and search regions are estimated, the probable positions of the epicardial and endocardial borders are more closely approximated. In the inventive method, the probable positions of the epicardial and endocardial borders are approximated by generating amplitude distibutions along each oi a number of circular segments based on the computed center-point. In a second preferred embod...

example 1

5.1 Example 1

A Method for Evaluation of Enhancement Operations in Two-Dimensional Echocardiographic Images

The purpose of this Example is to report the methods and results of a locally calculated peak-to-background ratio that can be used to objectively estimate the degree of enhancement achieved in a two-dimensional echocardiographic image.

5.1.1 Methods

5.1.1.1 Data Acquisition

Two-dimensional short-axis ultrasound images were obtained retrospectively from six patient studies performed for routine diagnostic reasons in the clinical echocardiography laboratory at the University of Florida (Gainesville, Fla.). A representative end-diastolic and end-systolic frame from each of these six patient studies was converted from videotape to digital format. Analog-to-digital conversion was carried out to produce a 256.times.240 pixel image at 4-bit depth (16 gray levels). From each of these images a 120.times.140 pixel region of interest was selected by manual windowing. The resulting 12 regions ...

example 2

5.2 Example 2

Automatic Identificaiton of Papillary Muscles in Left-Ventricular Short-Axis Echocardiographic Images

When screening left ventricular short-axis echocardiographic images. cardiologists partly depend on the wall motion and the wall thickness to make an assessment about the patient's cardiac function. Even though computation of wall motion and wall thickness are a simple task, if the endocardial and epicardial borders have been found, efforts at real-time (or near-real time) quantitation have met with limited success.

While a commercially available system has a feature referred to as Automated Border Definition (ABD), the feature uses a threshold method based on the integrated backscatter to identify edges throughout the entire image. As with any threshold method, the ABD feature can be visualized as a method that uses the ultrasound backscatter to create a new surface which has value one at locations with intensity above threshold (tissue) and zero at locations with intens...


PUM


Abstract

A method for quantitatively analyzing digital images of approximately elliptical body organs, and in particular, echocardiographic images is provided. In particular, methods are disclosed for obtaining short-axis apical four-chamber views of a heart, and particularly for obtaining high-quality automated images of particular regions of the heart muscle, as viewed along its long axis.

Description

1.0 BACKGROUND OF THE INVENTION1.1. Field of the InventionThe invention concerns systems for automatically analyzing echocardiographic digital images of the heart, especially two-dimensional images acquired using apical four-chamber view of the heart. The systems preferably employ a collection of matched filters on the images to automatically locate and measure features of the heart.1.2. Description of Related ArtTwo-dimensional ultrasonic imaging is used as an important non-invasive technique in the comprehensive characterization of a number of body organs. In ultrasonic imaging, a sound pulse is sent along a ray from a transducer towards the organ that is being imaged. The pulse is attenuated and reflected when it hits a medium with an acoustic impedance different from that of the medium in which the pulse is traveling. The time the sound pulse takes in transit is a measure of the distance of the medium interface from the transducer. The amount of energy that is reflected is a mea...

Claims


Application Information

Patent Timeline
Patent Type & Authority Patents(United States)
IPC IPC(8): G06T5/00G06T7/00
CPCG06T7/0012G06T7/0083G06T7/403G06T2207/10132G06T2207/30048G06T7/12G06T7/44
Inventor GEISER, EDWARD A.WILSON, DAVID C.
Owner FLORIDA UNIV OF A FLORIDA
Why Eureka
Try Eureka