Method for storing and transporting crude oil
a crude oil and crude oil technology, applied in the field of crude oil storage and crude oil transportation, can solve the problems of oil flow loss, equipment failure, and clogging of wellbore perforations,
- Summary
- Abstract
- Description
- Claims
- Application Information
AI Technical Summary
Benefits of technology
Problems solved by technology
Method used
Image
Examples
example 1
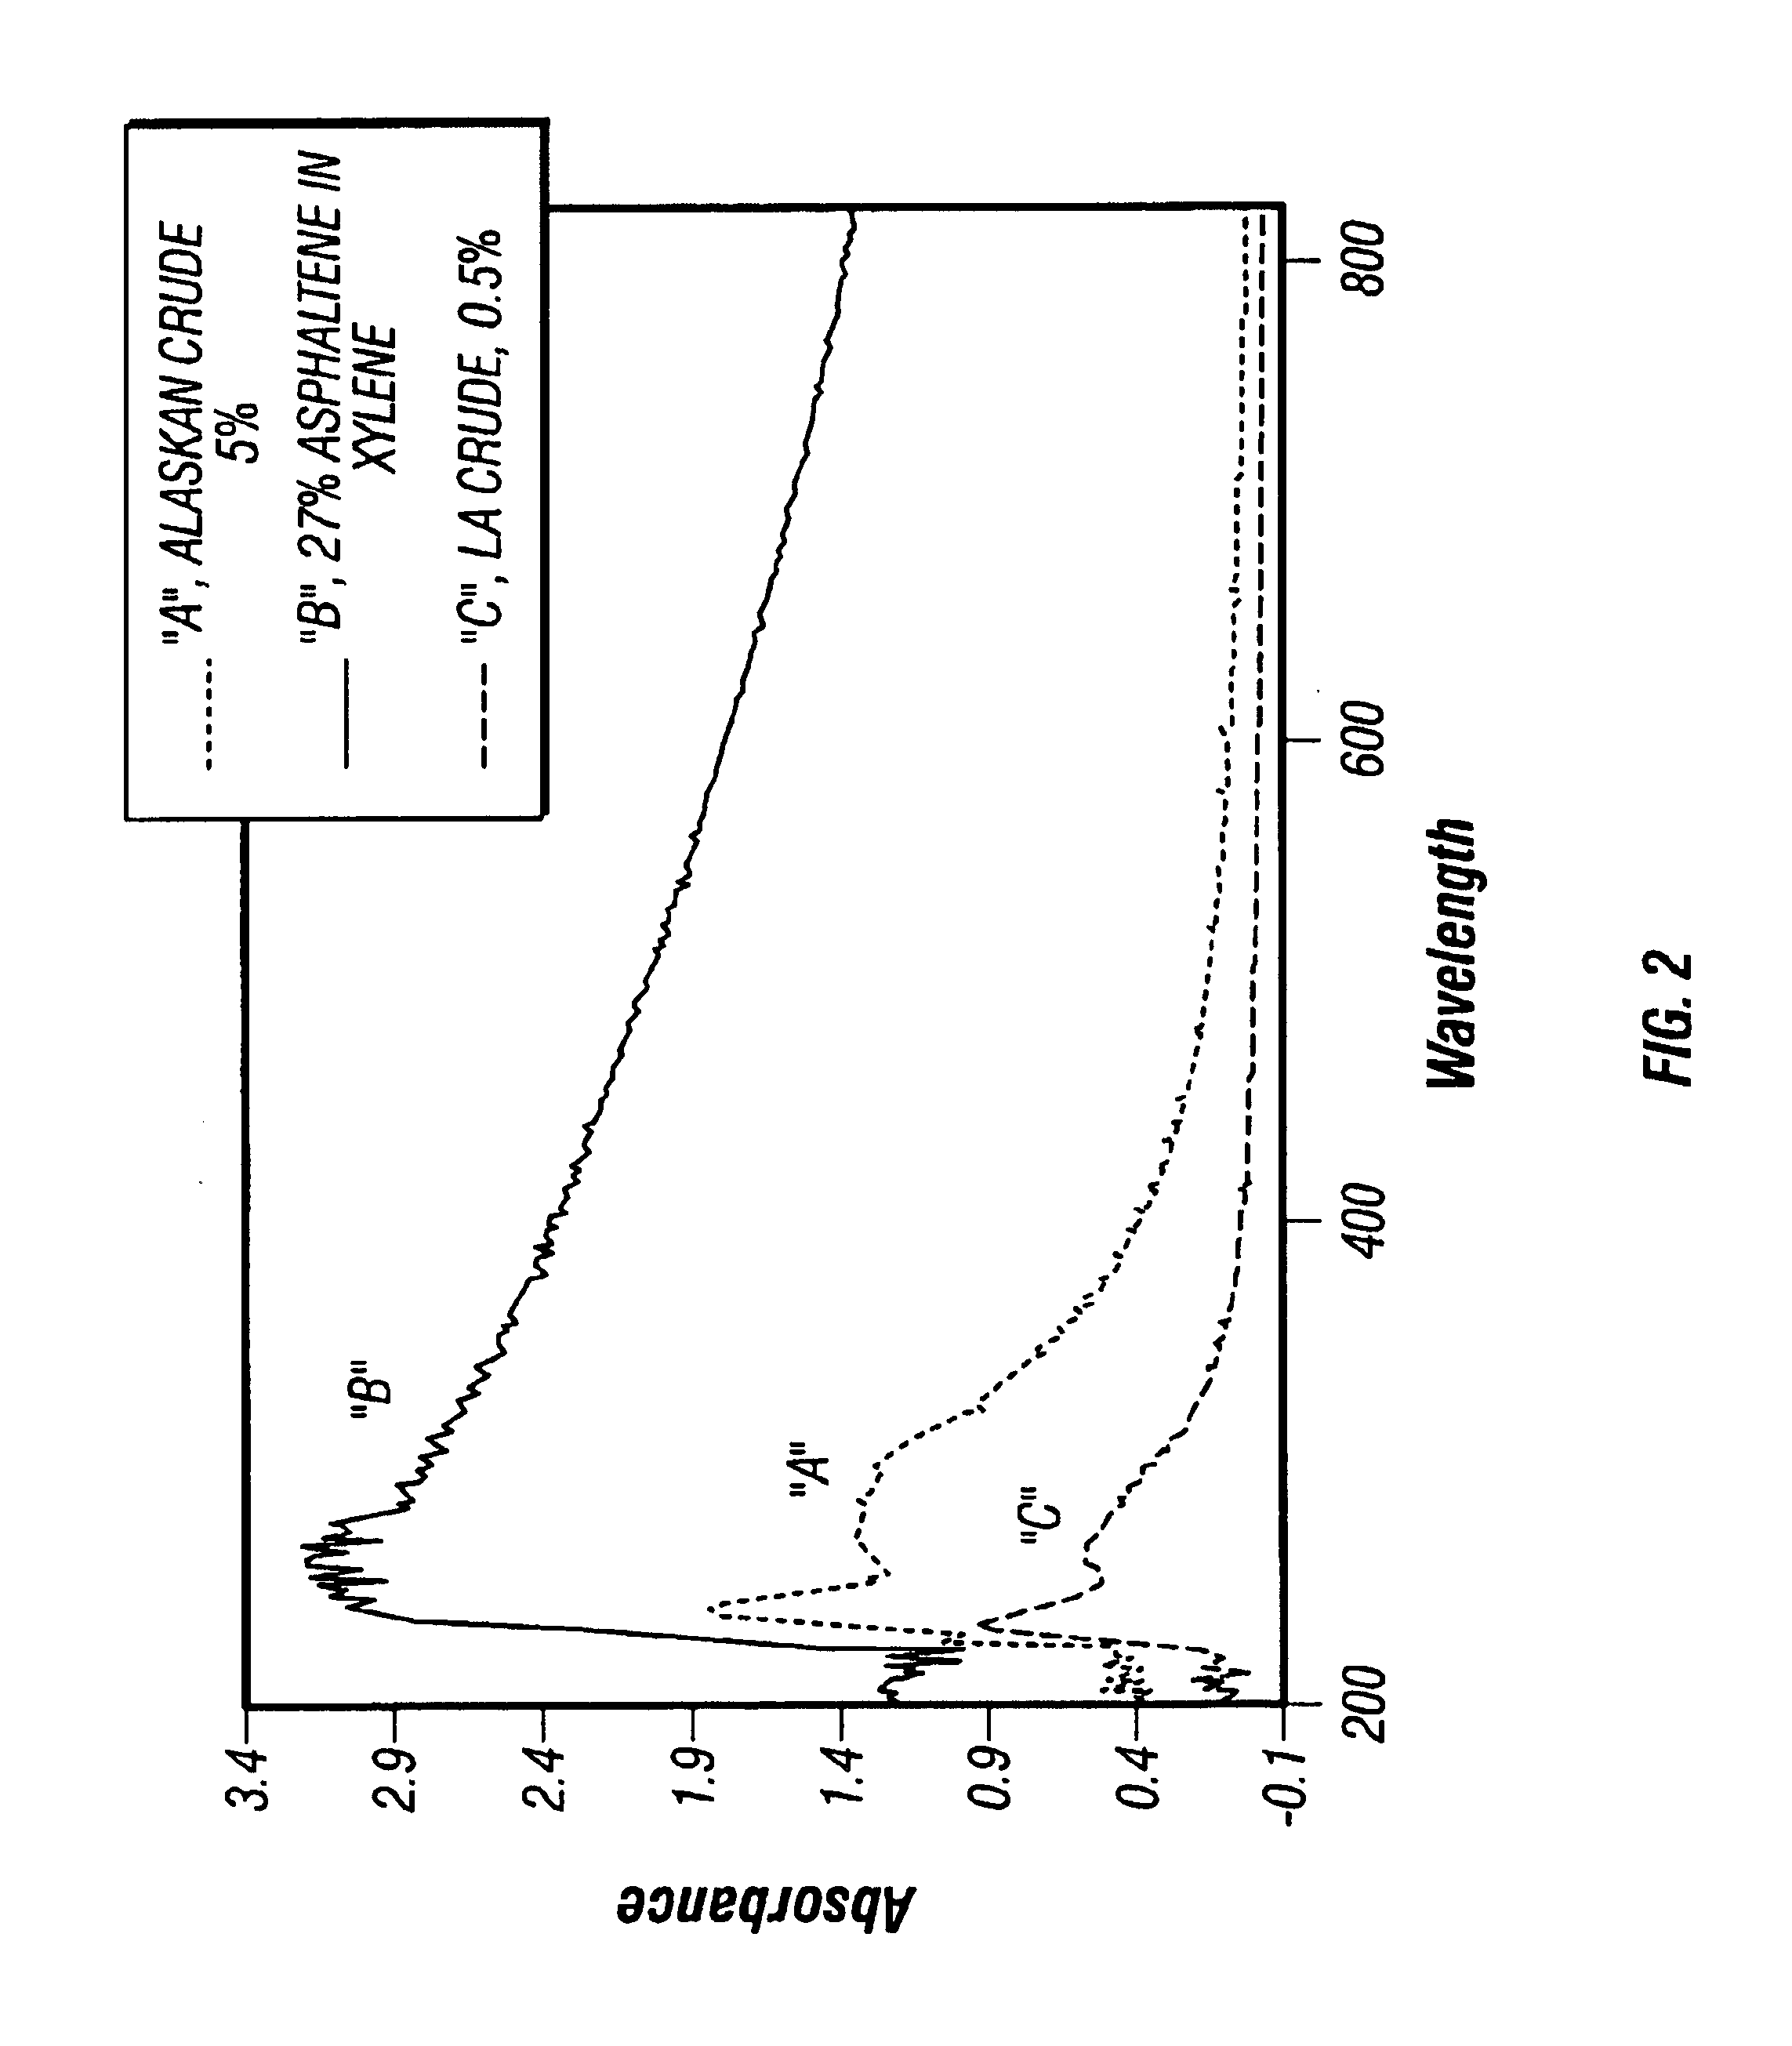
[0055]Laboratory measurements utilizing a UV / visible Spectrophotometer and a fiber-optic ATR probe with air as a reference are used to determine the absorbance as a function of wavelength for different concentrations of asphaltene in crude oil. Spectrum A is obtained with an Alaskan crude with 5 wt % asphaltenes; spectrum B, a synthetic mixture of 2.7 wt % of asphaltenes in xylenes; and spectrum C, a Louisiana crude having about 0.5 wt % asphaltenes. The spectra A-C, FIG. 2, show that there is a monotonic correlation between the asphaltenes concentrations and ATR absorbances in a wavelength range of from about 220 nm to about 400 nm.
example 2
[0056]Example 2 is carried out in a similar manner as Example 1, except that the various samples are measured with toluene as a reference. ATR spectra D, E, and F are obtained with 3 wt %, 2 wt % and 1 wt % of asphaltenes in crude oil respectively. The results are shown in FIG. 3. The spectra in FIG. 3 also show that there is a monotonic correlation between the asphaltenes concentrations and ATR absorbances in a wavelength range of from about 220 nm to about 550 nm. These experiments described above in FIGS. 2 and 3 indicate the suitability of an ATR probe for directly measuring asphaltene concentration in crude oil.
example 3
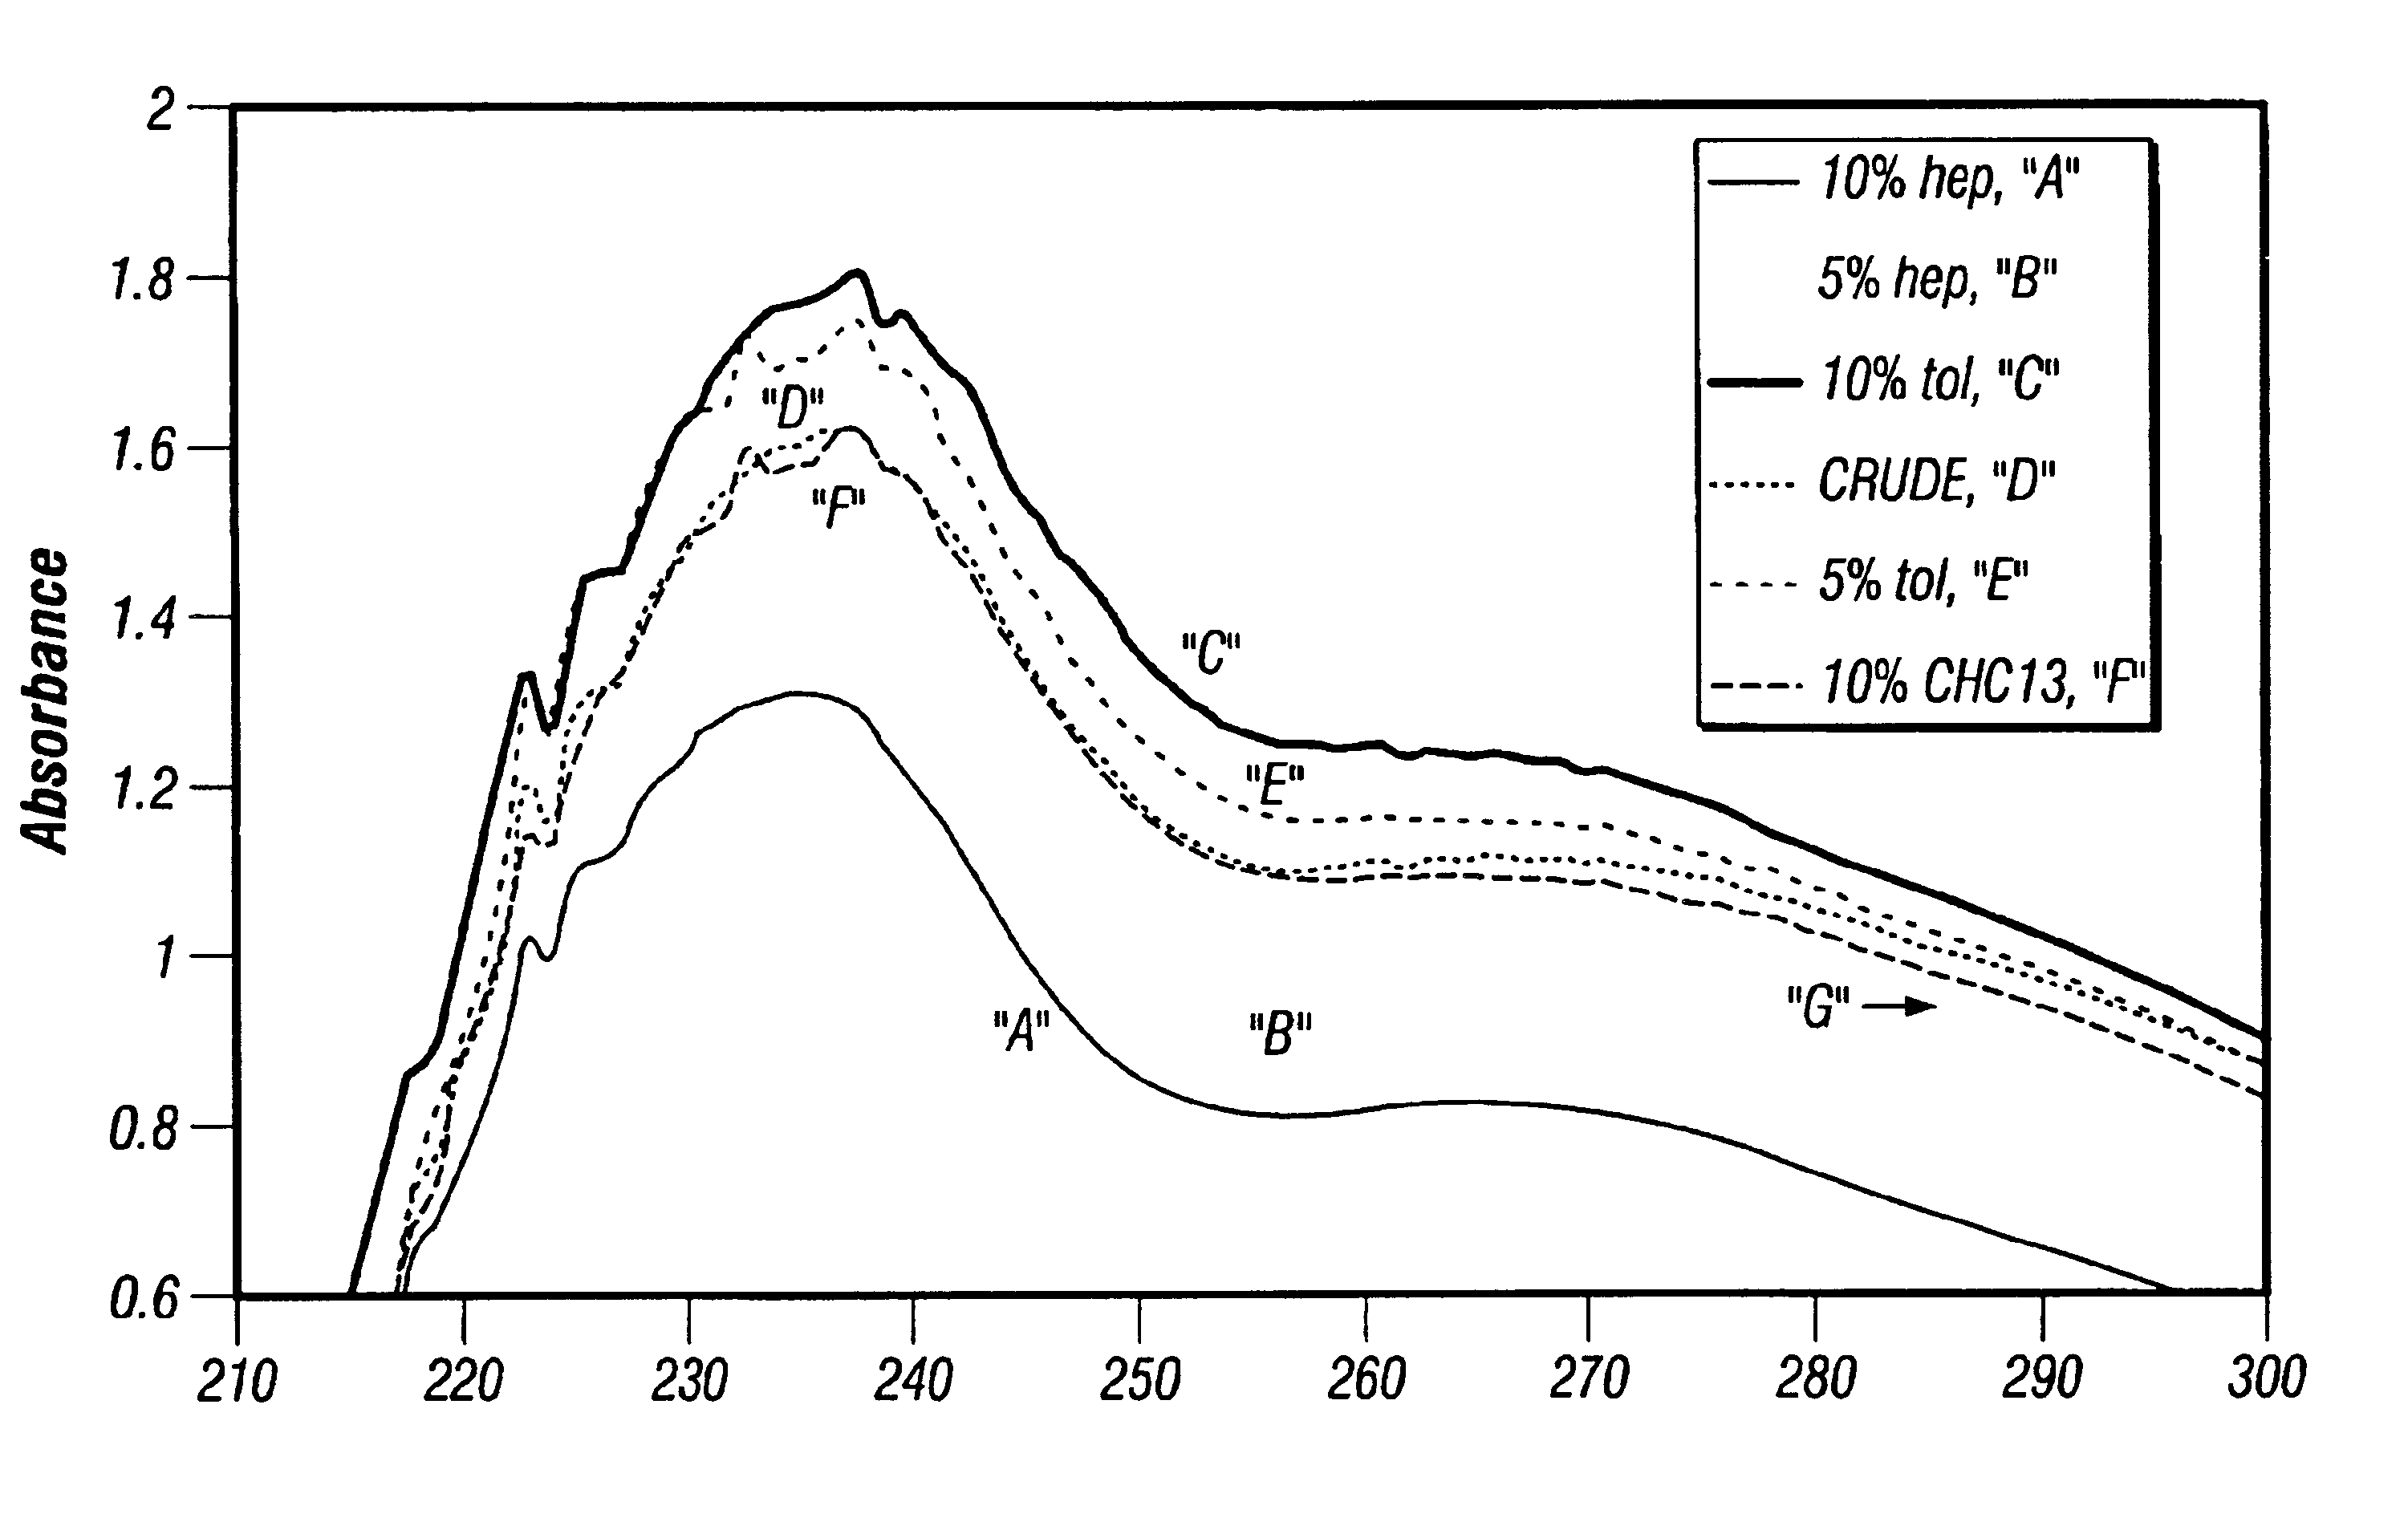
[0057]Asphaltenes are extracted from a crude sample by precipitation with heptane. The extracted asphaltenes are added to a crude oil sample and the absorbance measured with the probe at 233 nm. The crude originally contained 0.44% asphaltenes. The resulting plot of % asphaltenes vs. absorbance yields a linear correlation with an R2=0.9959. The results are displayed below in Table 1 and in graphical form in FIG. 4.
[0058]
TABLE 1Absorbance @ 233 nmTotal % Asphaltenes of Sample0.35290.540.38330.940.43121.440.53892.440.77195.44
PUM
 Abstract
Description
Claims
Application Information
 - R&D
- Intellectual Property
- Life Sciences
- Materials
- Tech Scout
- Unparalleled Data Quality
- Higher Quality Content
- 60% Fewer Hallucinations
Browse by: Latest US Patents, China's latest patents, Technical Efficacy Thesaurus, Application Domain, Technology Topic, Popular Technical Reports.
© 2025 PatSnap. All rights reserved.Legal|Privacy policy|Modern Slavery Act Transparency Statement|Sitemap|About US| Contact US: help@patsnap.com


