Integration of graphic display elements, process modules and control modules in process plants

a technology of process plants and graphic display elements, applied in the field of integrated, intelligent control and simulation environment, can solve the problems of difficult to animate objects within operator displays, difficult to program the process control system to recognize system-level conditions or errors, and no organized manner of detecting certain conditions within a plant, so as to achieve better simulation and control, improve the effect of complete information, and easy use and implementation

Inactive Publication Date: 2006-09-19
FISHER-ROSEMOUNT SYST INC
View PDF77 Cites 186 Cited by
  • Summary
  • Abstract
  • Description
  • Claims
  • Application Information

AI Technical Summary

Benefits of technology

[0010]Multiple smart process objects may be connected together to create a display that depicts the operation of the different portions of the process plant and to create a process module that models or simulates the behavior of the portion of the process plant. In that line, each process module (and each display associated with a process module) receives inputs and produces outputs corresponding to the fluid, gas, or other materials moving through the plant and models or simulates the behavior of the process elements in the process plant with respect to their effect on the materials moving through the plant. In this manner, the graphic display portion of the smart process object may be used to depict the operation of the element within the plant (and the role or effect of that element in the plant) and the simulation element of the smart process object may be used to simulate the effect of the actual physical element on the movement of the fluid or other material in the plant. Data from the actual plant (e.g., as measured within the plant) may also be communicated to and depicted within the graphic display created using smart process objects.
[0011]To perform more advanced and accurate simulation, streams of material may be modeled within the plant. Such streams may represent fluids, solids or gases flowing or moving through the plant and each stream may include properties or parameters of the stream such as pressure, volume, density, flow rate, composition, etc. which may change as the stream moves through the different elements of the process module. Because the streams flow through the inputs and outputs of the process control elements, the properties of the streams are generally effected by the process elements (valves, tanks, etc.) through which the streams flow and, as a result, the individual elements within the process module may include algorithms to simulate the effect of those process elements on the streams provided at the inputs thereof.
[0012]To effect the operation of the graphic displays or the process modules created from smart process objects, an operator workstation or other computer runs an execution engine that executes the created graphic displays or process modules. As part of this operation, the process modules may execute methods, called flow algorithms, that, can be used to detect process conditions, especially on a system-level basis and to simulate the effect of process elements on the streams flowing through the plant. As a result, the process modules and graphic displays created from the smart process objects enable the implementation of condition and error detection routines at the operator display device, and may work together with or eliminate the need to provide this functionality down within the controller and field devices of the plant. The process modules also provide the operator or configuration engineer with another degree of programming flexibility within the process plant that can be used to provide better and more-complete information to the operator while still being easy to use and implement. Still further, the graphic displays may be animated with information determined by or calculated by flow algorithms of the process flow modules to provide the operator with additional information.
[0013]Still further, process modules may be communicatively interconnected with displays and control modules to provide for better simulation and control within the process plant. In particular, actual values of process parameters may be measured by the control module and provided to the process module that simulates the portion of the plant being controlled and these actual measured values may be compared to the predicted values developed by the process module to detect potential problems within the plant, such as a broken sensor, etc. Alternatively, one or more simulation outputs of the process module may be fed to one or more simulation inputs of function blocks or other elements within the control module and the control module may use these simulation inputs to perform control activities when the control module detects an error with respect to the measured valve or when the control module (or operator overseeing operation of the control module) detects that the control module is not functioning properly.
[0014]To maximize the usefulness of this enhanced integration, a configuration engineer, when configuring the process modules used in the process plant may select from any number of standard or provided algorithms to be run by the different objects within the process module, or may be able to provide a proprietary or user-specified algorithm to more accuracy model or simulate the operation of the actual plant. Additionally, the configuration engineer may be able to tie in a high fidelity simulation package, such as those provided by MIMIC, HYSYS, etc. to the process module so that the process module implements and has access to the simulation parameters developed by the high fidelity simulation package, as if those values were generated by the process module itself. Such versatility enables an operator or other user to have varying degrees of simulation capabilities which can be fed back into a process graphic display and which can be used by the control module to provide better or enhanced control within the process plant. This integrated simulation can also be used to provide for enhanced error or problem detection within the process plant and to provide simulated control inputs to the controller when actual or measured control inputs are unavailable.

Problems solved by technology

While error detection and other programming is useful for detecting conditions, errors, alarms, etc. associated with control loops running on the different controllers and problems within the individual devices, it is difficult to program the process control system to recognize system-level conditions or errors that must be detected by analyzing data from different, possible diversely located devices within the process plant.
Still further, operator displays have typically not been used to indicate or present such system-level condition information to operators or maintenance personnel and, in any event, it is difficult to animate objects within operator displays with these alternate sources of information or data for the different elements within the display.
Moreover, there is currently no organized manner of detecting certain conditions within a plant, such as flow conditions and mass balances, as materials move through a plant, much less an easily implementable system for performing these functions on a system-level basis.
Likewise, it can be difficult to set up or create a simulation of the process plant or a portion of the process plant as simulation activities must typically be performed separately from the display and control activities performed in the on-line environment of the process plant.
Still further, if a simulation of the plant is created, it is difficult, if not impossible, to integrate this simulation with the operator displays or with the control modules being implemented within the plant.

Method used


Image

  • Integration of graphic display elements, process modules and control modules in process plants
  • Integration of graphic display elements, process modules and control modules in process plants
  • Integration of graphic display elements, process modules and control modules in process plants

Examples


Embodiment Construction

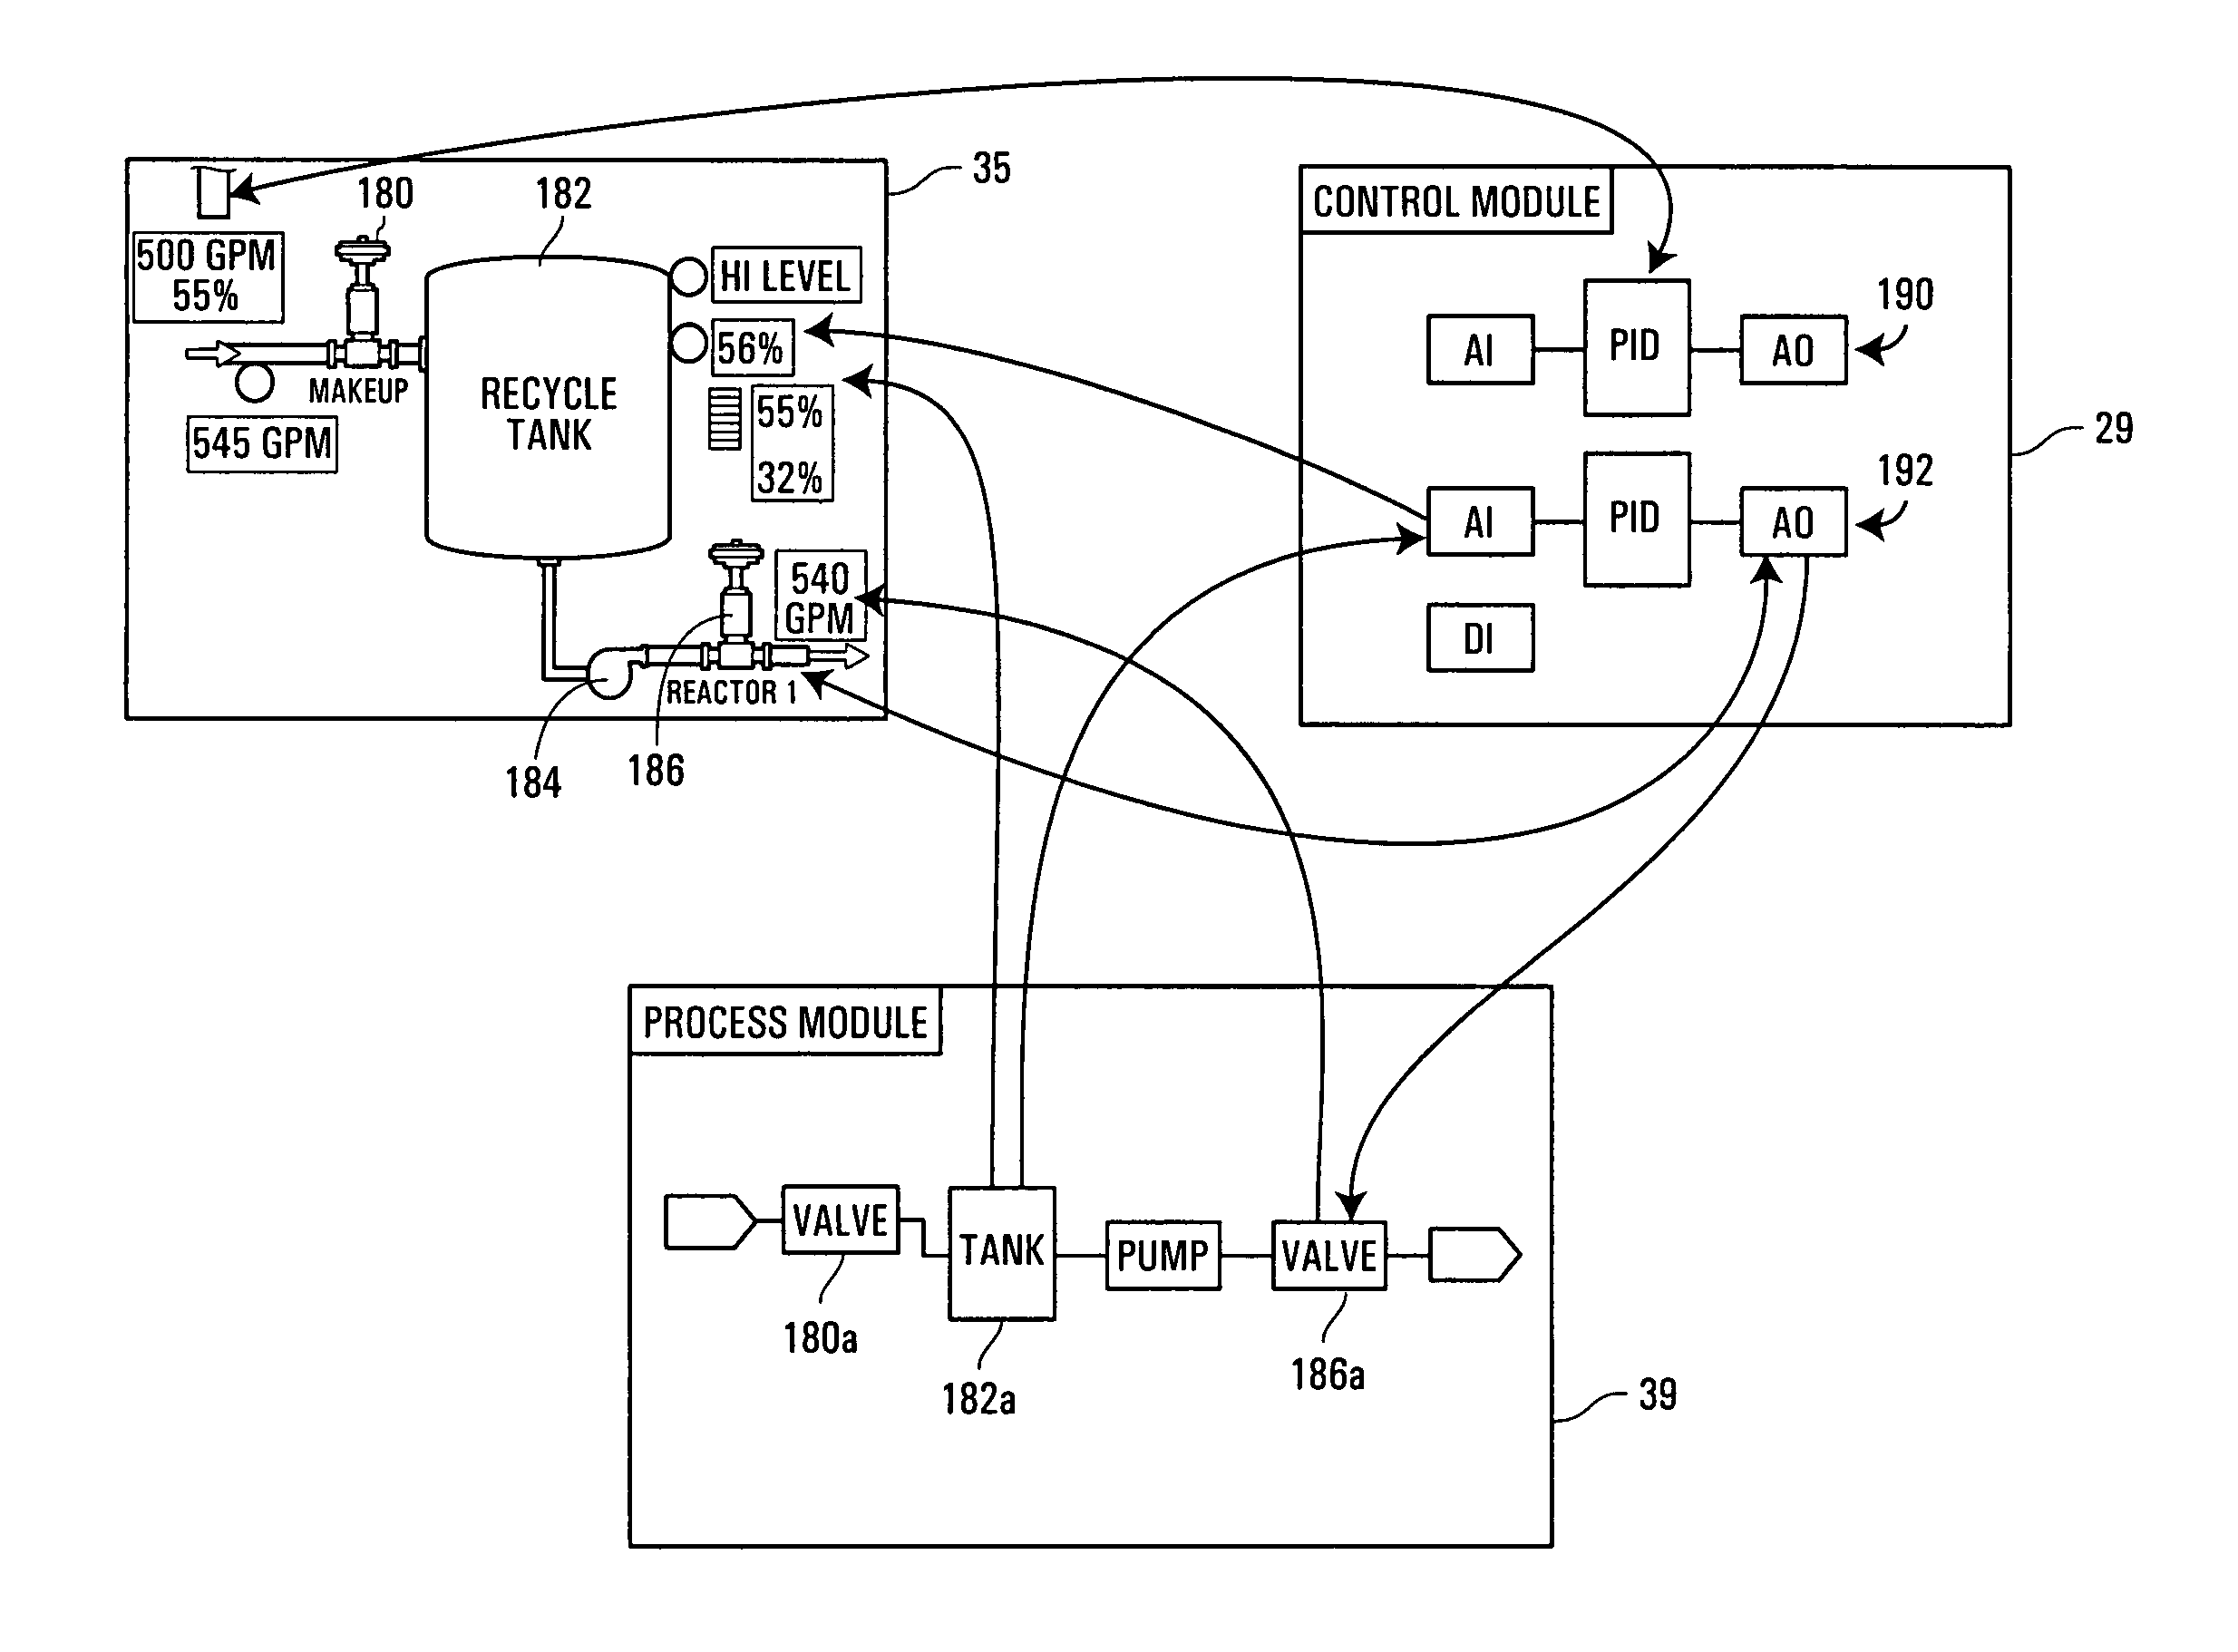
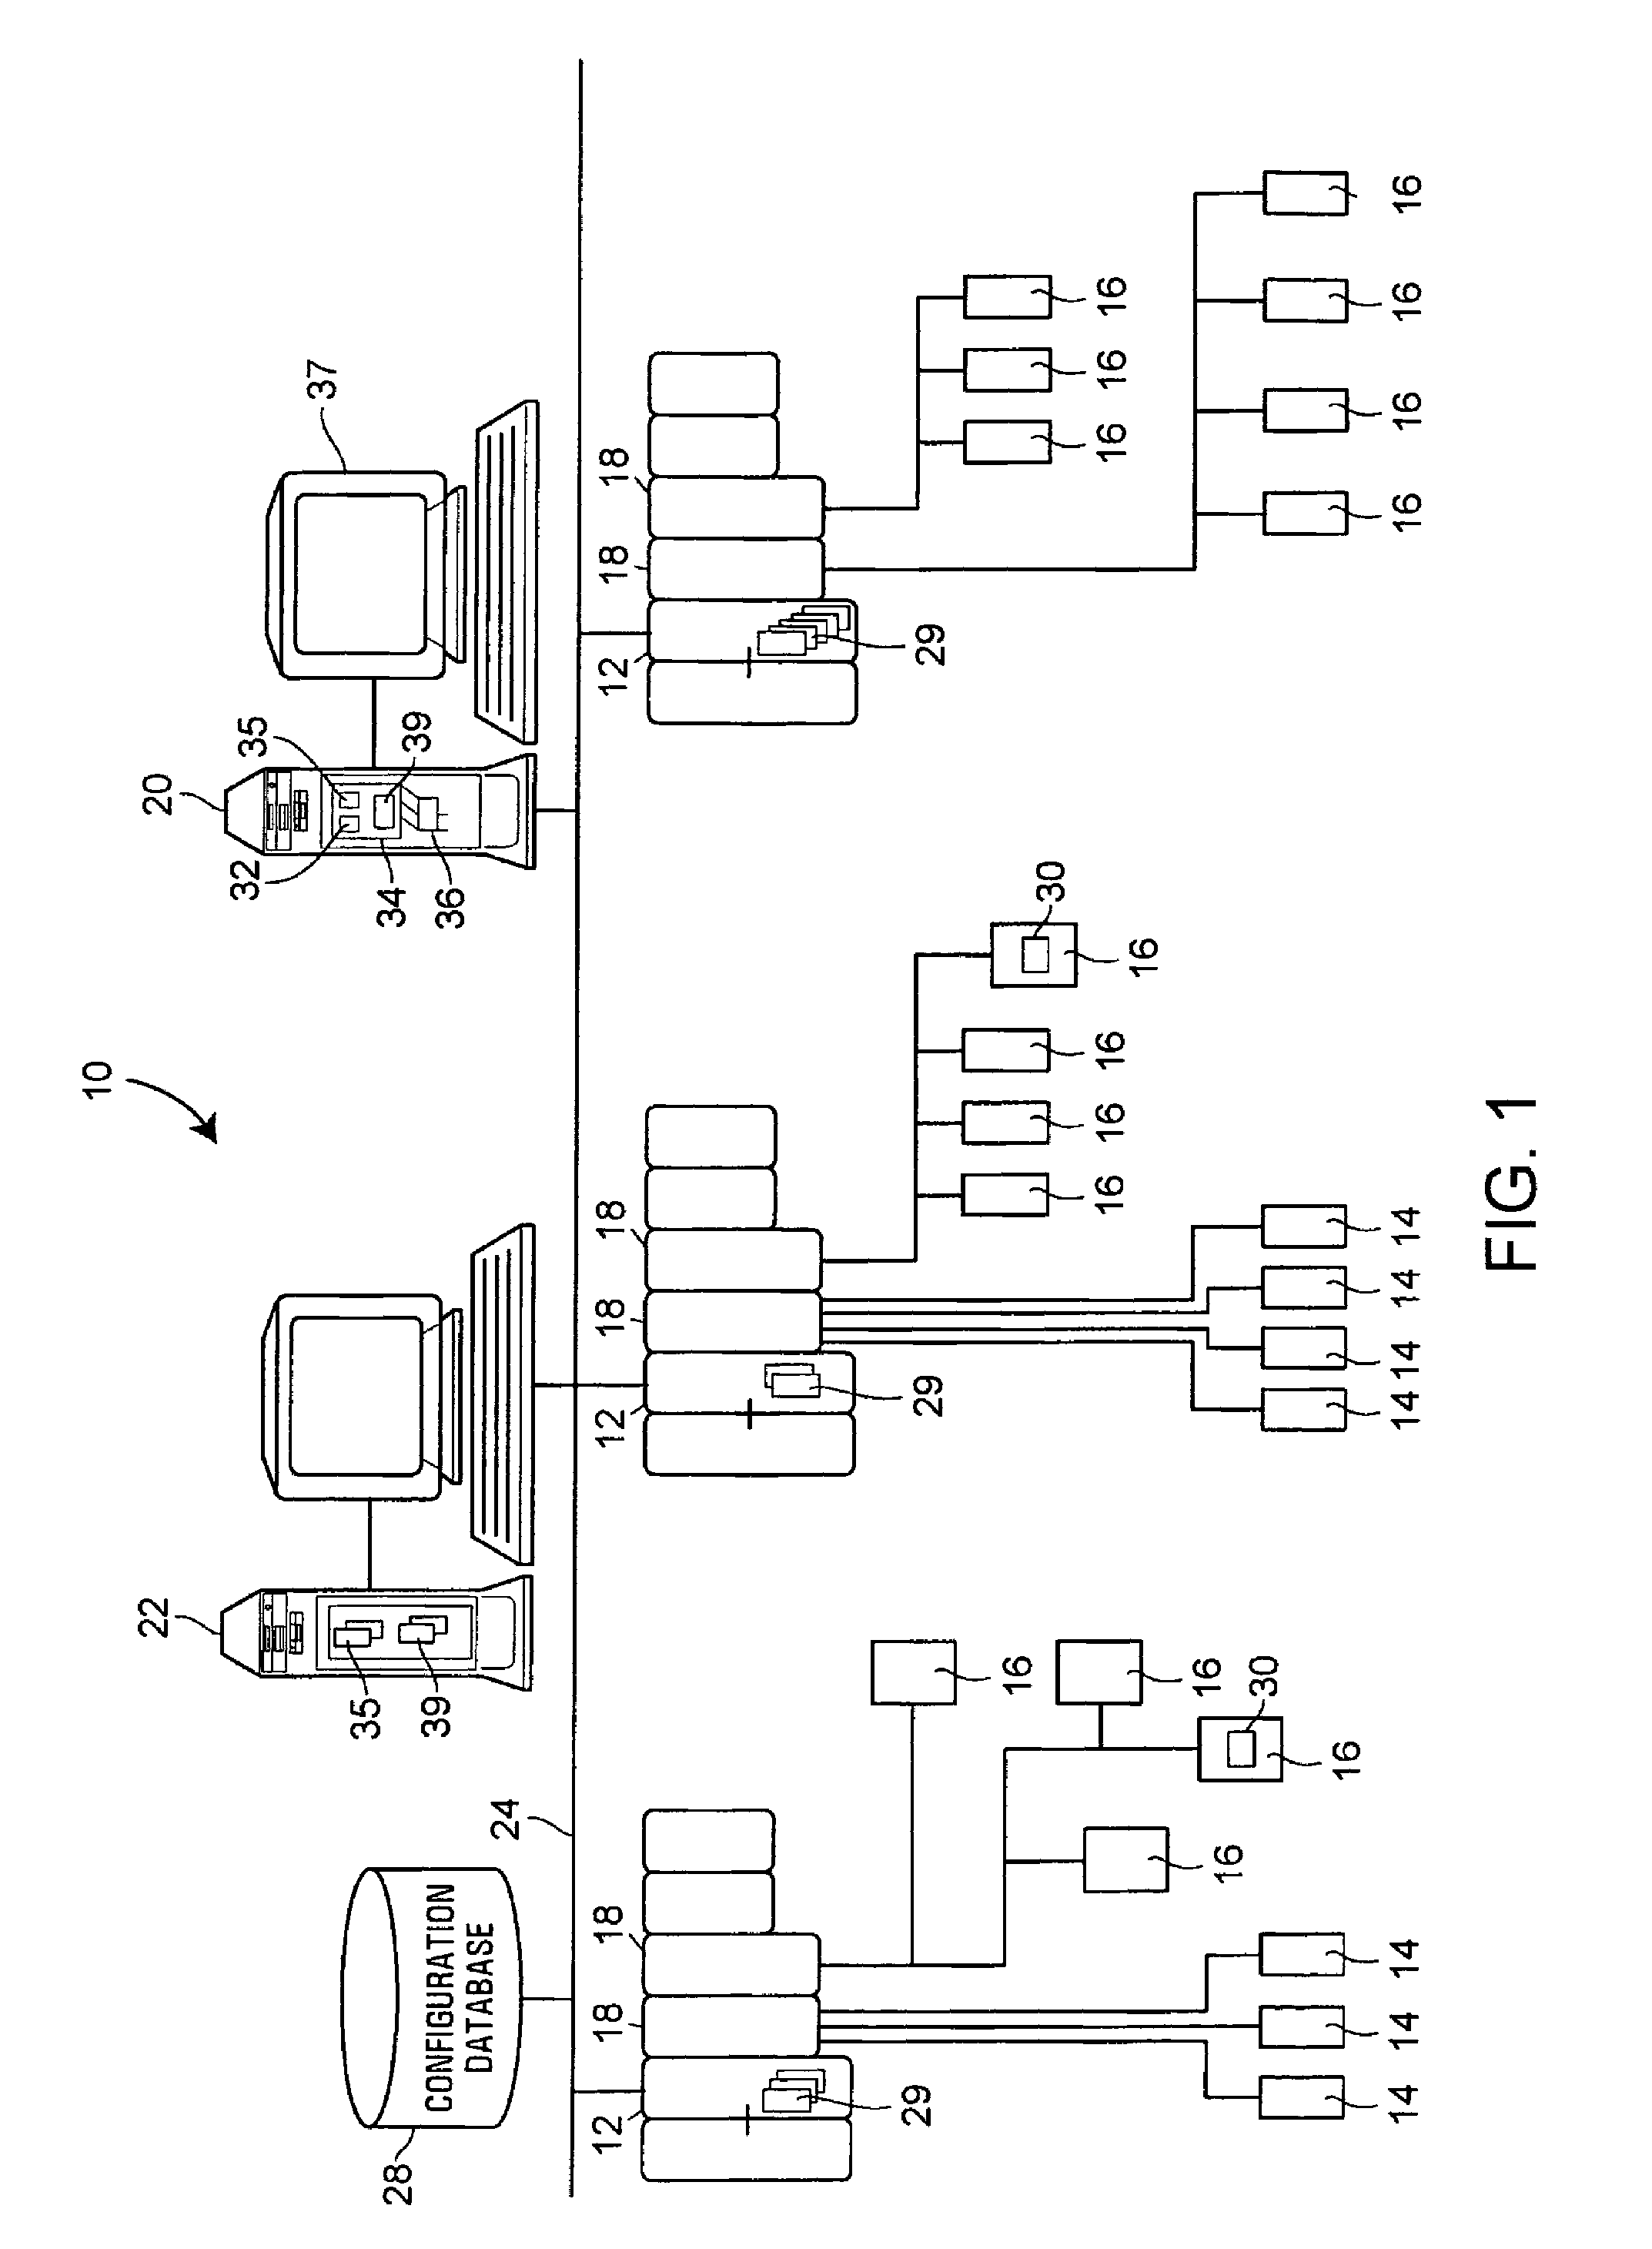
[0024]Referring now to FIG. 1, an example process plant 10 in which smart process objects used to form process graphic displays and process modules, both of which may be integrated with control modules to provide enhanced control and simulation within the plant environment, is illustrated in detail. In particular, the process plant 10 uses a distributed process control system having one or more controllers 12, each connected to one or more field devices 14 and 16 via input / output (I / O) devices or cards 18 which may be, for example, Fieldbus interfaces, Profibus interfaces, HART interfaces, standard 4-20 ma interfaces, etc. The controllers 12 are also coupled to one or more host or operator workstations 20 and 22 via a data highway 24 which may be, for example, an Ethernet link. A database 28 may be connected to the data highway 24 and operates as a data historian that collects and stores parameter, status and other data associated with the controllers and field devices within the pl...


PUM


Abstract

Graphic displays, which display information about process elements and the manner in which these elements are connected within a process, process modules, which simulate the operation of the elements depicted within the graphic displays and control modules, which perform on-line control activities within a process, may be communicatively connected together to provide a combined control, simulation and display environment that enables enhanced control, simulation and display activities. Smart process objects, which have both graphical and simulation elements, may used to create one or more graphic displays and one or more process simulation modules, each having elements which may communicate with one another to share data between the graphic displays and the process modules. Additionally, function blocks within control modules executed in the process plant may reference the elements within the graphic displays and the process modules (and vice versa) so that control modules may use simulated data developed by the process modules to perform better control, so that process modules may perform better simulation using actual pant data from the control modules, and so that the graphic displays may be used to illustrate actual process data and/or simulated process data as developed by the control modules and the process modules.

Description

RELATED APPLICATION[0001]This is a continuation-in-part application of and claims priority to U.S. patent application Ser. No. 10 / 278,469, entitled “Smart Process Modules and Objects in Process Plants” which was filed on Oct. 22, 2002, the entire disclosure of which is hereby expressly incorporated by reference herein.TECHNICAL FIELD[0002]The present invention relates generally to process plants and, more particularly, to an intelligent control and simulation environment that enables user viewing, simulation and control to be integrated at the system level of the process plant control architecture.DESCRIPTION OF THE RELATED ART[0003]Distributed process control systems, like those used in chemical, petroleum or other processes, typically include one or more process controllers communicatively coupled to one or more field devices via analog, digital or combined analog / digital buses. The field devices, which may be, for example, valves, valve positioners, switches and transmitters (e.g...

Claims


Application Information

Patent Timeline
Patent Type & Authority Patents(United States)
IPC IPC(8): G05B15/00G05B11/01G06F11/00G06F15/00G06F19/00G06G7/48G06G7/50G05B23/02F24D19/10F24F11/00G05B15/02G05B19/02G05B19/042G05B19/4093G05B19/418G06F17/30G09G5/00H04B1/74
CPCG05B15/02G05B19/0428G05B23/0267G05B2219/25428G05B2219/23258G05B2219/23261G05B2219/23255Y02P80/10Y02P90/02G05B19/0425G05B19/4093G05B19/418G06F16/289
Inventor BLEVINS, TERRENCENIXON, MARKLUCAS, MICHAELWEBB, ARTHURBEOUGHTER, KEN
Owner FISHER-ROSEMOUNT SYST INC
Why Eureka
Try Eureka