
Method and system for tracing and displaying execution of nested functions

a nested function and execution method technology, applied in the field of program debugging, can solve the problems of inability to identify errors, difficult to analyze more deeply the execution of nested functions, and inability to identify non-fatal failures, etc., to achieve the effect of reducing the time needed to find useful information in huge trace files and increasing productivity

Inactive Publication Date: 2006-10-10
IBM CORP
View PDF23 Cites 79 Cited by
  • Summary
  • Abstract
  • Description
  • Claims
  • Application Information

AI Technical Summary

Benefits of technology

[0022]Productivity is increased when debugging a complex program product using, for instance, C-language, which is multi-threaded and uses deamons. With the solution of the present invention, the time needed to find useful information in huge trace files is minimized.

Problems solved by technology

However, even using a graphical trace analyzer, it is not possible today to analyze more deeply the execution of nested functions.
Non-fatal failures are very difficult to identify as the application being a deamon, despite an error, continues to run, always generating numerous trace logs.
The cause of the error cannot be identified because the cause is hidden by a failing event or a correlation of failing events.

Method used


Image

  • Method and system for tracing and displaying execution of nested functions
  • Method and system for tracing and displaying execution of nested functions
  • Method and system for tracing and displaying execution of nested functions

Examples


Embodiment Construction

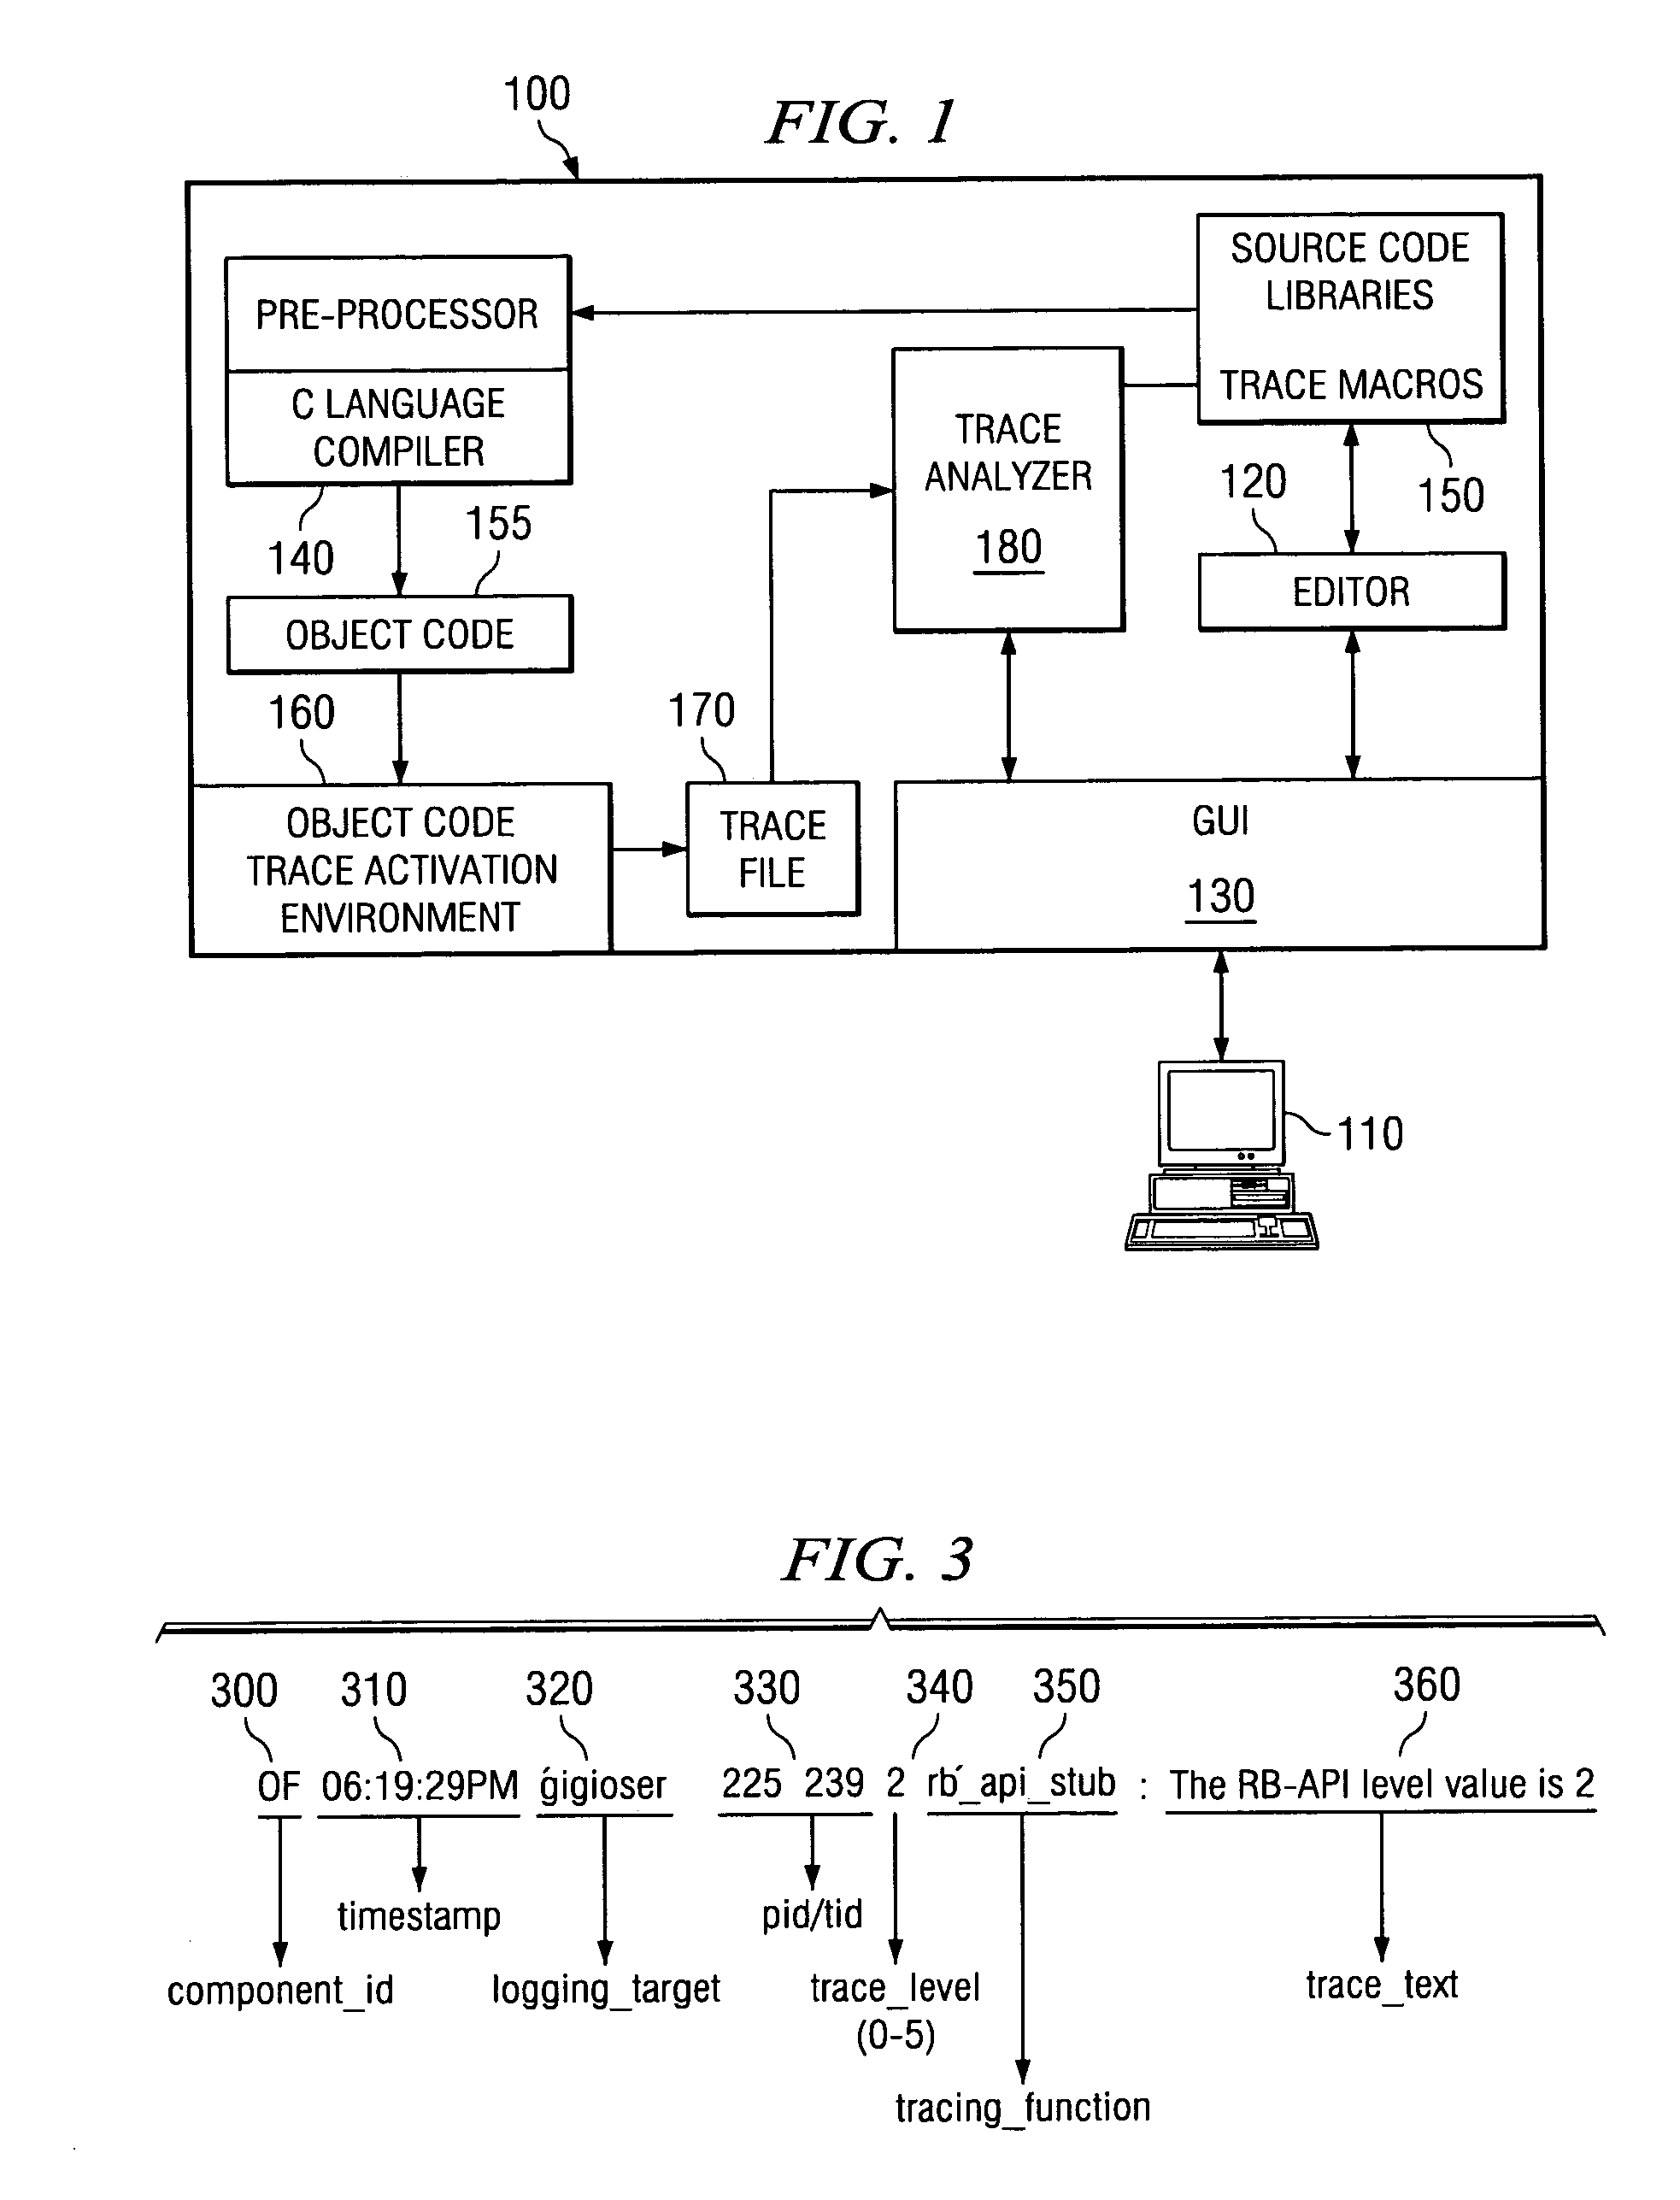
[0028]FIG. 1 illustrates a computing environment implementing a trace method according to a preferred embodiment. Programs (100) are installed on a computer, which may be workstation (110) of the developer or a remote computer. The developer or programmer accesses source code from workstation (110) through editor (120) using graphical user interface (GUI, 130). Pre-processor and C language compiler programs (140) compile source code (150) that the programmer wants to test and which is stored in libraries. Code libraries are partitioned, each partition comprising a code component corresponding to the coding of a C language function. Source code (150) includes trace macros added by the programmer to his original source code that the programmer wants to test. Code macros, including the trace macros, are expanded by pre-processor (140), which generates intermediate macros to be compiled by C language compiler (140). The output of C language compiler (140) is object code (155), which is ...


PUM


Abstract

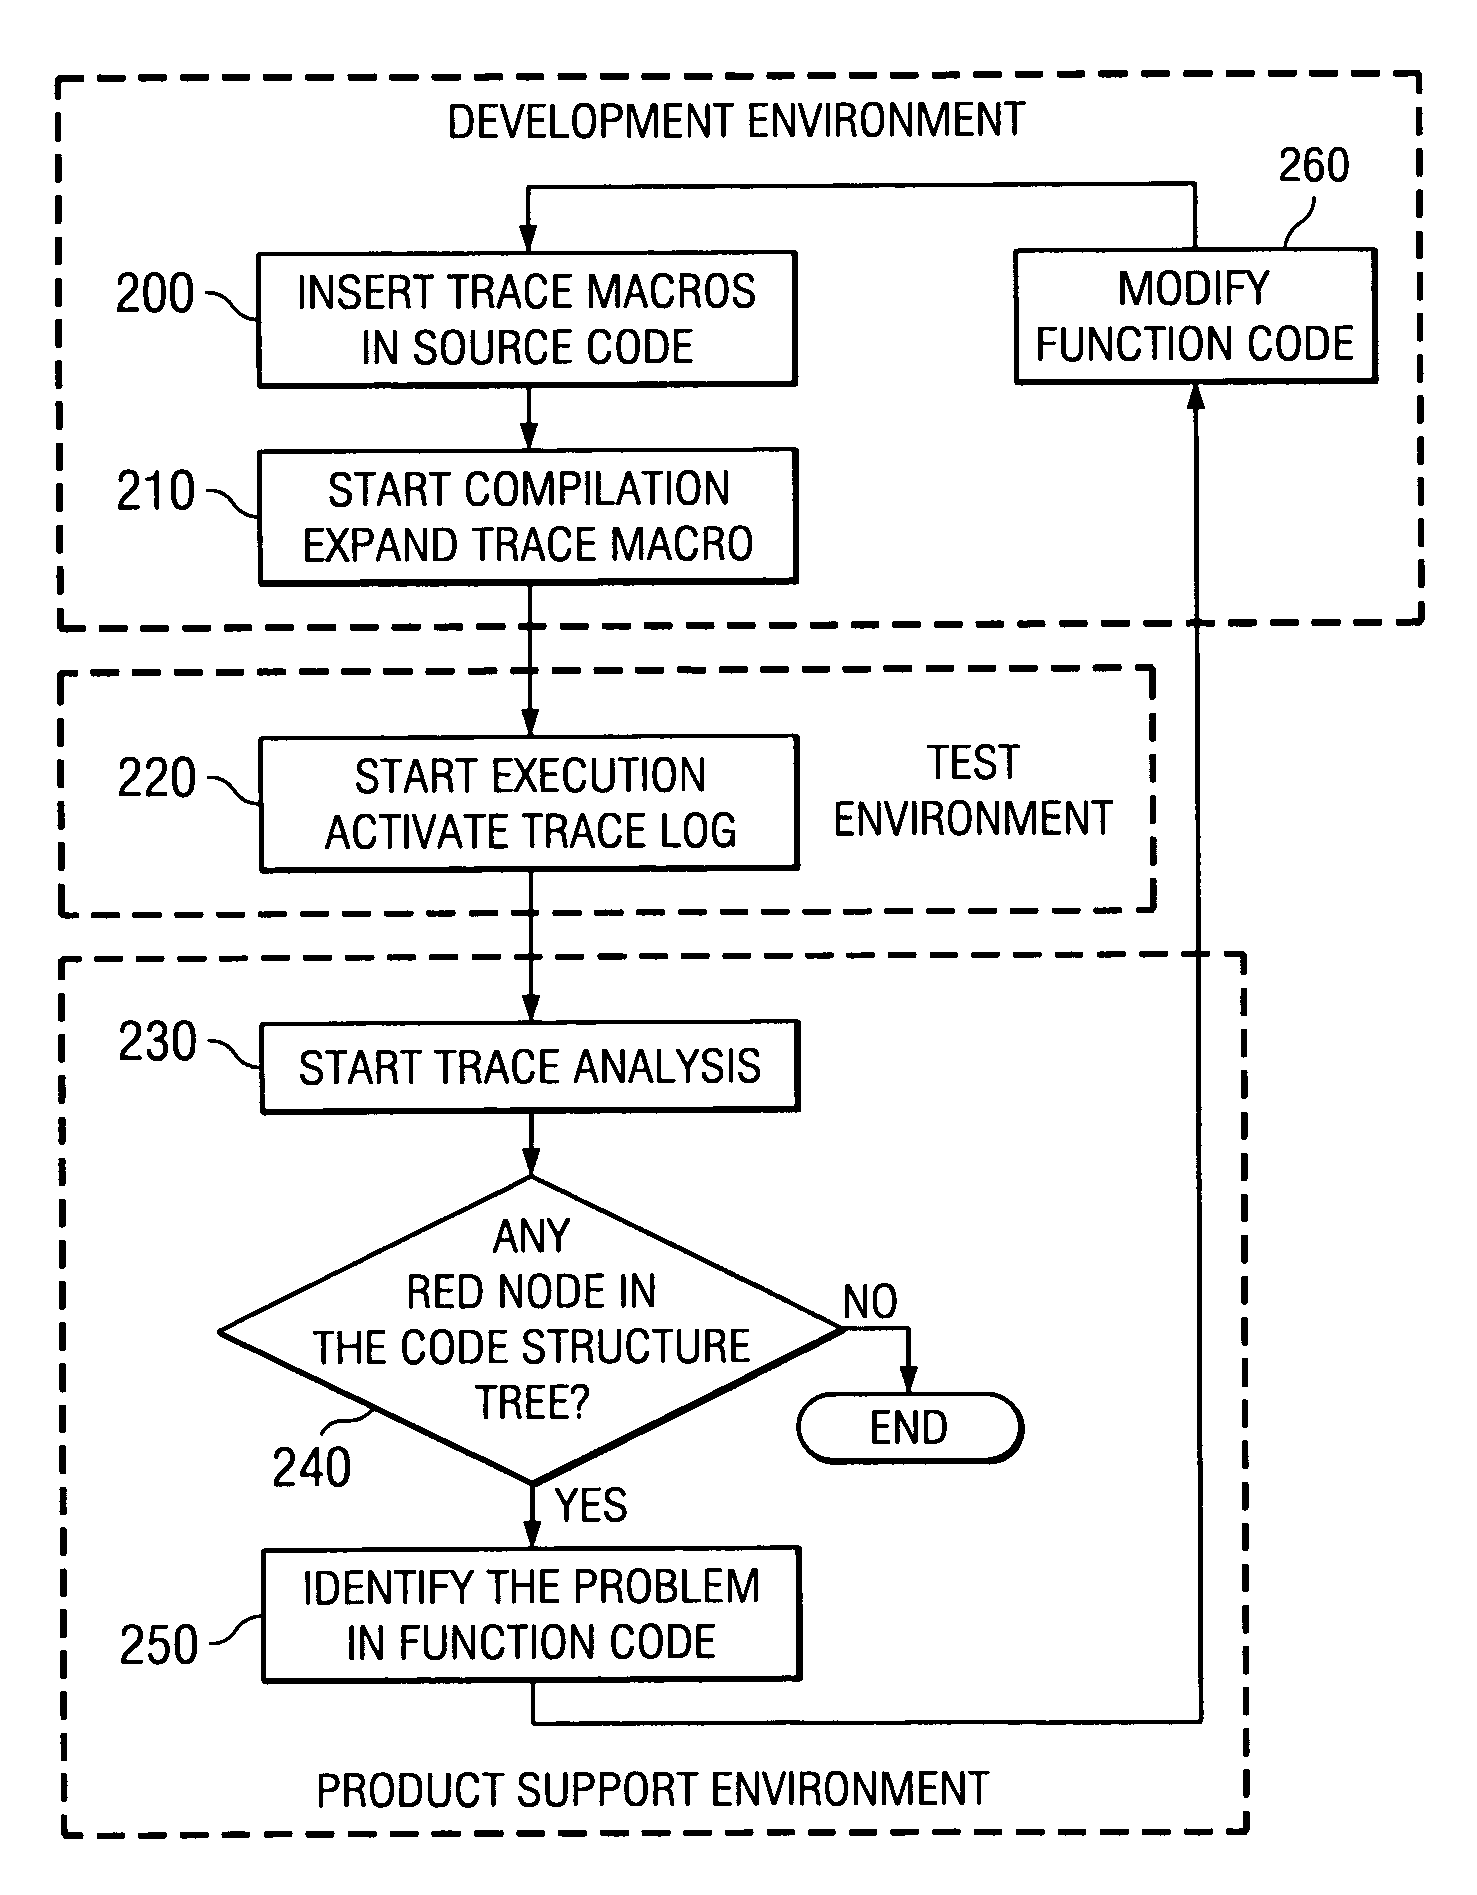
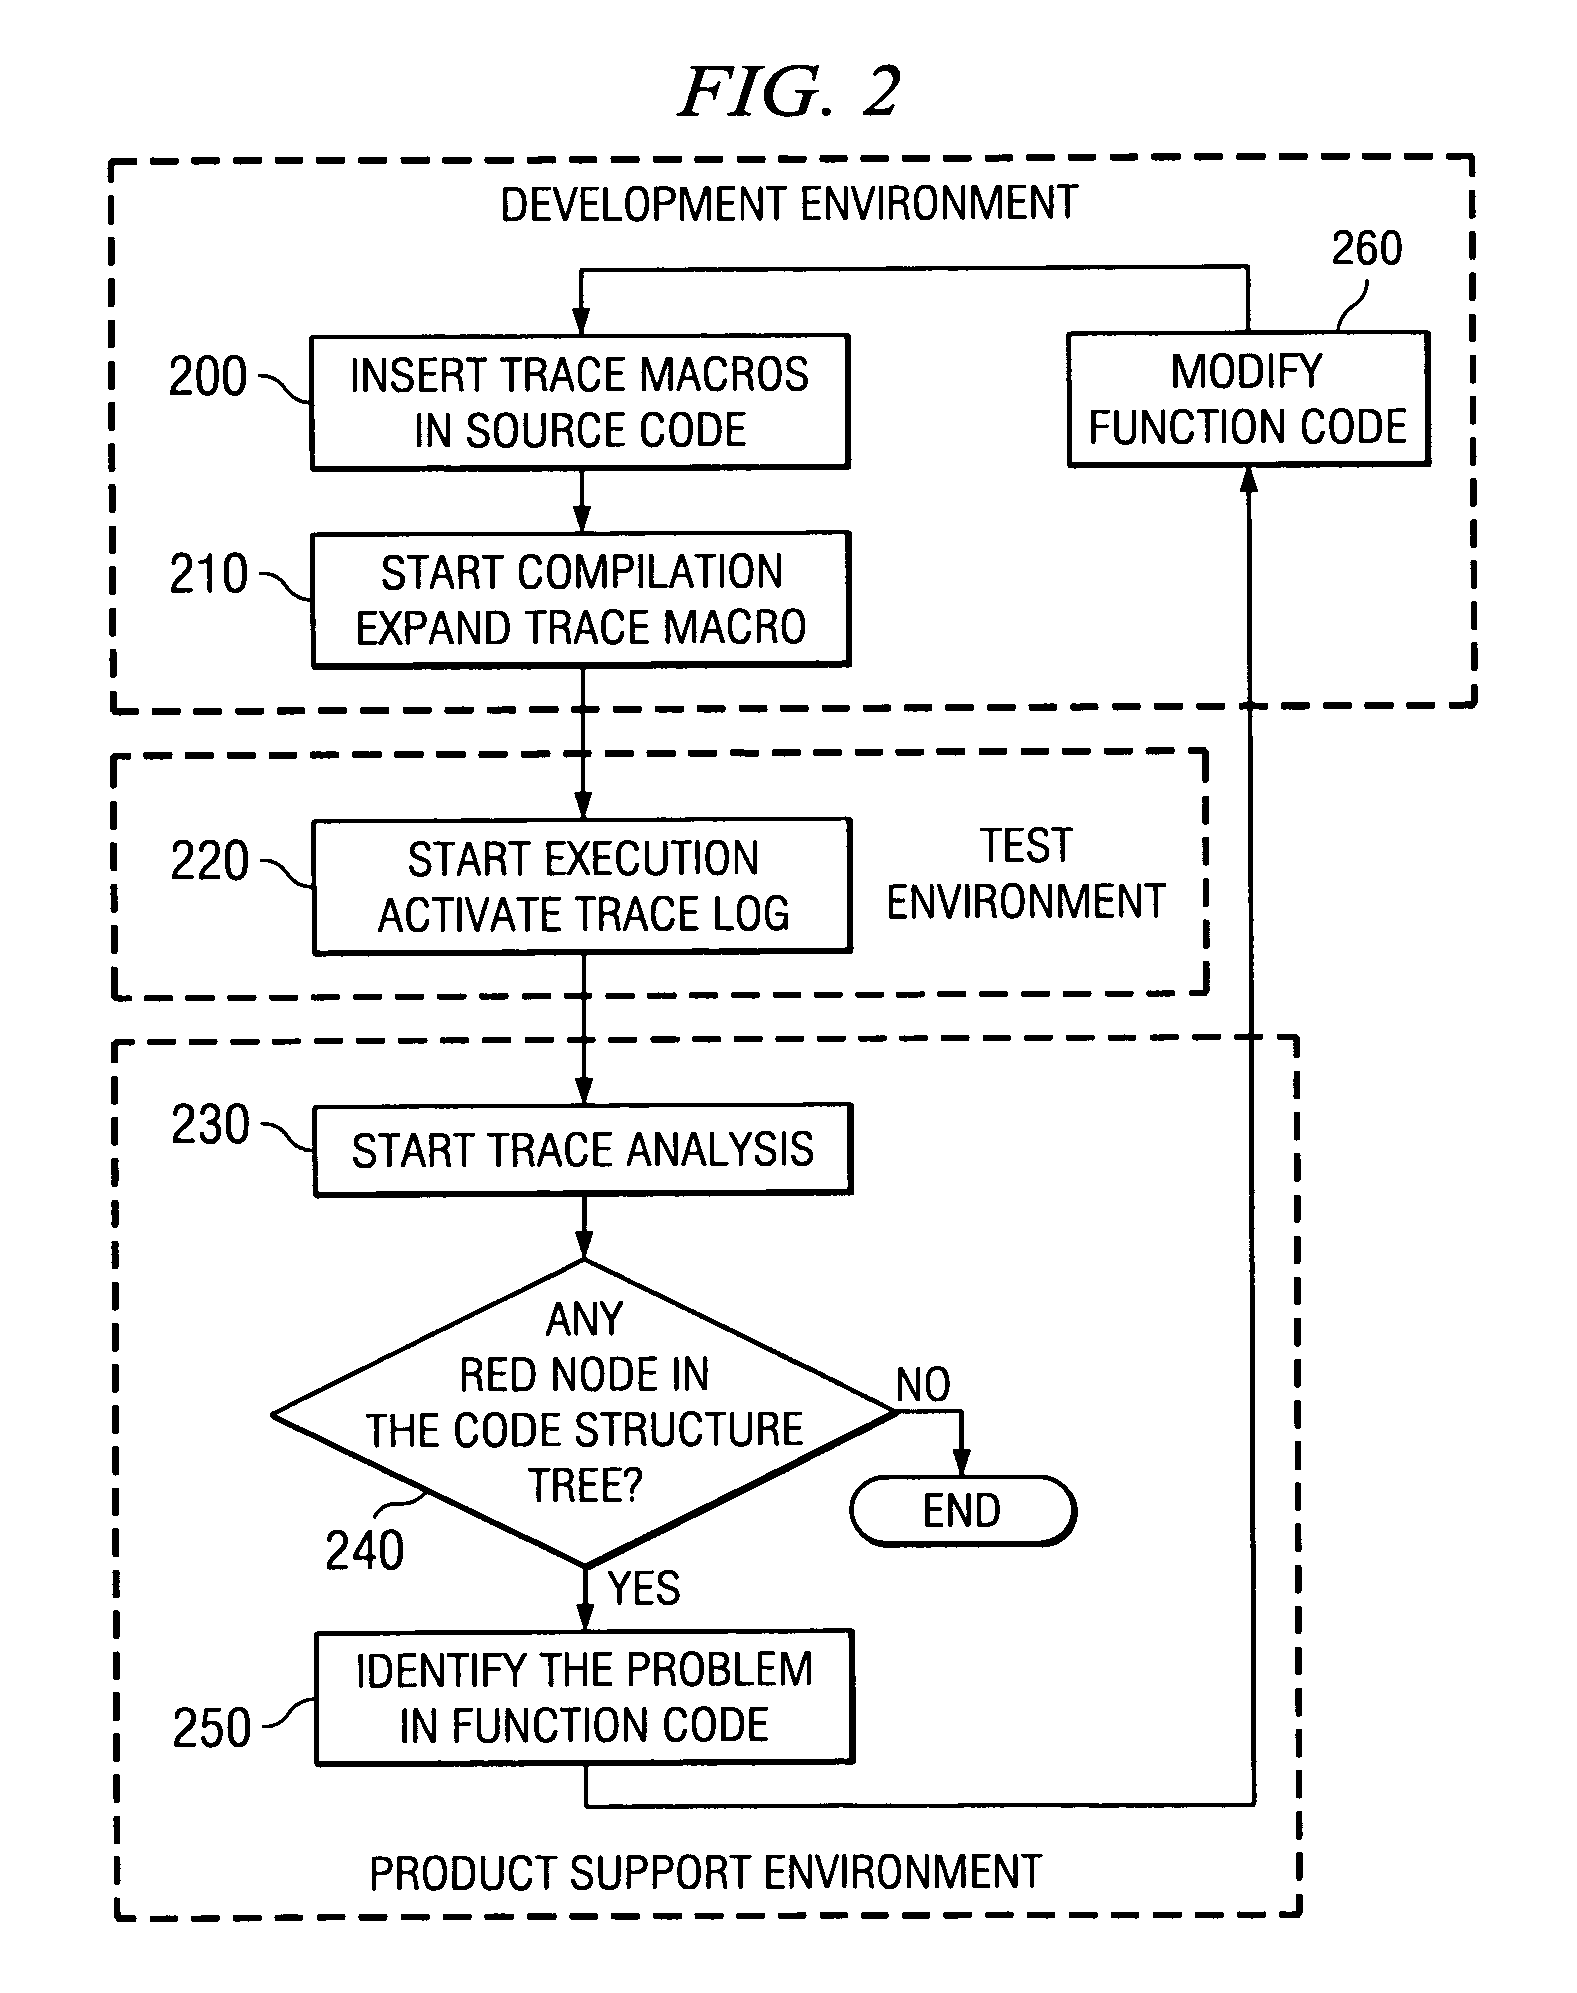
A method and system for tracing the failing or successful execution of nested functions coded with return codes in a thread during its execution. The method comprises an ENTRY and EXIT trace macro to mark the beginning and the end of execution of the function, a TRACE macro to record messages and program variable values, and a QUIT macro marking the failing execution of the corresponding function. Using a Graphical User Interface, an interactive trace analyzer reads the trace file and displays the tree structure of the nested functions and marks, by using different colors, the success or failure of each of them. The trace analyzer utilities help the user to quickly identify the error in the source code corresponding to a function with a failing execution.

Description

FIELD OF THE INVENTION[0001]The present invention generally relates to the field of program debugging; more particularly, the invention relates to a tool for generating and analyzing a trace of the execution of nested functions.BACKGROUND OF THE INVENTION[0002]When programs are coded with programming languages using symbolic names, such as Javaprogramming language, a ‘debugger’ program can be used. (Java is a trademark of Sun Microsystems, Inc. in the United States, other countries, or both). A debugger is a program controlling the execution of a program to be debugged, allowing a developer or programmer to step through the program, catch data, and monitor conditions, such as values of variables, to correct a problem. When the programming language does not use symbolic names, one other way to debug a program is to include, at strategic points in the code, macro instructions which will generate a trace in a trace file at execution time. The trace file is analyzed after execution wi...

Claims


Application Information

Patent Timeline
IPC IPC(8): G06F9/44G06F11/00G06F11/36
CPCG06F11/3636
Inventor FERRI, LUCAPICHETTI, LUIGIGANGEMI, ROSARIO
Owner IBM CORP
Learn More