Methods of classifying drug responsiveness using multiparameter analysis

a multi-parameter analysis and drug responsiveness technology, applied in the field of predictive medicine, can solve the problems of a large number of genes in the analysis of such a large number of genes, and a new layer of complexity arises

Inactive Publication Date: 2008-03-11
INSTITUTE FOR SYSTEMS BIOLOGY
View PDF18 Cites 8 Cited by
  • Summary
  • Abstract
  • Description
  • Claims
  • Application Information

AI Technical Summary

Problems solved by technology

Perhaps 50,000 genes are expressed in human, and the analysis of such a large number of genes is complex.
Moreover, in addition to the large number of genes, another layer of complexity arises from alternative splicing of mRNA and various modifications of proteins encoded by the genes.

Method used


Image

  • Methods of classifying drug responsiveness using multiparameter analysis
  • Methods of classifying drug responsiveness using multiparameter analysis
  • Methods of classifying drug responsiveness using multiparameter analysis

Examples


example i

Calculation Methodology Using Multivariate Classification Theory

[0254]This example describes a calculation methodology using multivariate classification theory to classify health-associated regions of multidimensional space.

[0255]Data are available on expression levels corresponding to a set of molecules for individuals with known health states, for example, healthy, ovarian cancer, prostate cancer, diabetes, and the like. The number m corresponds to the number of different health states. The calculation steps involved are: (1) estimate the probability distribution of the observed data vector for each health state; (2) estimate the costs of misclassification for each combination of health states; (3) estimate the a priori probabilities of a random individual being a member of each health state; and (4) determine the optimal calculation to be performed when classifying a new individual. The development given here is based upon multivariate statistical methods such as those of T. W. A...

example ii

Logistic Regression Analysis

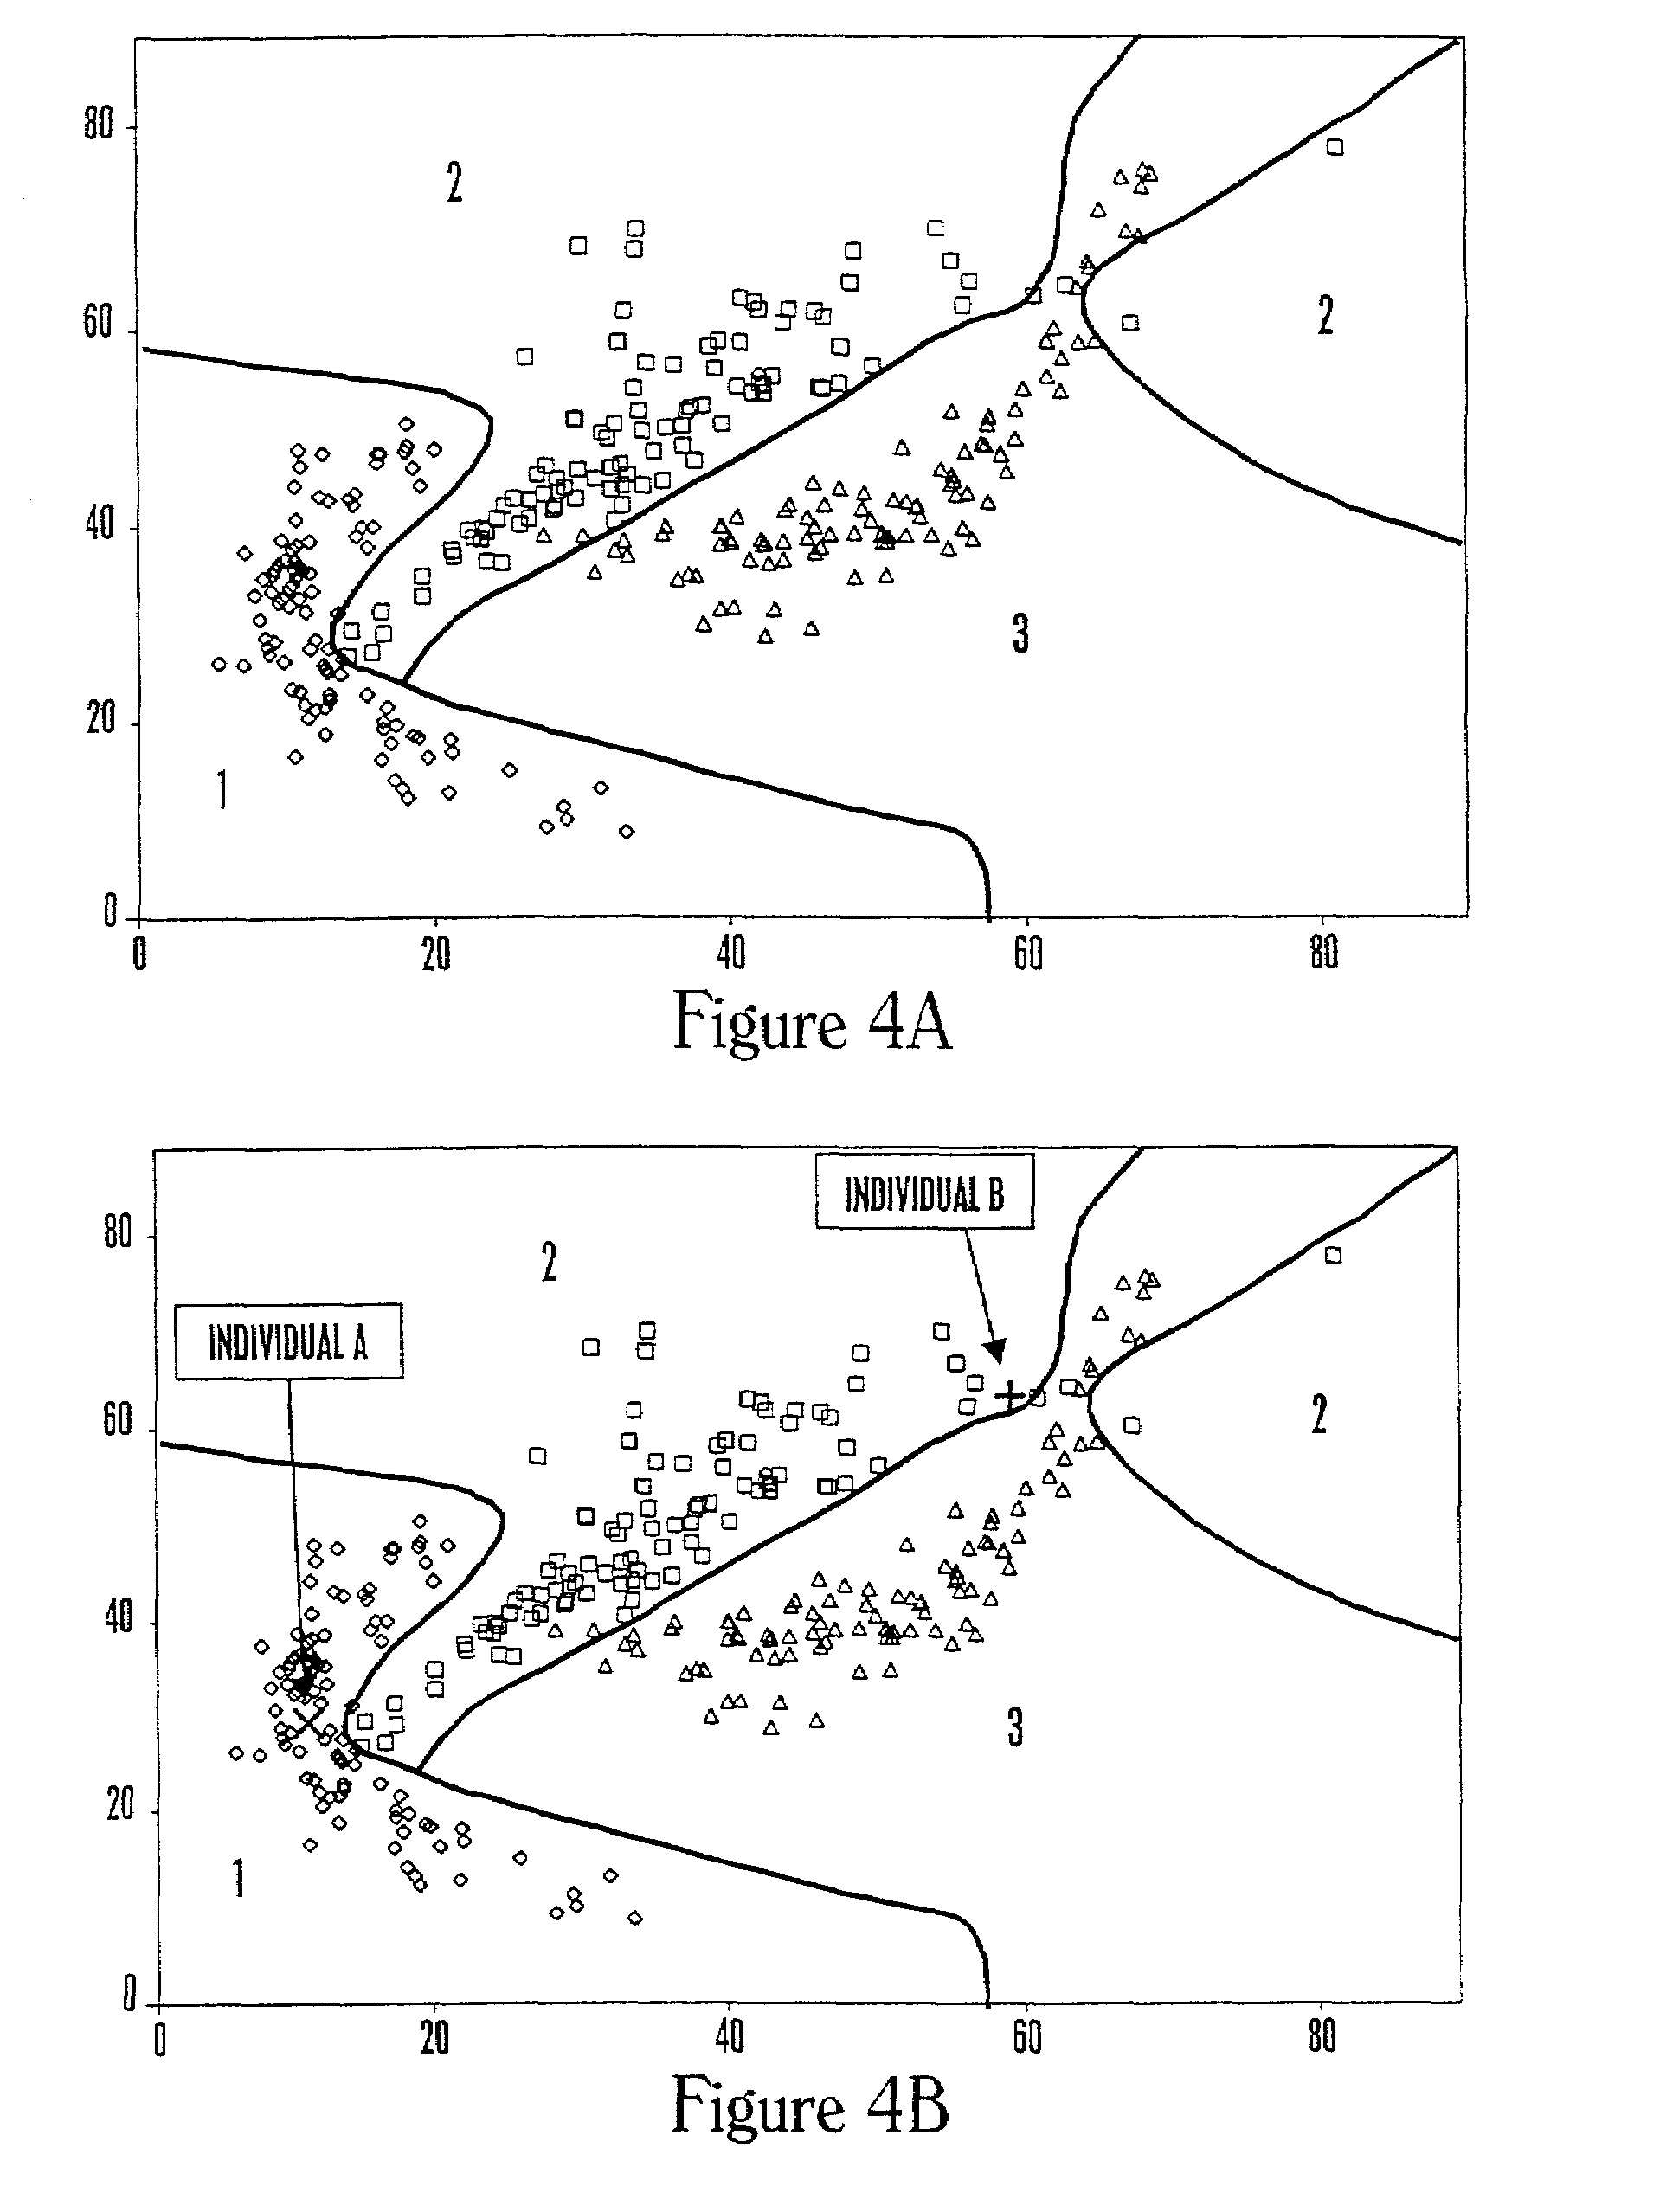
[0263]This example describes the analysis of a data set for three health states and two molecular expression levels using logistic regression analysis.

[0264]The data set was created starting with pseudorandom computer-generated numbers and then applying a different mathematical transformation for each health related reference group. For the data set shown in FIG. 4A for three health states and two molecular expression levels, the resulting classification regions are shown using logistic regression analysis under the assumptions that the costs of misclassification are all equal, and the prior probabilities are 0.2, 0.5, and 0.3 for the three groups. Because health state 2 is the most common in the population, the classification tends to favor this group at the upper right where data are sparse.

[0265]The classification regions are based on three separate logistic regression analyses, one to predict each health state, where each analysis used the molecular e...

example iii

Machine Learning by Boosting of Individual Molecules

[0271]This example describes classification analysis using a machine learning algorithm called “boosting” to combine a chosen group of simple one-molecule-at-a-time decision rules to obtain an effective health classification.

[0272]The data set was created starting with pseudorandom computer-generated numbers and then applying a different mathematical transformation for each health related reference group. For the data set shown in FIG. 5 for three health states and two molecular expression levels, the resulting classification regions are shown for a machine-learning technique that uses boosting to combine several one-molecule-at-a-time analyses to form a classification region under the assumption that the prior probabilities are 0.6, 0.3, and 0.1 for the three groups. In this case, 8 boosting steps have been taken. The method used here is based on the AdaBoost.M1 algorithm described by Freund and Schapire (J. Computer and System Sc...


PUM

PropertyMeasurementUnit
timeaaaaaaaaaa
timeaaaaaaaaaa
genetic defectsaaaaaaaaaa

Abstract

The invention provides a method of determining a comparative expression profile in an individual by comparing the expression levels of a sample of molecules in a population of molecules in a specimen from the individual with a health-associated reference expression region of the sample of molecules, wherein expression levels within the health-associated reference expression region indicate a reference expression profile and wherein expression levels outside the health-associated reference expression region indicate a perturbed expression profile. The invention also provides methods of diagnosing a disease or a health state in an individual by comparing the expression level of a sample of molecules in a specimen from the individual with a health-associated reference expression region of the sample of molecules. The invention additionally provides a method of classifying a population by drug responsiveness.

Description

BACKGROUND OF THE INVENTION[0001]The present invention relates generally to methods of predictive medicine and more specifically to methods of determining expression profiles of an individual in response to a drug.[0002]Every living organism utilizes genetic information in the form of discrete nucleotide sequences, called genes, to convey information for the proper development and function of the organism. Even simple organisms, such as bacteria, contain thousands of genes, and the number is many fold greater in complex organisms such as humans. Understanding the complexities of the development and functioning of living organisms requires knowledge of these genes.[0003]For many years, scientists have searched for and identified a number of genes important in the development and function of living organisms. What was once a difficult and time consuming process has greatly accelerated in recent years due to advances in technology and directed projects aimed at identifying essentially ...

Claims


Application Information

Patent Timeline
Patent Type & Authority Patents(United States)
IPC IPC(8): G01N33/48C12Q1/68G06G7/48G16B40/20G01N35/00G16B25/10
CPCG06F19/24G06F19/20G16B25/00G16B40/00G16B40/20G16B25/10
Inventor HOOD, LEROY E.SIEGEL, ANDREW F.
Owner INSTITUTE FOR SYSTEMS BIOLOGY
Why Eureka
Try Eureka