Identification of relevant metrics

a technology of relevant metrics and identification, applied in the field of service level agreements, can solve the problems of reducing the number of resources, difficult slm, designers generally lack the ability to choose a set of metrics that is minimal, etc., and achieve the effect of maximizing the distribution of points

Inactive Publication Date: 2010-08-24
INT BUSINESS MASCH CORP
View PDF9 Cites 8 Cited by
  • Summary
  • Abstract
  • Description
  • Claims
  • Application Information

AI Technical Summary

Benefits of technology

[0010]The present invention provides The present invention provides a system and method for identifying relevant metrics in a service level agreement. In one embodiment, the present invention selects a first set of points and a second set of points, where each set represents a given number of measurements for a different individual service metric. A first threshold value is set for the first set of points and a second threshold value is set for the second set of points. The first threshold value and the second threshold value are each selected so as to produce four quadrants and to maximize distribution of points of intersection of the first set of points and the second set of points between the second quadrant and the fourth quadrant.
[0015]In still another embodiment of the present invention, the threshold is chosen so as to minimize an investment needed to avoid exceeding the threshold.

Problems solved by technology

SLM is difficult, especially across a wide range of complex technologies (i.e., Frame Relay and ATM) in a multi-site enterprise.
1. Service Metric Selection: Monitoring service level metrics requires both human and machine resources. Monitoring designers generally lack the ability to choose a set of metrics that is minimal and sufficiently effective. One way metric selection can be done is by removing redundant metrics that contain information that can be inferred. As with any data-driven methodology, inference or induction can only be made on entities that have previously been observed. Therefore, the selection of metrics to be monitored is actually a reduction of metrics that have already been monitored.
2. Service Breach Point Selection: An important part of an SLA is the thresholds that separate unacceptable service quality from acceptable service quality. Setting breach values is usually regarded as a subjective or even political matter. Nevertheless, historical data can provide invaluable insight in understanding the existing system capacity and help users to make educated decisions.
3. Resource Metric Selection: A “resource” is any element of a computing system or operating system required by a job or task, including memory, input / output devices, processing units, data files, and control or processing programs. The number of resource metrics is usually at least a magnitude higher than the number of service metrics. Therefore, reducing the number of resource metrics to monitor can significantly lower the cost. As the information infrastructures become extremely complex, it is advantageous to discover the critical resources that support a particular service in terms of their performance dependency. Knowing the relationship enables the system administrators to better interpret the implication of changes in resource utilization. Additionally, the number of metrics to be monitored and managed can be further reduced.
4. Monitoring Threshold Selection: In resource monitoring, alerts are usually generated when the metric values exceed or fall below certain thresholds. For example, an alert is generated when free disk space is less than 15% of the total disk space. However, there is no clear rule defining what the correct threshold values should be. However, the consequence of having non-optimal threshold values is either generating too many alerts or missing emerging service degradation. Unlike setting service breach points, resource monitoring threshold can only be objectively discovered.
5. Bottleneck Resource Identification: Among all the IT resources that support a service, usually there are a few of them that can be called “bottleneck” resources because their metrics show stronger relevance to the service level. For example, a critical server may be equipped with an inadequate amount of memory. In this situation, a memory upgrade may significantly improve the service level. It is useful then, to identify the most likely bottleneck resources for both resource planning and monitoring purpose.
However, several intrinsic challenges have not been addressed adequately in the prior art.
The classic algorithms can not handle such asynchronous time series directly.
However, there is very little assistance or guidance that practitioners can get for business system monitoring designing.
Therefore, traditional resource monitoring and event correlation have proven to be insufficient for understanding the overall service level.

Method used


Image

  • Identification of relevant metrics
  • Identification of relevant metrics
  • Identification of relevant metrics

Examples


Embodiment Construction

[0029]While the specification concludes with claims defining the features of the invention that are regarded as novel, it is believed that the invention will be better understood from a consideration of the following description in conjunction with the drawing figures, in which like reference numerals are carried forward.

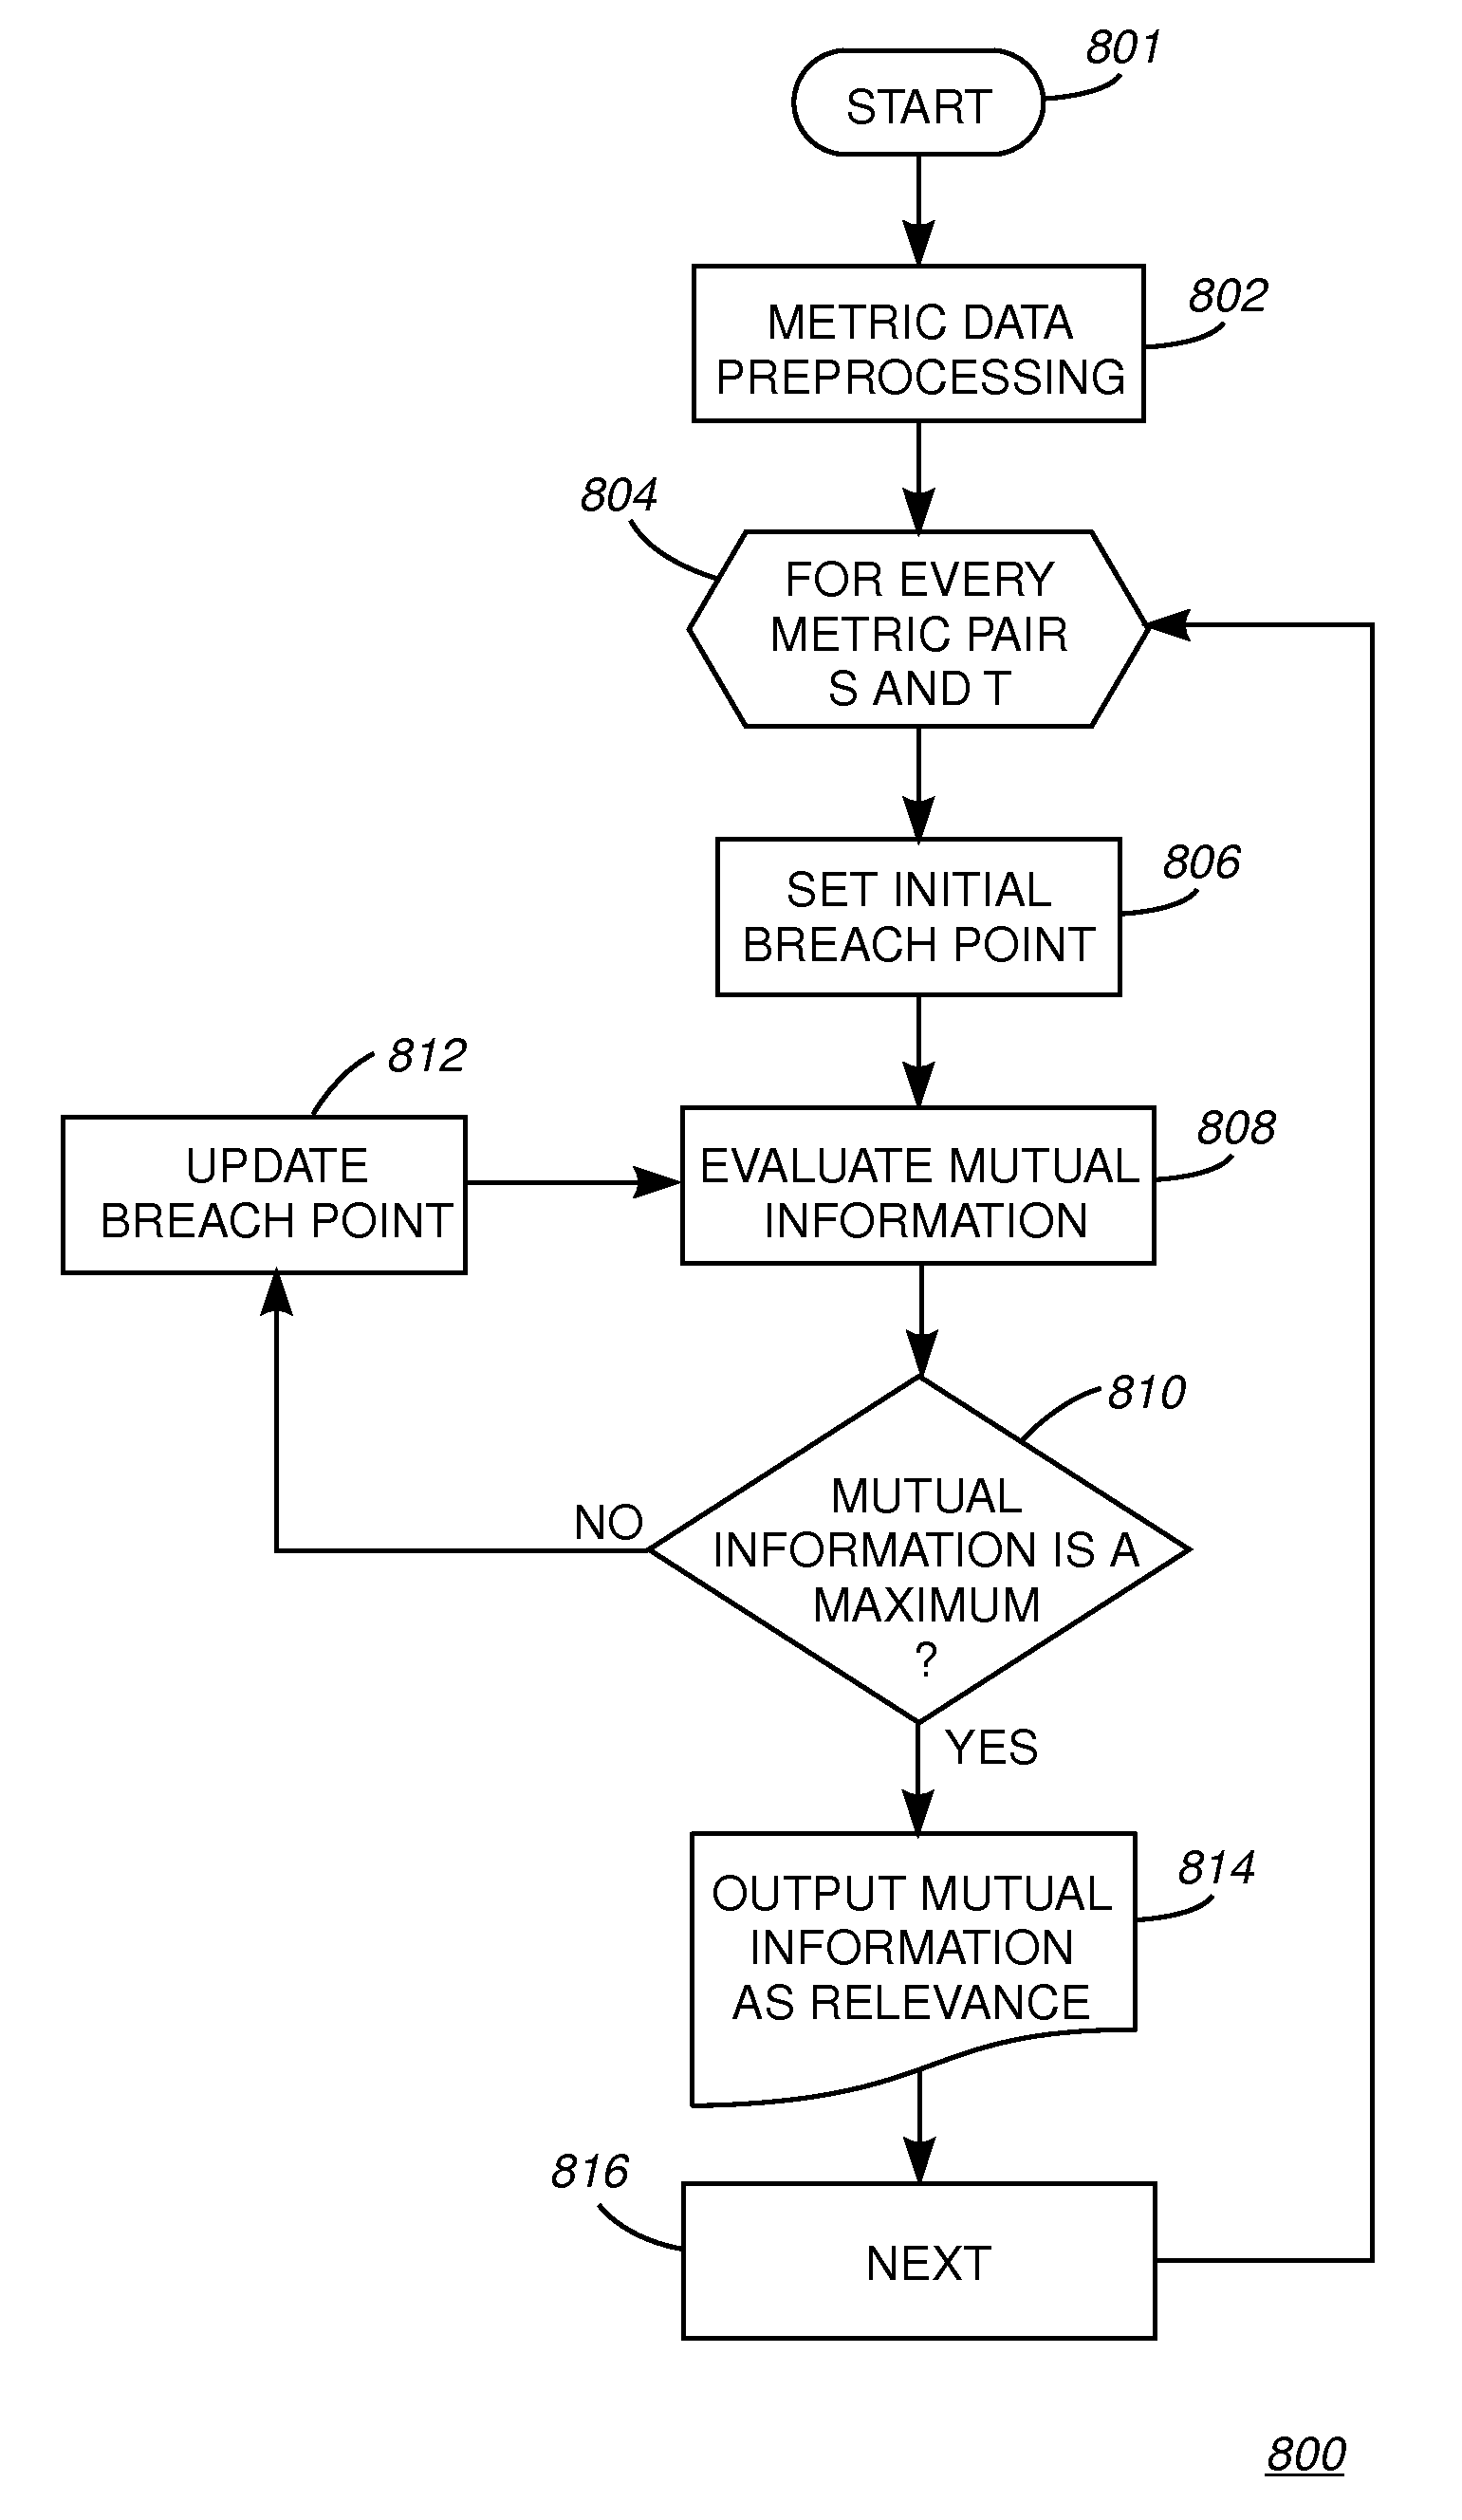
[0030]Described now is an exemplary method and hardware platform for performing the method according to an exemplary embodiment of the present invention. Embodiments of the present invention provide a Data Driven Business System Management (DDBSM) methodology that is, in one embodiment, a data analysis process that starts with acquiring metric data from a data repository and ends with a file containing a complete monitoring design for both service level and resource utilization. The metric analysis tool, according to the present invention, allows a user to automatically step through the process while retaining control in decision making.

[0031]Traditional monitoring ...


PUM


Abstract

A method and system for identifying relevant metrics among metrics that are measured to determine conformance with a service level agreement. The method includes selecting two sets of points, each set representing a given number of measurements for an individual metric and setting a separate threshold for each of the sets of points. The threshold values are selected to produce a set of quadrants so as to maximize distribution of points of intersection of each of the sets of points between a second quadrant and a fourth quadrant in a four-quadrant graph. The method can be performed on a computer system.

Description

FIELD OF THE INVENTION[0001]The present invention relates generally to service level agreements, and, in particular, to identifying and removing redundant metrics.BACKGROUND OF THE INVENTION[0002]A Service Level Agreement (SLA) is an agreement between a user and a service provider, defining the nature of the service provided and establishing a set of metrics (measurements) to be used to measure the level of service provided, measured against the agreed level of service. Such service levels might include provisioning (when the service is meant to be up and running), average availability, restoration times for outages, availability, average and maximum periods of outage, average and maximum response times, latency, delivery rates (e.g. average and minimum throughput), and others. The SLA also typically establishes trouble-reporting procedures, escalation procedures, and penalties for not meeting the level of service demanded—typically refunds to the user.[0003]Various root-cause analy...

Claims


Application Information

Patent Timeline
Patent Type & Authority Patents(United States)
IPC IPC(8): G06F17/15
CPCH04L41/5003H04L41/5009H04L43/045H04L43/08H04L43/16
Inventor PERNG, CHANG-SHINGLIN, STEVEMA, SHENGTHOENEN, DAVID
Owner INT BUSINESS MASCH CORP
Why Eureka
Try Eureka