
Method for the wavelength calibration of a spectrometer

a spectrometer and wavelength calibration technology, applied in the direction of instruments, spectrometry/spectrophotometry/monochromators, optical radiation measurement, etc., can solve the problems of inability to produce calibrators for similar instruments produced by one manufacturer, and inability to achieve the spectral response of the instrument. , to achieve the effect of high calibration accuracy, cost-effectiveness and complicated calculation steps

Inactive Publication Date: 2010-11-23
ROCHE DIAGNOSTICS OPERATIONS INC
View PDF14 Cites 7 Cited by
  • Summary
  • Abstract
  • Description
  • Claims
  • Application Information

AI Technical Summary

Benefits of technology

The present invention provides methods for wavelength calibration of spectrometers that offer improved accuracy and efficiency, even when using low-cost spectrometers with broader bandwidth. The methods involve determining the intensity spectrum of a light source on the spectrometer as a calibration spectrum, cutting out a measured-value block from the model spectrum that corresponds to one of the measured-value blocks on the spectrometer, shifting the measured-value block of the model spectrum in a stepwise manner relative to the measured-value block of the model spectrum, and determining a shift value as a sum of the position marker of the measured-value block and the distance between the position marker of the model spectrum and the corresponding position marker of the calibration spectrum. These methods can be carried out without additional effort and can be used with existing spectrometers.

Problems solved by technology

Many analytical applications for spectrometers require instrument-specific calibration data, the generation of which is often time-consuming and costly.
Furthermore, a calibrator set for an instrument produced by one manufacturer is in general unsuitable for a similar instrument which is produced by another manufacturer: Furthermore, repairs on a single instrument can have the effect that the spectral response of the instrument varies.
In the case of medical-diagnostic applications which often require an exact analysis of analytes also at very low concentrations, even a small instrument variation can result in an unacceptable error in the analysis.
There is no effective method for rapidly and cost-effectively calibrating individual instruments for such large numbers of instruments.
As mentioned above, even slight individual differences between the primary spectrometer and secondary spectrometer can mean that the calibration data of the primary spectrometer cannot be used without changes on the secondary spectrometer because otherwise this may result in unacceptable inaccuracies in the analyte determination due to the non-instrument-specific calibration data especially in the case of applications for medical diagnostics.
Additional calibration solutions are required for this, the lot-specific composition of which introduces further variables into the calibration which in turn can impair the accuracy of the calibration.
In the case of the iterative method used here, it is additionally very difficult to determine a wavelength assignment with a polynomial of more than the 1st degree which limits the accuracy of the calibration.
Furthermore, this method requires the additional step of calculating a correction spectrum which increases the demands on the computing power of a data processing system instructed to carry out the calculation.
Errors in the wavelength assignment can occur in such spectrometer types especially as a result of the mechanical grating drives and controls.
It is therefore difficult for a user to carry out a wavelength calibration at a later time because such natural samples cannot be stored for longer periods without changing their optical properties.
The use of such natural reference materials is also critical because it is not possible to ensure a standardization of their spectral properties.
Also in this case the described methods make high demands on the accuracy and resolution of the spectrometer which must resolve atomic lines.
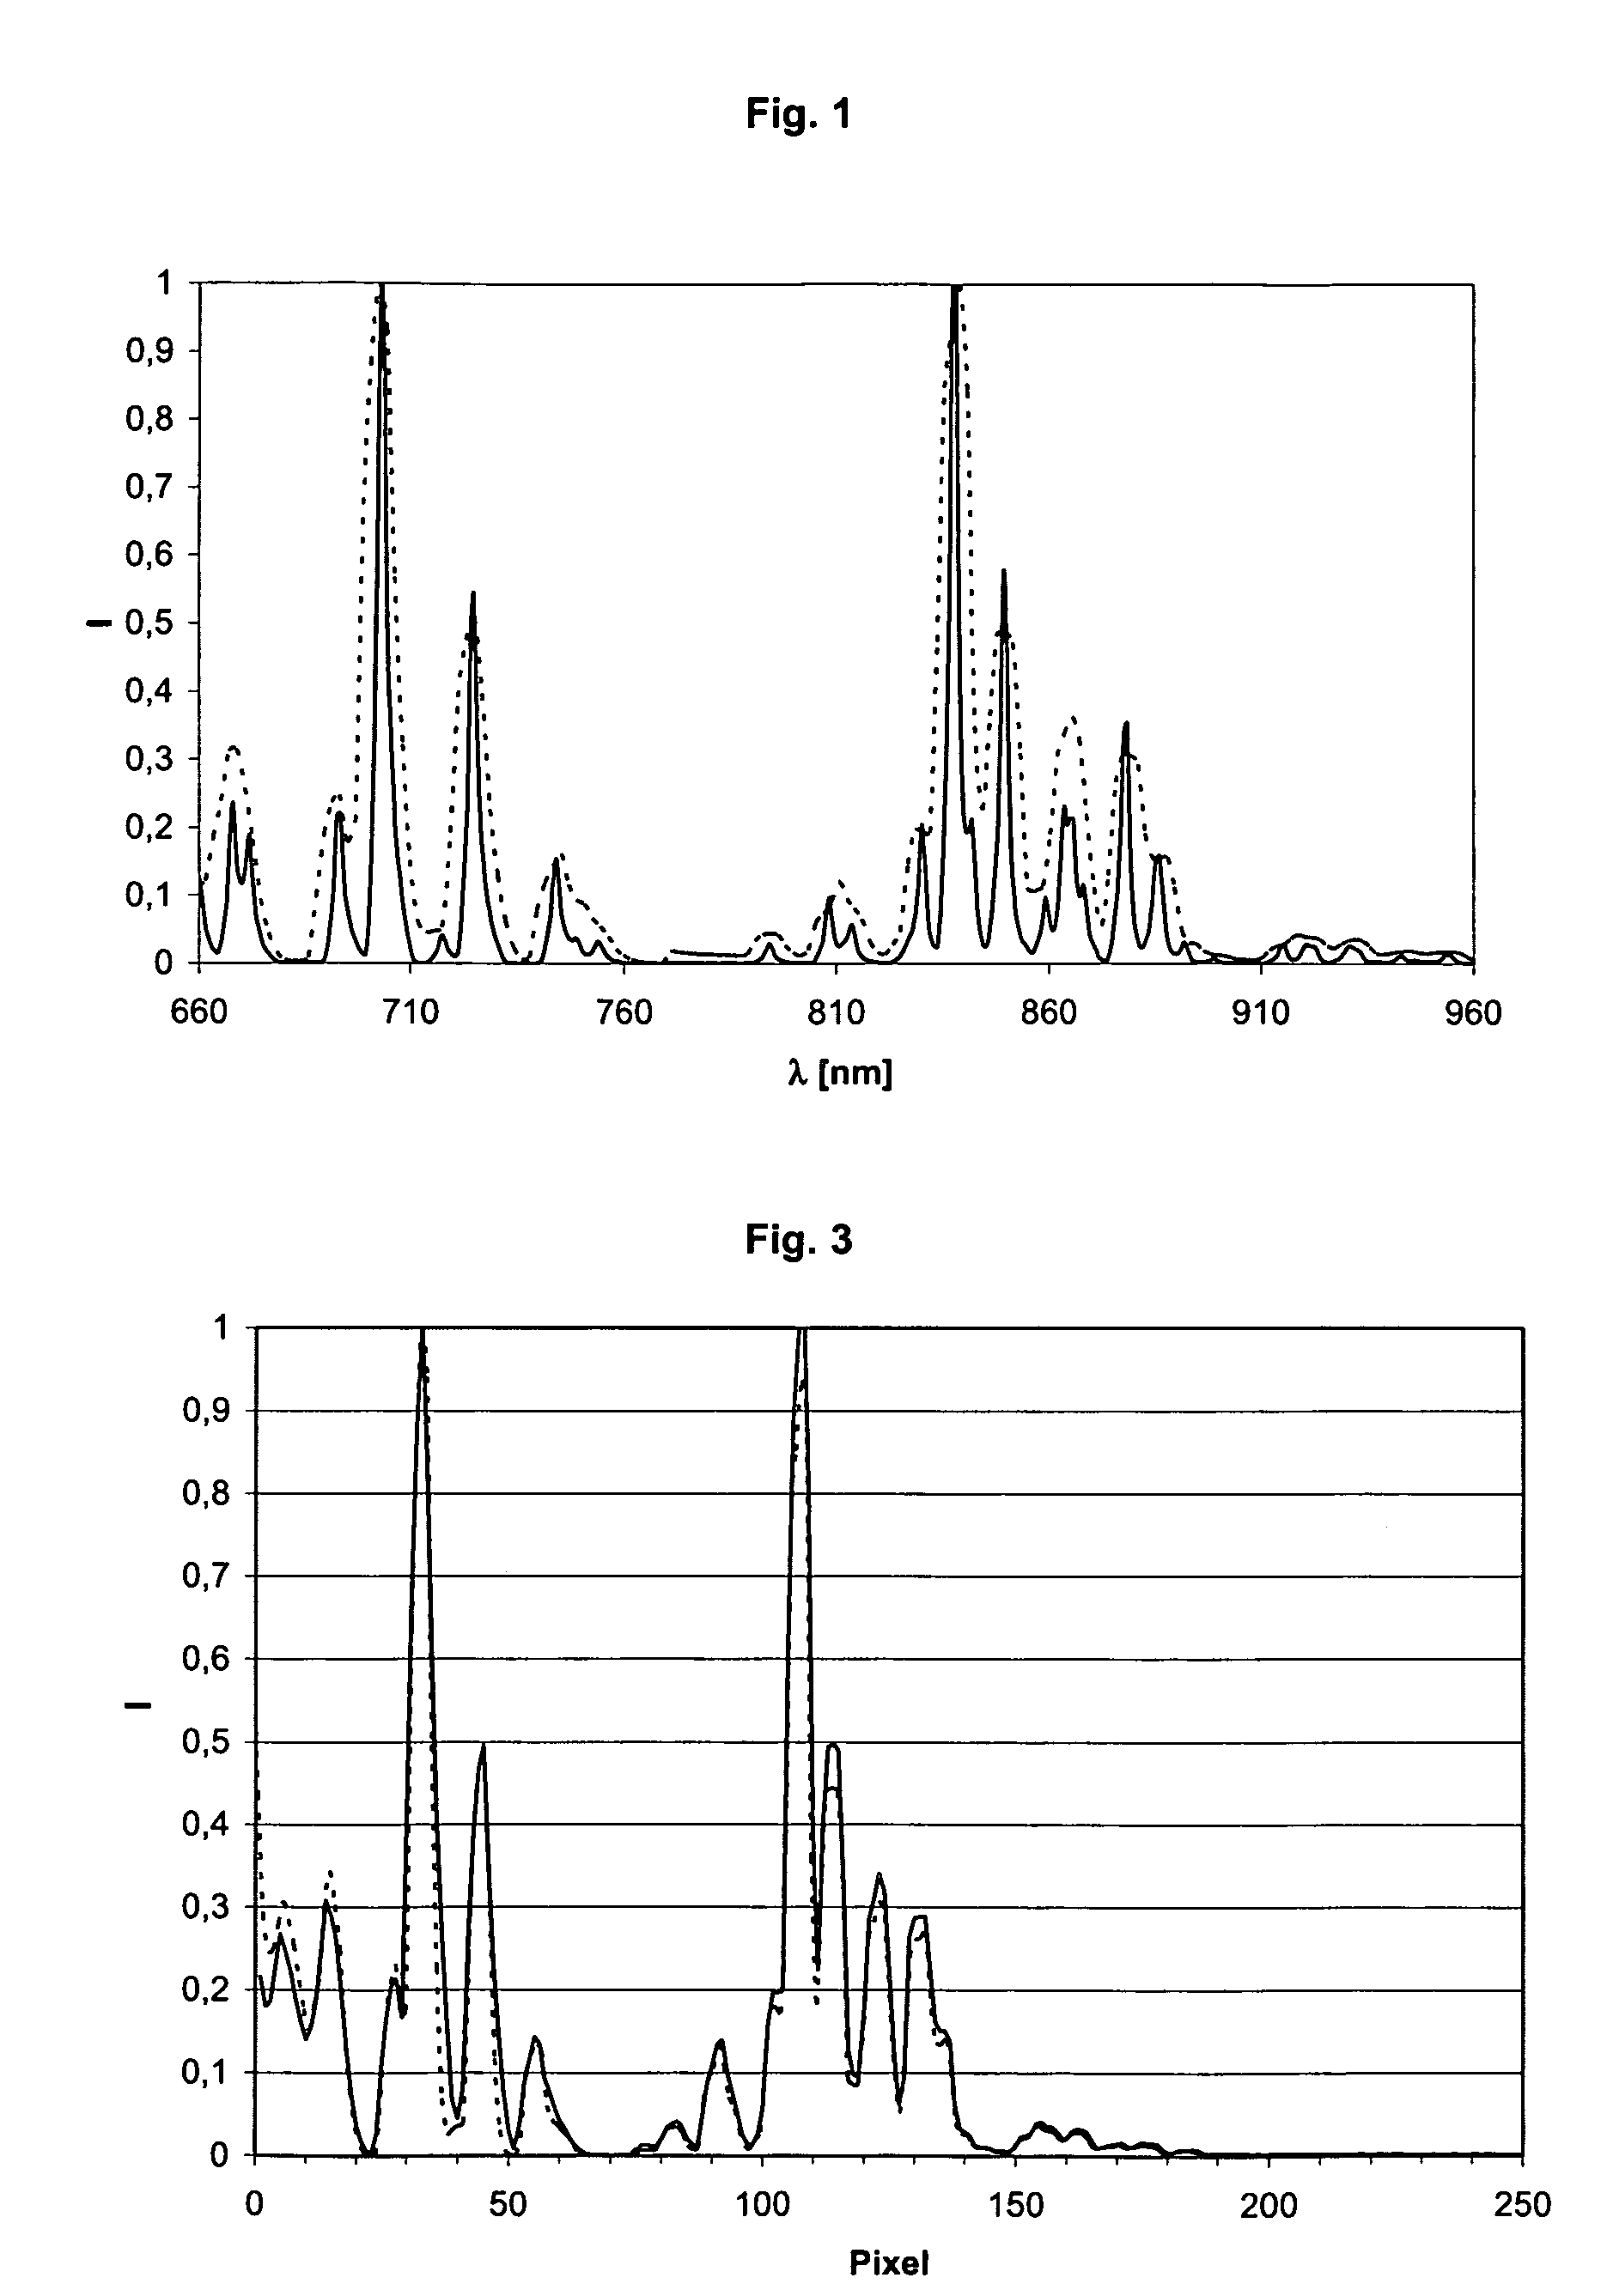
The wavelength calibration methods described above have the major disadvantage that for system-related reasons they can hitherto only be used for high resolution spectrometers (i.e., spectrometers with the narrowest possible bandwidth) because peaks resolved to a sufficient extent can only be obtained in such a spectrum). FIG. 1 shows in this connection two spectra of the same neon lamp in the wavelength range of 660 nm to 960 nm.
The peaks required for this can no longer be adequately resolved by spectrometers with a lower resolution (see, for example, non-resolved multiple peaks at 660-680 nm or 730-760 nm or shoulders instead of resolved single peaks in the range of 680-700 nm and 870-890 nm) which would greatly reduce the accuracy of a wavelength calibration based on this by means of a peak search method.
As a result only high resolution spectrometers have been used for such medical diagnostic analytical systems which, due to their high demands on the quality of manufacture and resolution, are complex and costly.
Because, as already mentioned, such analytical systems are often manufactured in large numbers, this restriction to such spectrometers represents a considerable production cost factor.
However, such spectrometers often have poorer optical properties such as a larger bandwidth and asymmetric peak representation.
When these spectrometers are calibrated by the user with the aid of a conventional peak search method, calibration accuracies of only up to 1 nm are possible which is not sufficient for applications in medical diagnostics.
Although calibration accuracies of less than 1 nm can be achieved in the factory, this requires the use of very expensive spectral lamps and is very laborious so that it cannot be employed as a standard by users.
Consequently, the previously used peak search methods do not yield satisfactory results for such low-cost spectrometers.
Furthermore, conventional wavelength calibration methods based on the peak search principle often require spectral lamps or similar light sources which have a large number of peaks that are as narrow as possible.
The use of alternative and possibly more cost-effective light sources for wavelength calibration has previously not been possible due to their emission spectra which usually have too few and / or too broad emission peaks.
Due to the optical bandwidth of the spectrometers, on the one hand, and the limited number of peaks of spectral lamps on the other hand, only a few suitable peaks are available which limits the quality of the wavelength calibration because all other ranges of the spectrum cannot be used to determine calibration values.

Method used


Image

  • Method for the wavelength calibration of a spectrometer
  • Method for the wavelength calibration of a spectrometer
  • Method for the wavelength calibration of a spectrometer

Examples


example 1

[0110]Example 1 describes a specific embodiment of a method according to the invention analogous to the third typical embodiment.

[0111]A wavelength calibration is carried out according to the inventive method on a grating spectrometer designated CP20 from the Jobin Yvon Company (Longjumeau Cedex, France). This spectrometer has a linear line sensor with 256 pixels, can resolve a wavelength range of 638 to 1038 nm, and has a spectral bandwidth of about 8 nm.

[0112]A first CP20 spectrometer is defined as the primary spectrometer, and another CP20 spectrometer of the same type is defined as the secondary spectrometer. A first wavelength assignment which was carried out in the factory by the manufacturer using a conventional peak search method was available for both spectrometers and enclosed with the spectrometers. In the specific case the wavelength assignment is a polynomial of the 3rd degree (λ−a0+a1 x+a2 x2+a3 x3) and the four coefficients a0, a1, a2 and a3 for the wavelength assignm...

example 2

[0122]In order to demonstrate and quantify the advantages of the method according to the invention compared to the previously used peak search methods, the wavelength calibration of spectrometers is simulated on a spectrum of a neon lamp in a wavelength range of 655 to 1035 nm at various calculated broadenings of the band-width. A neon spectrum is measured with a grating spectrometer of the type CP140 from the Jobin Yvon Company (Longjumeau Cedex, France) with a spectral band-width of 2 nm as a basis for the simulation. Simulated spectra with a respective bandwidth of 6, 7.5, 9 and 12 nm are calculated from this data set by a sliding multiplication using a Gauss curve adapted to each case. Wavelength calibrations are carried out on these various spectra a) with the peak search method and b) with the method according to the invention and the respective maximum errors are calculated over the entire wavelength range. These errors are listed in table 1. The errors are calculated in this...


PUM


Abstract

Methods for wavelength calibration of spectrometers are provided which achieve better calibration accuracies than conventional peak search methods. The methods are based on the principle of a stepwise relative shift of corresponding measured-value blocks of a model and calibration spectrum where a correlation value is calculated for each shift step. A shift value is determined for each measured-value block at which the correlation value reaches an optimum. A value pair consisting of a position marker of the measured-value block and the associated shift value is determined for each measured-value block. These value pairs represent the design points for fitting to a suitable assignment function. Coefficients obtained in this manner can be used directly as coefficients of a wavelength assignment or be combined with the coefficients of an existing first wavelength assignment in that they for example replace or are offset against the coefficients of an existing first wavelength assignment.

Description

BACKGROUND OF THE INVENTION[0001]The invention concerns methods for the wavelength calibration of spectrometers. In particular, the invention concerns methods for the wavelength calibration of secondary spectrometers by users where the secondary spectrometers are substantially identical in construction to a primary spectrometer that is available in the factory and serves as a standard for the wavelength calibration. The methods according to the invention can be used for the wavelength calibration of spectrometers which have a detector array as a detection unit and data processing devices for storing and processing data.[0002]Spectrometers are in general devices for displaying a spectrum and enable optical spectra to be recorded and analyzed. Spectrometers are widely used among others in chemical and medical analytics in order to determine components of a liquid on the basis of their spectral properties. Spectrometers that are used for this purpose frequently operate according to the...

Claims


Application Information

Patent Timeline
Patent Type & Authority Patents(United States)
IPC IPC(8): G01J3/02G01J3/28
CPCG01J3/28
Inventor LUKAS, RENESCHAPPACHER, GUDRUN
Owner ROCHE DIAGNOSTICS OPERATIONS INC
Learn More