Method and apparatus for determining and analyzing a location of visual interest

a visual interest and location technology, applied in the field of vehicle piloting, can solve the problems of poor judgment of performance capabilities of humans, poor performance of drivers, and generally good driving skills, and achieve the effect of minimizing the effect of the occurren

Inactive Publication Date: 2013-07-16
VOLVO LASTVAGNAR AB
View PDF10 Cites 214 Cited by
  • Summary
  • Abstract
  • Description
  • Claims
  • Application Information

AI Technical Summary

Benefits of technology

[0025]The classified instances are transformed into one of two binary values (e.g., 1 and 0) representative of whether the respective classified instance is on or off location. The uses of a binary value makes processing and analysis more efficient.
[0030]Another aim is to adapt certain algorithms to a real-time environment. Another is to identify and provide driver supports that are based on visual behavior and that can assist the driver avoid potentially detrimental situations because of implemented systems that refocus the driver.
[0033]In another embodiment, the presently disclosed invention presents the general concept of road-center (RC) based measures, where visual demand is quantified in terms of glances away from the road center, for both off-line and on-line (real-time) applications. The main advantage of this simplification is that one can allow for lower data quality during glances away from the road (since gaze outside of the RC area, is ignored).
[0040]In another aspect, the disclosure describes tailoring prescribed functionalities performed by the vehicle based on the mapped driver ocular characteristics. This may be as simple as adapting a distraction warning to sound when it is detected that the driver has looked away from the road too long, to causing an increase of the buffer zone maintained behind a leading vehicle by an adaptive cruise control system.
[0057]Utilization of this process can be used to identify periods of high driver workload based on a frequency of threshold-exceeding occurrences of driver time-sharing activity. In order to rid the window of the effect of the detected occurrence, refreshment (flushing or restoring to normal) of the primary moving time-window upon the detection of cessation of an occurrence of driver time-sharing activity is caused. In this way the effect of the occurrence is minimized after detection and analysis, thereby readying the system for a next departure from normal.

Problems solved by technology

Humans in general, and particularly as drivers, are poor judges of their own performance capabilities.
Even persons who have basically good driving skills, will not perform uniformly at all times when behind the wheel of a vehicle.
As a result, drivers are lulled into states of mind where little attention is being devoted to the driving task.
Not surprisingly, driver inattention is a leading cause of vehicular collisions, and especially automotive collisions.
It is known that fatigue impairs driver performance, alertness and judgment.
Collisions caused by drowsiness are a serious road safety problem, and fatigue has been estimated to be involved in as many as twenty-three percent of all crashes.
Distractions such as handheld telephone use, sign reading, eating food, interaction with other passengers, observing objects and manipulating devices in-the vehicle have the potential for capturing a driver's attention in an excessive way and thus also compromising safety.
These things are often called secondary tasks and are potential distracters from driver attention to primary driving tasks.
A secondary task becomes a distraction (including visual-, auditory-, cognitive-, and biomechanical distractions) when the driver's attention is captured thereby to a degree that insufficient attention is left for the primary control tasks of driving.
As a result, driving performance such as lane keeping and speed control are compromised as ultimately is safety.
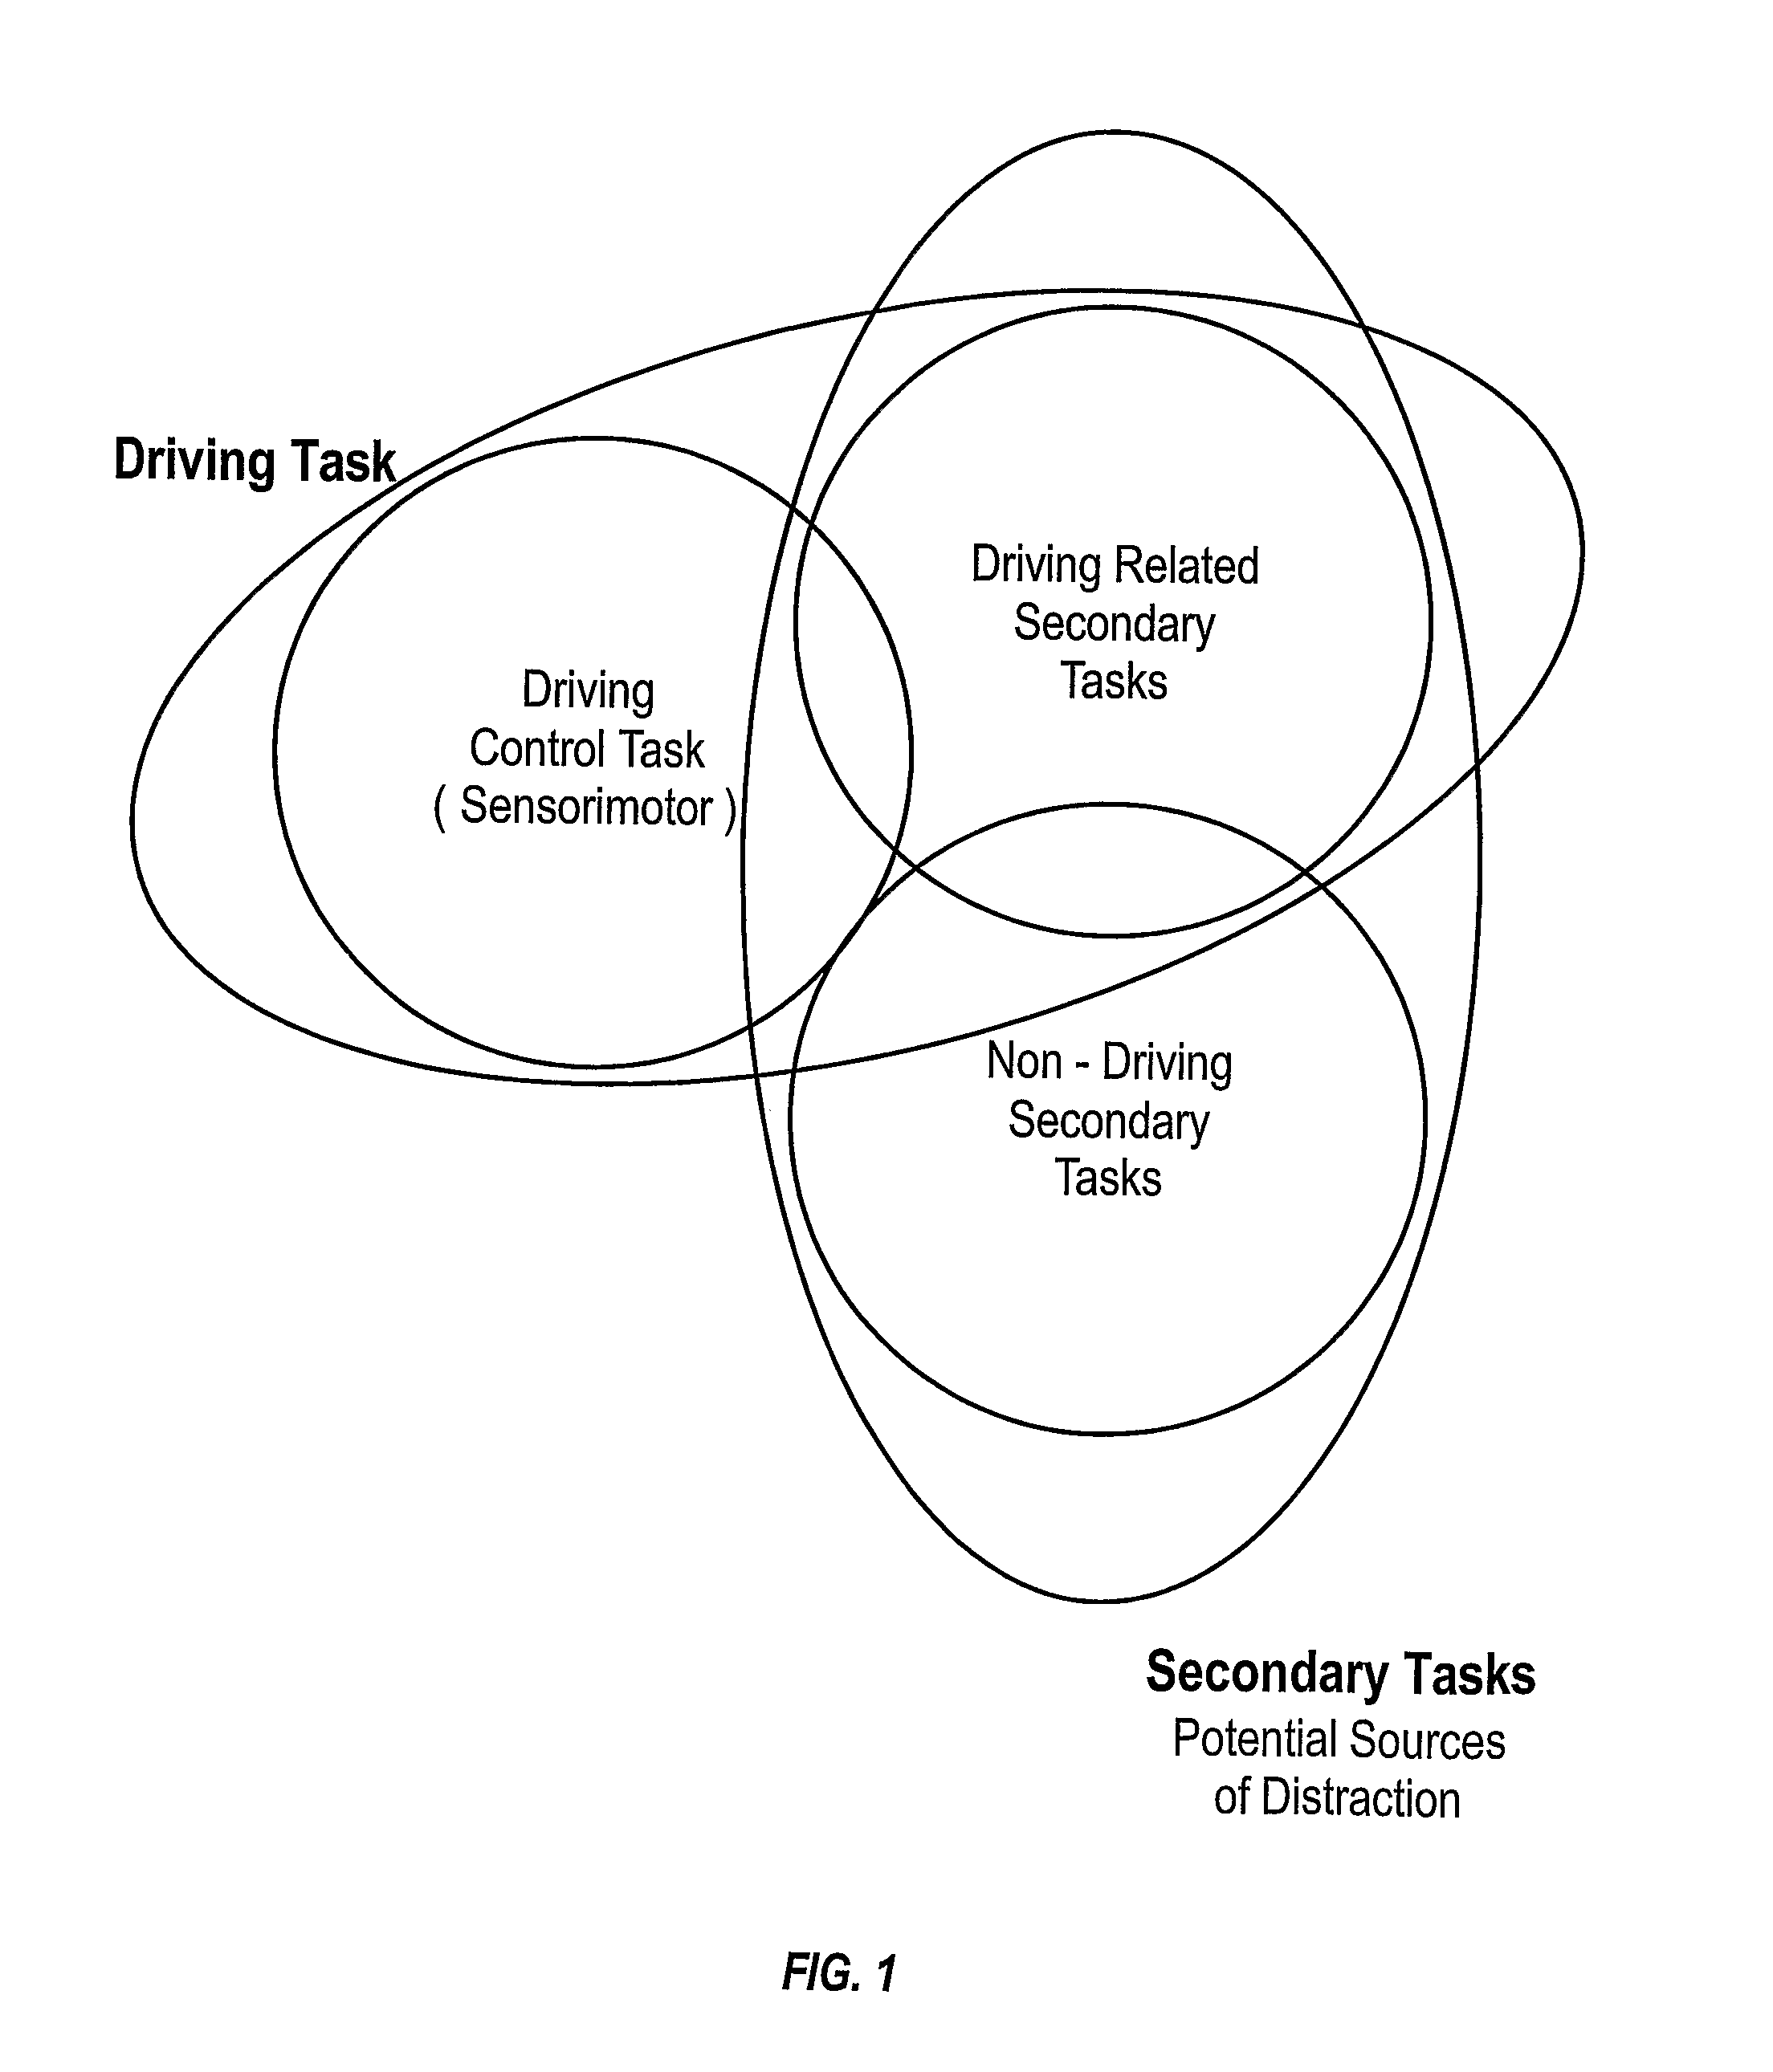
Two difficulties arise from this relationship between the driving and secondary tasks.
First, it can be difficult to delineate which secondary task information is “irrelevant to the driving situation” and which is not; and second, certain driving related secondary tasks, for instance, looking for a street sign or planning a driving route may also compromise safety as graphically depicted in FIG. 1.
Also, drivers cannot reliably determine when they are impaired by fatigue to the point of having a serious vigilance lapse or uncontrolled sleep attacks.
A primary drawback associated with current methods, however, is that there are few, if any, suitable automated tools for performing the analysis; in their absence, resort is commonly made to labor intensive, manual analysis.
A significant problem in current eye movement research is that every research team seems to use their own definitions and software to decode the eye movement signals.
This makes research results very difficult to compare between one another.
However, the two standards are based on a recorded-video technique, and rely on frame-by-frame human-rater analysis that is both time consuming and significantly unreliable.
Among other things, “noise” in the data has been found to be a significant factor impacting data-quality-degradation due to such things as variable lighting conditions and head / gaze motion.
It may seem that the previous work done in the area of eye tracking related research is reasonably exhaustive.
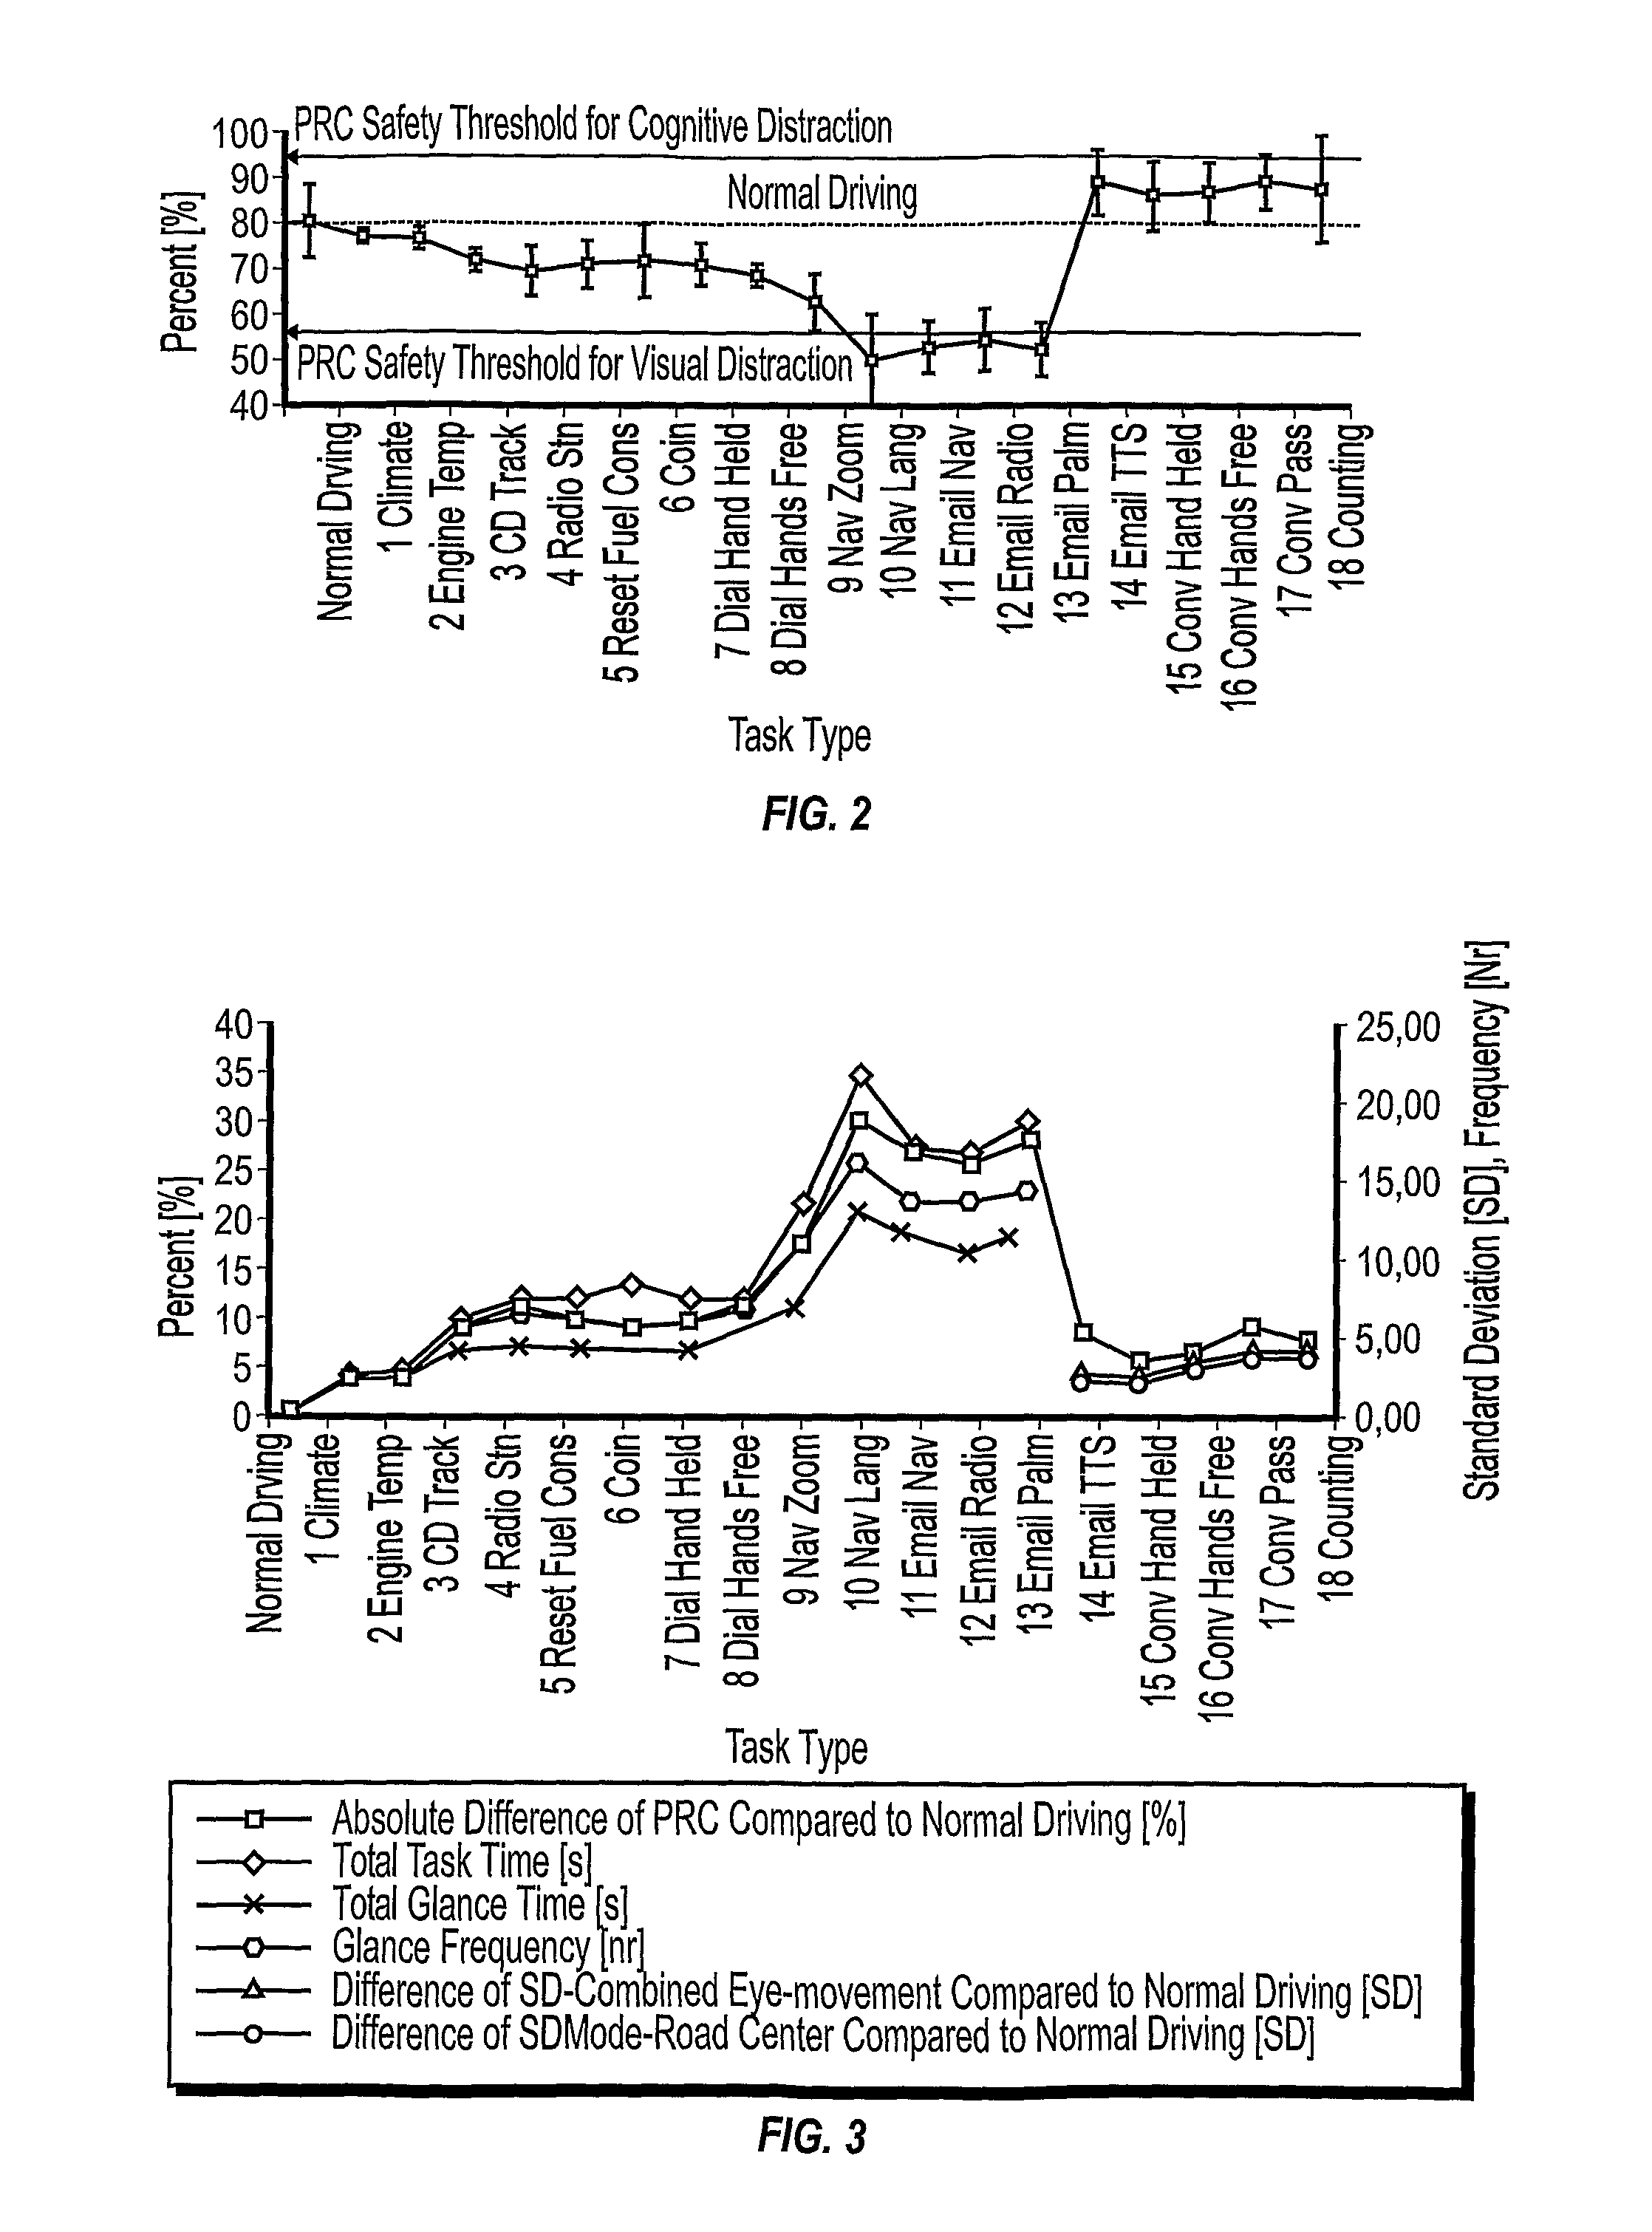
There are, however, not many on-road studies of driving task-related driver characteristics, and to date, there has been no utilization of eye-tracking data on a real-time basis to calculate measures such as visual or cognitive distraction (see FIGS. 2-4).
This is at least partially the result of the time consuming nature of manual segmentation and / or technical difficulties related to the non-portability of commonly used eye-tracking systems.
Many of these methods, however, are based on the typical characteristics of the eye tracker, such as sampling frequency, and do not work well with other such systems.
This avoidance by current research is understandable; it can be difficult to differentiate a smooth pursuit from a saccade or a fixation.
Even so, the statistics above demonstrate that even prudent drivers are not always attentive to driving demands, nor are they consistently good managers of their own work loads and distractions when driving.
The problem, which induces collisions, is that unexpected things might happen during the interval when the eyes are off the road and reactions to these unexpected events or objects can be seriously slowed.

Method used


Image

  • Method and apparatus for determining and analyzing a location of visual interest
  • Method and apparatus for determining and analyzing a location of visual interest
  • Method and apparatus for determining and analyzing a location of visual interest

Examples


Embodiment Construction

[0125]Before the actual data treatment techniques that are the focus of the presently disclosed invention(s) are described, some basic information will be provided regarding rudimentary characteristics of eye movements, as well as some general information about typical tracking systems that can be used to sense, quantify, and optionally record data descriptive of head and / or eye orientation (location and movement characteristics) in an effort to facilitate those readers possessing less than ordinary skill in these arts.

[0126]With respect at least to eye movement-based systems, presently available sensing systems used for gathering eye movement data deliver “raw” eye-movement signals that are rather noisy and which includes artifacts. As will become evident from reading the balance of the present disclosure, typically, head orientation tracking data can be utilized as an approximation, and therefore often a valid substitute for eye tracking data.

[0127]Algorithms of the present invent...


PUM


Abstract

A method of analyzing data based on the physiological orientation of a driver is provided. Data is descriptive of a driver's gaze-direction is processing and criteria defining a location of driver interest is determined. Based on the determined criteria, gaze-direction instances are classified as either on-location or off-location. The classified instances can then be used for further analysis, generally relating to times of elevated driver workload and not driver drowsiness. The classified instances are transformed into one of two binary values (e.g., 1 and 0) representative of whether the respective classified instance is on or off location. The uses of a binary value makes processing and analysis of the data faster and more efficient. Furthermore, classification of at least some of the off-location gaze direction instances can be inferred from the failure to meet the determined criteria for being classified as an on-location driver gaze direction instance.

Description

BACKGROUND AND SUMMARY[0001]The present invention generally relates to vehicle piloting; and more particularly, to the visual characteristics and behavior of a driver which is then analyzed to facilitate the driving experience and driver performance.[0002]There is significant ongoing research related to driver fatigue, distraction, workload and other driver-state related factors creating potentially dangerous driving situations. This is not surprising considering that approximately ninety-five percent of all traffic incidents are due to driver error, of which, driver inattention is the most common causative factor. Numerous studies have established the relationship between eye movements and higher cognitive processes. These studies generally argue that eye movements reflect, to some degree, the cognitive state of the driver. In several studies, eye movements are used as a direct measure of a driver's cognitive attention level, and alternatively mental workload.[0003]Knowing where a ...

Claims


Application Information

Patent Timeline
Patent Type & Authority Patents(United States)
IPC IPC(8): G08B23/00
CPCA61B3/113A61B5/1114A61B5/18A61B5/7203A61B5/7264A61B5/7207A61B5/6893A61B2503/22A61B5/163G16H50/20G06V40/19G06V20/597
Inventor VICTOR, TRENTKRONBERG, PETER
Owner VOLVO LASTVAGNAR AB
Why Eureka
Try Eureka