Method of processing spectrometric data

a spectrometry and data technology, applied in chemical methods analysis, particle separator tube details, instruments, etc., can solve the problems of insufficient mass accuracy alone, the most critical and time-consuming assignment of molecular formulas from mass data, and the inability to provide unequivocal identification

Active Publication Date: 2014-09-09
THERMO FISHER SCI BREMEN
View PDF5 Cites 6 Cited by
  • Summary
  • Abstract
  • Description
  • Claims
  • Application Information

AI Technical Summary

Benefits of technology

[0011](i) scaling the intensity of at least one of: all the selected peaks of the theoretical isotopic spectrum of the particular candidate composition under consideration, and / or all the peaks of the measured mass spectrum, to reduce the difference between the intensities of the peak of interest and the corresponding peak of the candidate composition;
[0051]Thus, in accordance with the present invention, scaled or normalized (these terms may be interchanged herein) quantities associated with the position (e.g. the mass or a quantity related thereto) and the intensity of measured peaks are employed to substantially improve the correct assignment of elemental compositions to measured molecular peaks. The time thus taken to characterize a given sample is thereby greatly reduced, and the accuracy of that sample characterization, is improved.

Problems solved by technology

The output from the mass spectrometer must be interpreted before samples can be characterised, and this presents technical problems.
Molecular formula assignment from mass data is most critical and time-consuming.
Despite technological advances and improved mass accuracy, often the mass accuracy alone does not provide unequivocal identification.
The number of candidate formulae increases exponentially with mass, making high mass molecular determination particularly challenging.

Method used


Image

  • Method of processing spectrometric data
  • Method of processing spectrometric data

Examples


Embodiment Construction

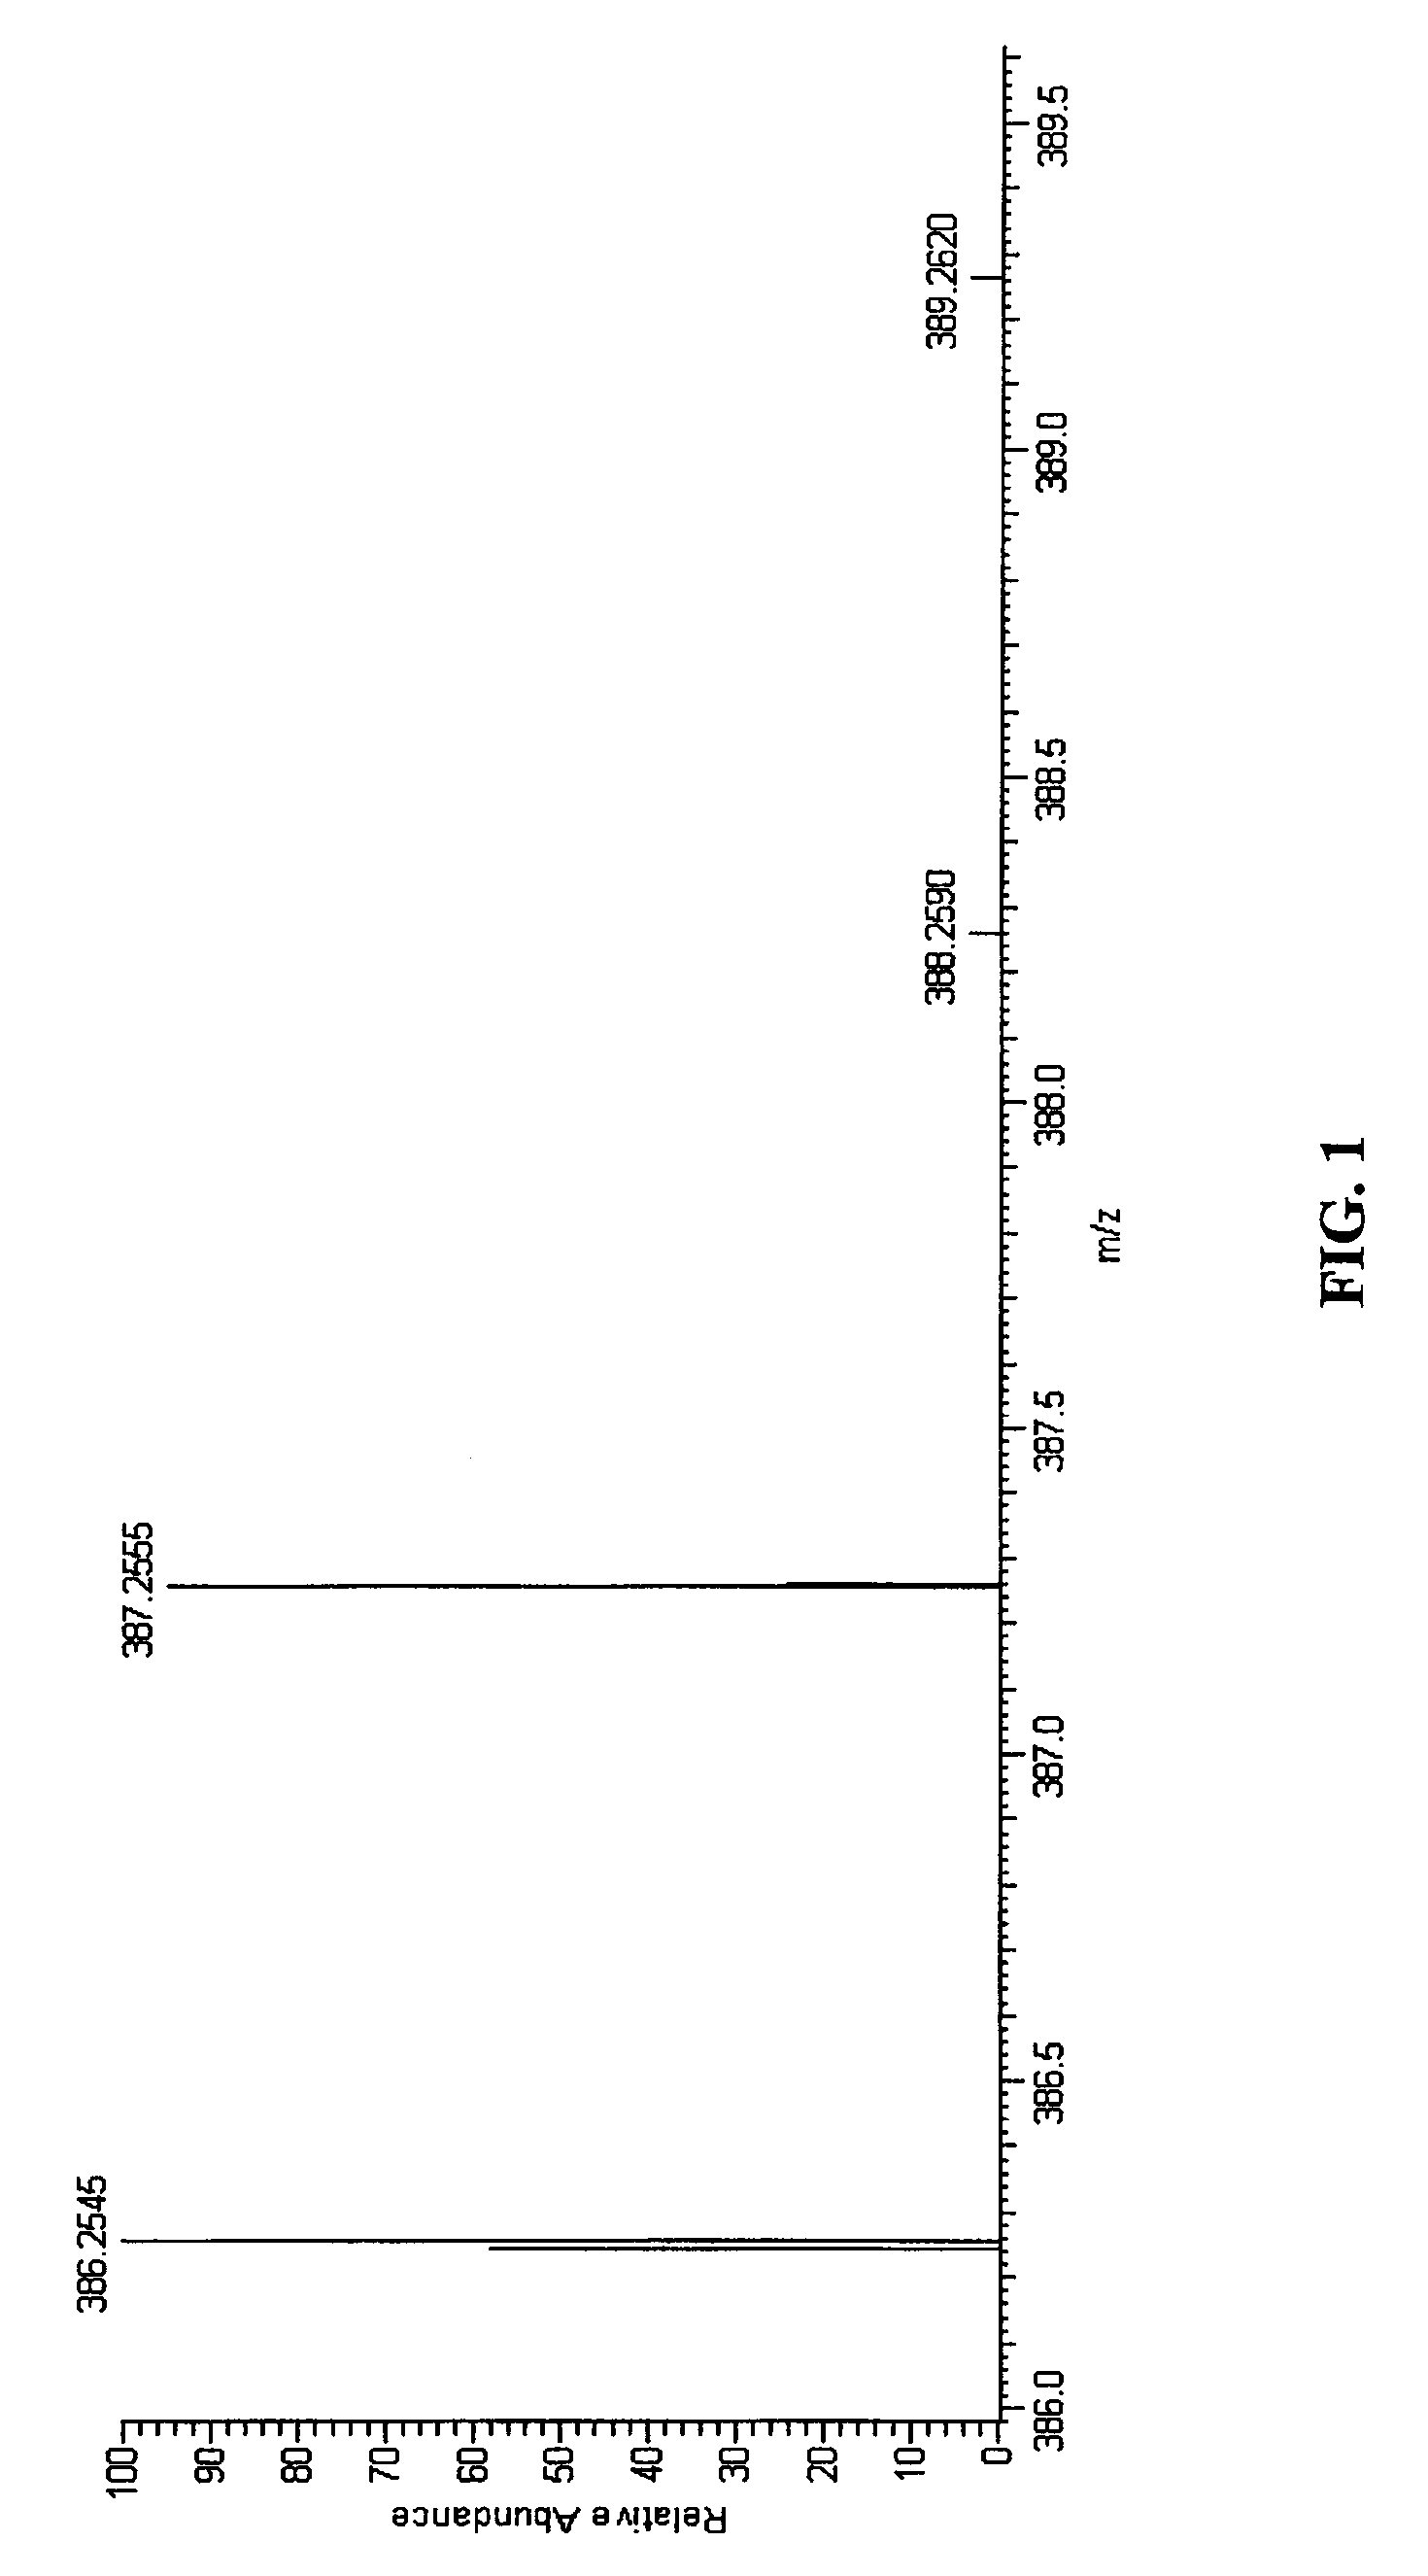
[0054]The invention will now be described in more detail with reference to the mass spectrum of a known compound, Buspirone. However, it will be appreciated that the individual features of the invention described are of general applicability. FIG. 1 shows a mass spectrum of Buspirone, obtained by liquid chromatography mass spectrometry (LC-MS). The mass analysis was carried out using an FT-ICR mass spectrometer operated at high resolution. Specific details of the experimental arrangement (i.e. the specific components employed in the mass spectrometer arrangement) are not critical to an understanding of the present invention and, in any event, various embodiments would be familiar to the skilled reader. Such arrangements are shown, just as examples, in U.S. Pat. No. 6,987,261 and U.S. Pat. No. 7,211,794 and in Parts per Million Mass Accuracy on an Orbitrap Mass Spectrometer via Lock Mass Injection into a C-trap”, Mol. Cell. Proteomics, December 2005; 4: 2010-2021; Jesper V. Olsen, Ly...


PUM

PropertyMeasurementUnit
massaaaaaaaaaa
massaaaaaaaaaa
mass toleranceaaaaaaaaaa

Abstract

A method of characterizing a sample from spectrometric data using calculation of spectral distance values is disclosed, for use in the field of mass spectrometry. Molecular formula assignment of peaks in mass spectral data is difficult and time-consuming, and the invention provides a computer implemented method of finding a most likely elemental composition of a measured spectral peak of interest. The method analyzes isotopic peaks in a portion of the spectrum, using both their mass positions and intensities, to determine a spectral distance between those peaks and isotopic peaks of a candidate composition, finding peaks that match (140). A pattern spectral distance is determined (150) to provide a measure of the correspondence between a set of those peaks in the measured spectrum and peaks of each of a number of candidate compositions. The spectral fit is used to determine a most likely candidate composition.

Description

FIELD OF THE INVENTION[0001]This invention relates to a method of processing spectrometric data. The method is preferably though not of necessity implemented in computer software, for analysis of mass spectrometric data.BACKGROUND TO THE INVENTION[0002]Ultra-high resolution mass spectrometry, such as is achievable using a Fourier transform ion cyclotron resonance mass spectrometer (FT-ICR-MS), or an Orbitrap™ mass spectrometer, enables the identification of thousands of different molecular formulas in organic matter. Coupled with liquid chromatography (LC), accurate mass determination of components of complex mixtures can be made on a routine basis. Applications include, amongst others, screening combinatorial chemistry libraries and identifying metabolites related to drug discovery, screening for anabolic steroids in illegal cocktails and fungal metabolites in culture extracts, and elucidating unknown compounds in environmental water.[0003]The output from the mass spectrometer must...

Claims


Application Information

Patent Timeline
Patent Type & Authority Patents(United States)
IPC IPC(8): G01N33/48G01N31/00G01N33/50G06F17/10G06F17/11G06F19/12
CPCG06F19/12G06F17/10G06F17/11G06F19/703H01J49/02G06K9/00543G16C20/20G16B5/00G06F18/00G06F2218/14
Inventor PFAFF, HANS
Owner THERMO FISHER SCI BREMEN
Why Eureka
Try Eureka