
Apparatus and method for optimizing data capture and data correction for spectroscopic analysis

a spectroscopic analysis and data capture technology, applied in the field of apparatus and methods for optimizing data capture for spectroscopic analysis, can solve the problems of increasing measurement time, deteriorating efficiency of these instruments, and inefficient systems for light collection, so as to increase the accuracy of a spectrometer system and increase the accuracy

Active Publication Date: 2017-01-17
P&P OPTICA
View PDF18 Cites 28 Cited by
  • Summary
  • Abstract
  • Description
  • Claims
  • Application Information

AI Technical Summary

Benefits of technology

The present invention provides methods for getting the most information from spectral instruments that use dispersive components and two-dimensional detector arrays. The methods correct for various quality issues that can affect the accuracy of the data collected, resulting in improved accuracy of the spectrometer system. The correction algorithm takes into account various factors such as light source quality, exposure time, distortion in y direction, distortion in x direction, temperature dependence, pixel alignment variability, dark pixels, bad pixels, and pixel read noise, among others. The methods allow for cross-calibration of spectrometers using different components, designs, and manufacturing, ensuring consistent data collection regardless of resolution or spectral bandwidth.

Problems solved by technology

These systems are inefficient in light collection since resolution dependent, narrow bands are collected for analysis, while other bands are ignored.
Therefore efficiency of these instruments deteriorates with resolution, thereby increasing measurement time and increasing the amount of unused light.
The unused light contributes to increased background scatter light and further deteriorates the quality of the obtained results.
Furthermore, some instruments, such as Seya-Namioka spectrometers compress narrow spectral bands of light emerging from a slit to fall on a single detector without distinguishing the information content coming from different points of that slit.
However, the spatial distribution of spectrally dispersed light contains additional information about the sample under observation and the lack of differentiation of spatial distribution diminishes the utility of traditional one dimensional LDEs.
The electronic noise of the photo detector also contributes to the overall noise.
Furthermore, most electronic detector arrays are significantly impacted by sensor temperature.
The typical approaches of averaging, binning or taking multiple measurements is flawed, as the noise profile of only the photo detector is taken into account, and the systemic noise sources of spectroscopic system are not all considered.
Most methods to process signals and reduce noise are directed to image creation, and are not optimized for spectroscopic analysis.

Method used


Image

  • Apparatus and method for optimizing data capture and data correction for spectroscopic analysis
  • Apparatus and method for optimizing data capture and data correction for spectroscopic analysis
  • Apparatus and method for optimizing data capture and data correction for spectroscopic analysis

Examples


Embodiment Construction

[0087]The following description is of a preferred embodiment.

[0088]A method for generating, collecting, monitoring and pre-processing electronic data in a two-dimensional matrix which corresponds to spatial and spectral distribution of signal, for the purposes of spectroscopic analysis is provided herein.

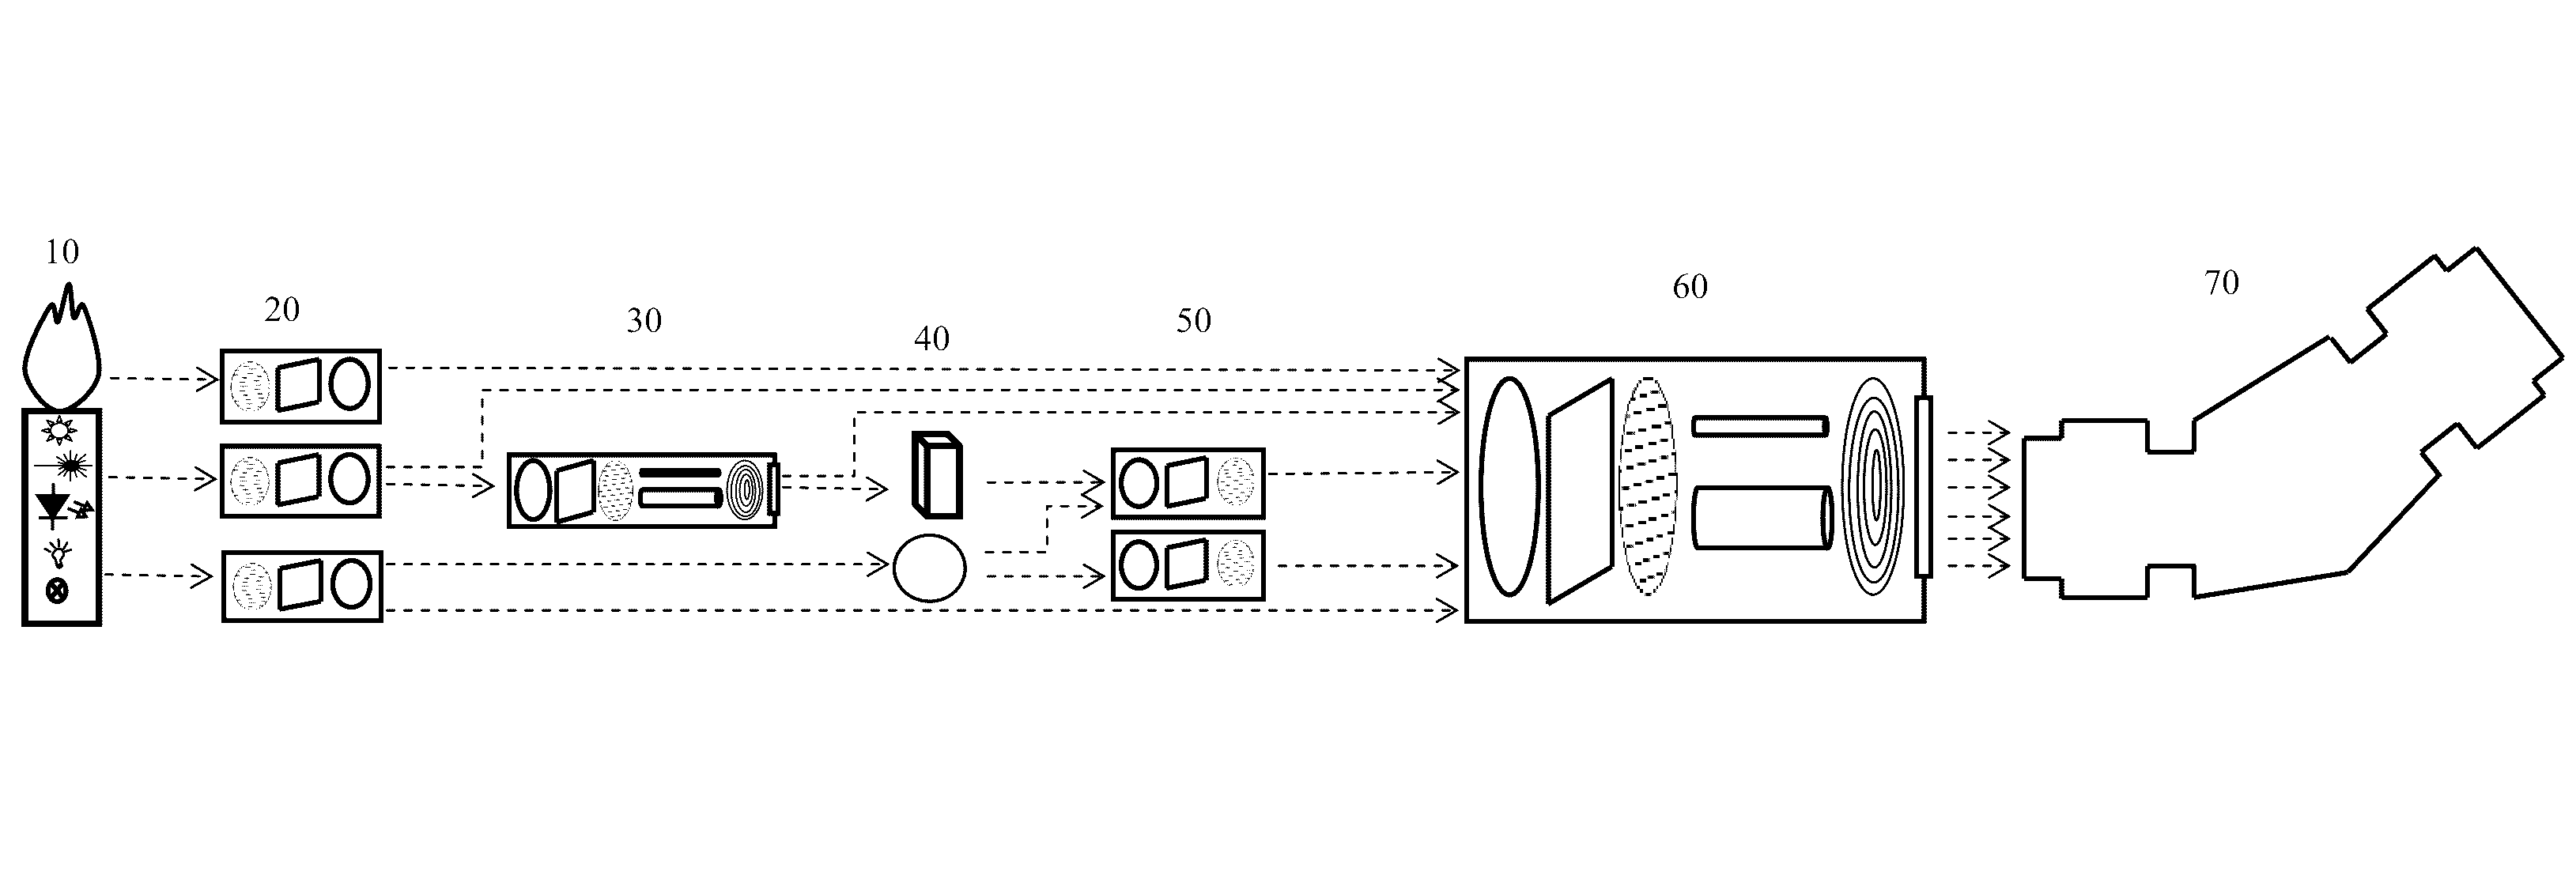
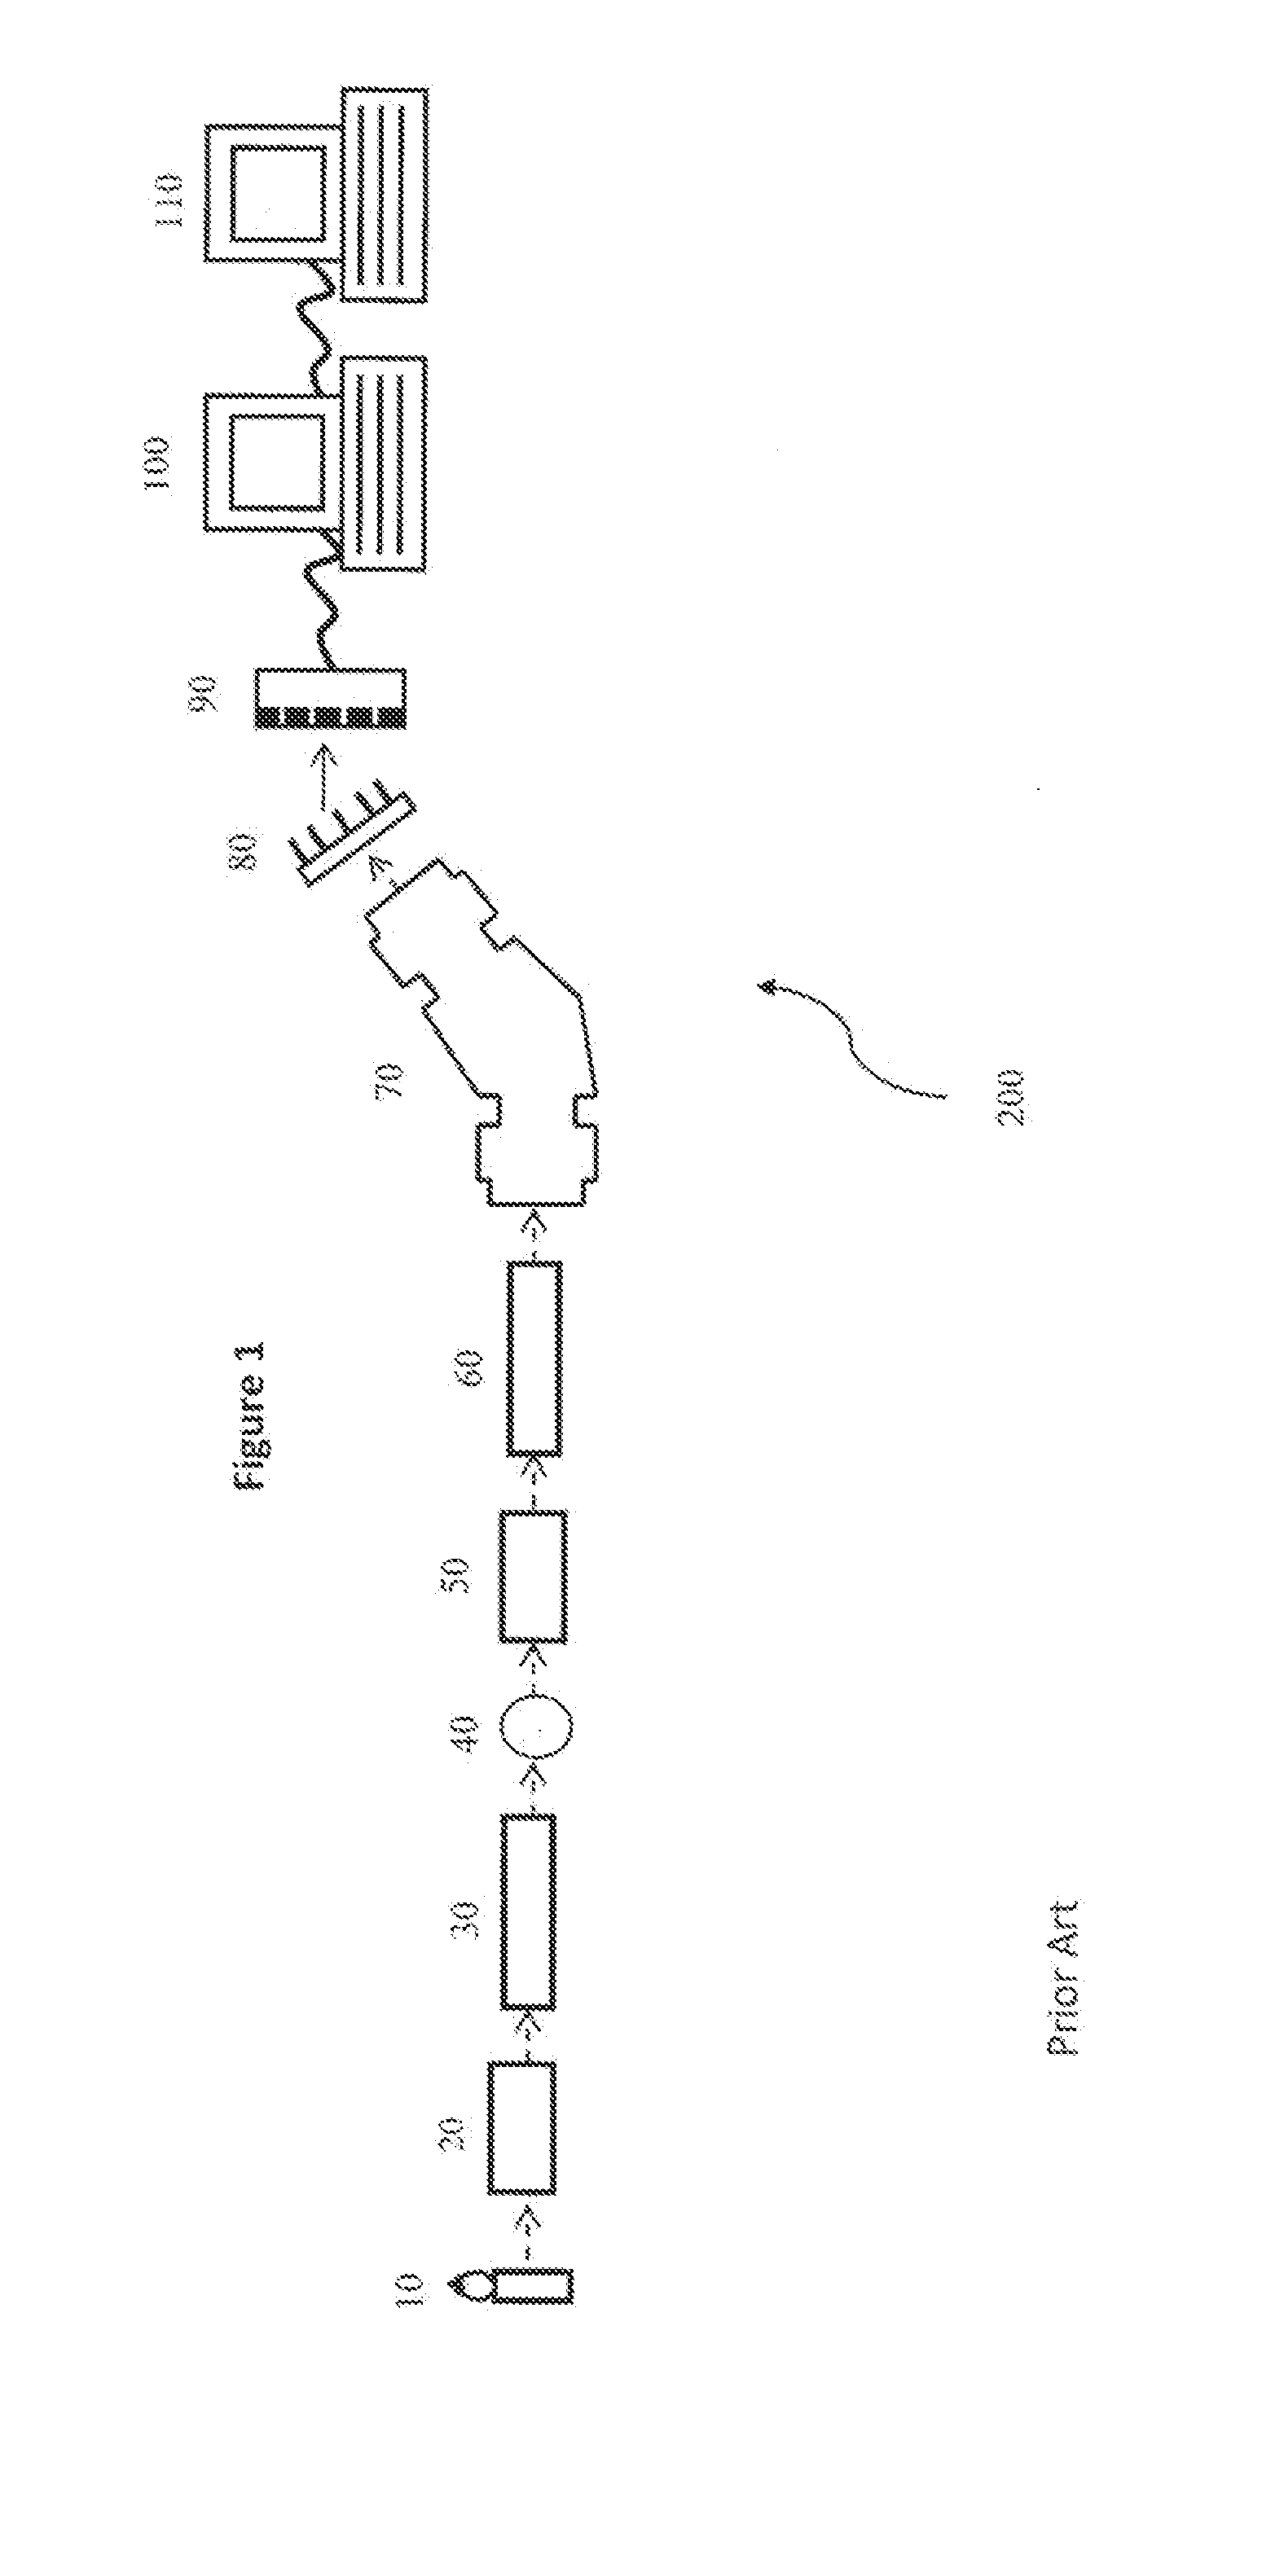
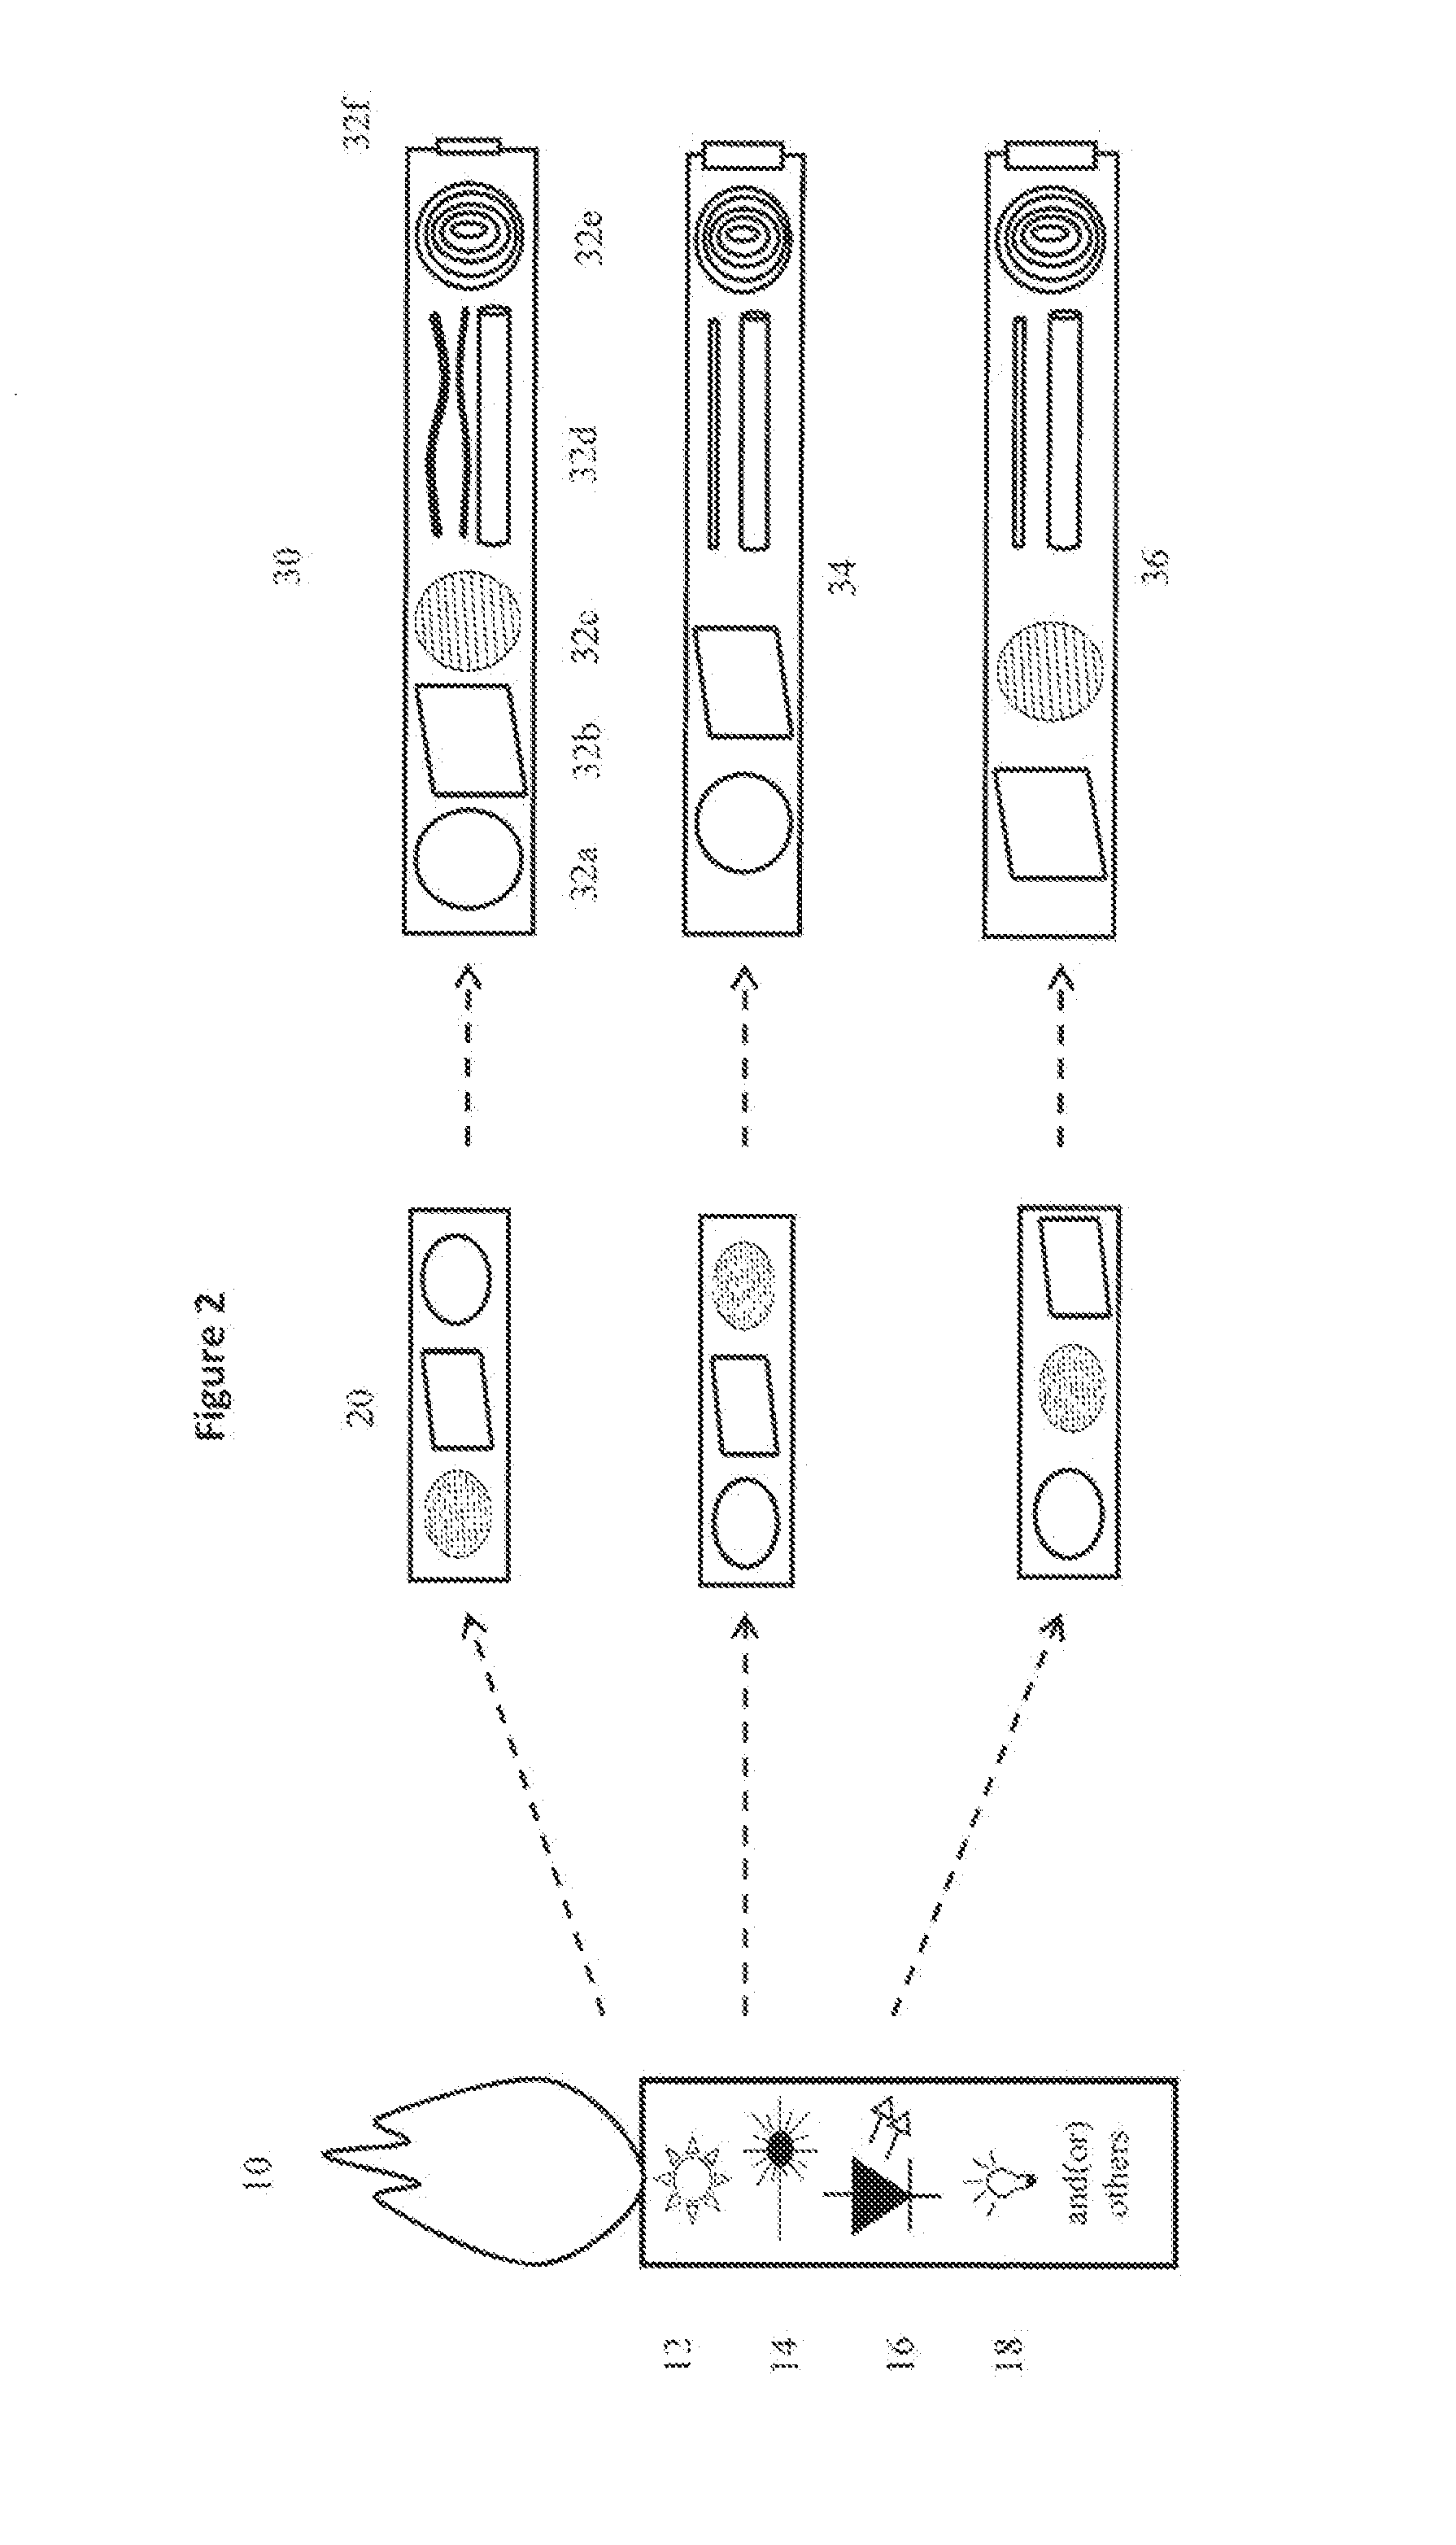
[0089]With reference to FIG. 1, there is shown a typically spectrometer system 200 comprising a source of EM radiation 10, for example but not limited to an external light source. Radiation from the EM source 10 is collected using a source light collector (SLC; 20). The collected light is transformed into a spatial light distribution that is optimal for sample illumination, for example structured illumination light, that is produced using an illumination light structuring component (ILSC; 30). Interaction of the structured illumination light with the sample 40 produces light that contains information about the composition of the sample which is then analyzed spectrally. The light fr...


PUM


Abstract

A method and an apparatus for increasing the accuracy of a spectrometer system corrects for light source quality, exposure time, distortion in y direction, distortion in x direction, temperature dependence, pixel alignment variability, dark pixels, bad pixels, pixel read noise, and pixel dark current noise. The method and apparatus produces an algorithm for optimizing spectral data and for measuring a sample within the spectrometer system using the optimization algorithm. The spectrometer apparatus comprises a composite external light source, a source light collector, an illumination light structuring component, a sample, a sample light collector, a spectrometer light structuring component, a light dispersing engine, photo detectors, an electrical signal converter, a data preprocessing unit, and a data analyzer. The method and apparatus can include a corrected photo detector algorithm, sample illumination correction algorithm, LDE-PD alignment procedure, SLSC-LDE alignment procedure, distortion correction matrix, and an algorithm for optimizing of spectral data.

Description

FIELD OF INVENTION[0001]The present invention relates to an apparatus and method for optimizing data capture for spectroscopic analysis.BACKGROUND OF THE INVENTION[0002]Spectroscopy is a tool for remote, non-destructive, non-invasive, or minimally invasive analysis of elemental content or molecular composition of samples. Spectral content of the electromagnetic radiation (EM radiation) that is emitted by the sample under specific conditions, or produced by external source and modified as a result of interaction with the sample may be analyzed using spectroscopy.[0003]Applications of spectroscopy include chemical composition determination, sample identification and differentiation and may be used in applications such as food processing, food sorting, petrochemical analysis; chemical composition identification of ore, minerals, pharmaceutical agents; differentiation between healthy and disease affected tissues; analysis of chemical composition of solids, powders, fluids, gases, and mi...

Claims


Application Information

Patent Timeline
Patent Type & Authority Patents(United States)
IPC IPC(8): G01J3/28H04N5/367G01J3/02
CPCG01J3/28G01J3/027H04N5/367G01J3/2803H04N25/68
Inventor PAWLUCZYK, OLGAPAWLUCZYK, ROMUALDPRETTI, MICHAEL
Owner P&P OPTICA
Learn More