Method for determining dry land optimum phosphorus application amount
An optimal, dryland technology, applied in the direction of material inspection, soil material testing, etc., can solve the problem of soil phosphorus loss and other issues
- Summary
- Abstract
- Description
- Claims
- Application Information
AI Technical Summary
Problems solved by technology
Method used
Image
Examples
Embodiment 1
[0022] The present invention will be described in further detail below in conjunction with the accompanying drawings.
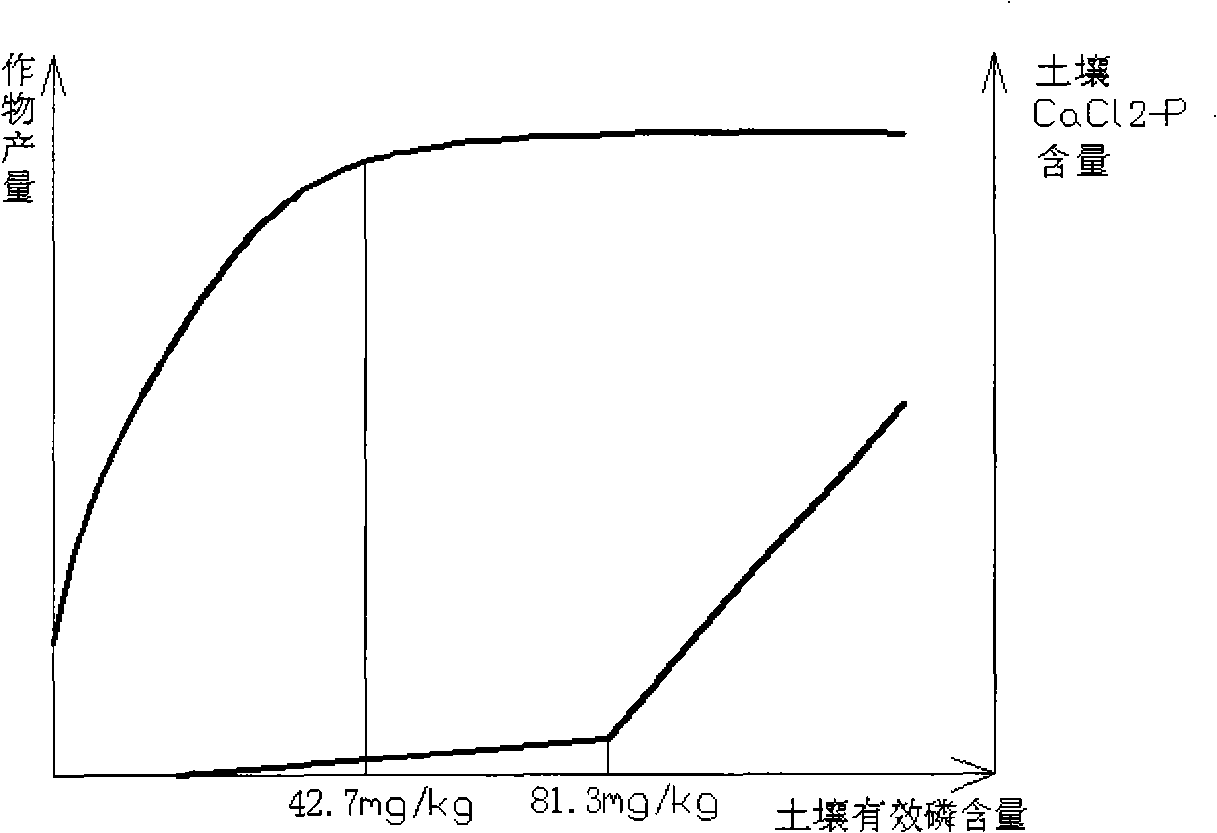
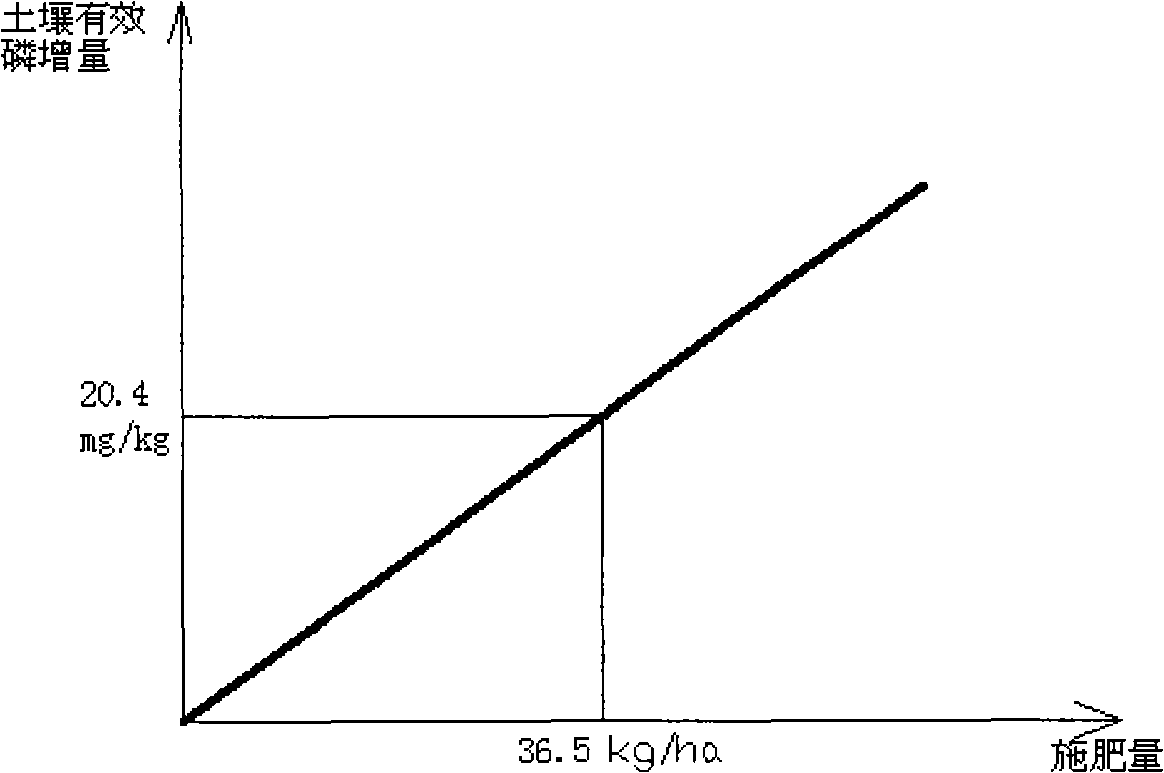
[0023] Such as Figure 1 ~ Figure 2 As shown, take the Sujiatun wheat field in Shenyang City as an example.
[0024] 1) Drawing of the working curve: Take 1 hectare as the unit, randomly select 15 parts of dry land surface soil, air-dry and sieve, mix it with 0-200kg / ha concentration of phosphorus fertilizer for pot test. After fertilization, keep the local Sujiatun field conditions in Shenyang City for about a week, and measure the soil available phosphorus and 0.01MCaCl 2 Solution leaching phosphorus content, plotting soil available phosphorus and CaCl 2 -P relationship curve (see figure 1 ) and the relationship curve between soil available phosphorus increment and soil fertilization amount (see figure 2 ). The soil available phosphorus determination method can be Olsen method, Bray method or Mehlick3 method (Lu Rukun. Soil Agricultural Chemical Analy...
Embodiment 2
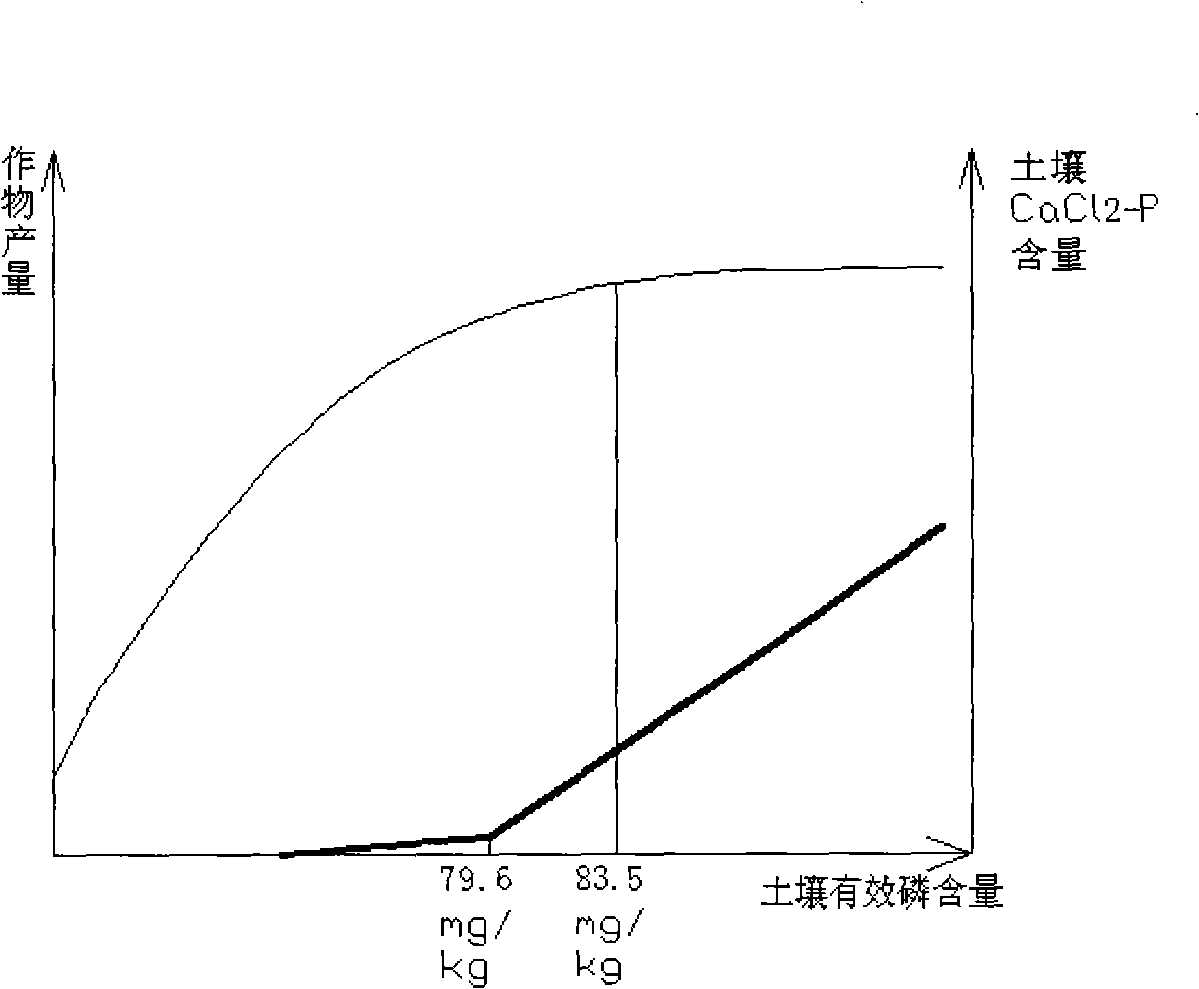
[0032] Such as Figure 3 ~ Figure 4 As shown, take the vegetable greenhouse in Damintun Town, Xinmin City as an example.
[0033] Taking 1 hectare as the unit, randomly select 15 parts of dry land surface soil, air-dry and sieve, mix it with 0-200kg / ha phosphorus fertilizer for pot experiment. Keep the local field conditions for about a week after fertilization, and measure the soil available phosphorus and 0.01MCaCl 2 Solution leaching phosphorus content, plotting soil available phosphorus and CaCl 2 -P relationship curve (see image 3 ). Simultaneously draw the relationship curve between soil fertilization amount and soil available phosphorus increment Figure 4 . Then plant the local main vegetable variety cucumber, measure the cucumber yield after harvesting, and draw the relational curve of soil available phosphorus content and cucumber yield (see image 3 ).
[0034] Soil available phosphorus and CaCl 2 The turning point of the -P relationship curve corresponds t...
PUM
 Abstract
Description
Claims
Application Information
 - R&D
- Intellectual Property
- Life Sciences
- Materials
- Tech Scout
- Unparalleled Data Quality
- Higher Quality Content
- 60% Fewer Hallucinations
Browse by: Latest US Patents, China's latest patents, Technical Efficacy Thesaurus, Application Domain, Technology Topic, Popular Technical Reports.
© 2025 PatSnap. All rights reserved.Legal|Privacy policy|Modern Slavery Act Transparency Statement|Sitemap|About US| Contact US: help@patsnap.com


