Content detection method for glucosamine hydrochloride capsules
A technology of glucosamine hydrochloride and quality detection method, which is applied in the directions of measuring devices, instruments, scientific instruments, etc., can solve the problems of imperfect quality control method of glucosamine hydrochloride capsule, and achieves good recovery rate, good repeatability and good linear relationship. Effect
- Summary
- Abstract
- Description
- Claims
- Application Information
AI Technical Summary
Problems solved by technology
Method used
Image
Examples
experiment example 1
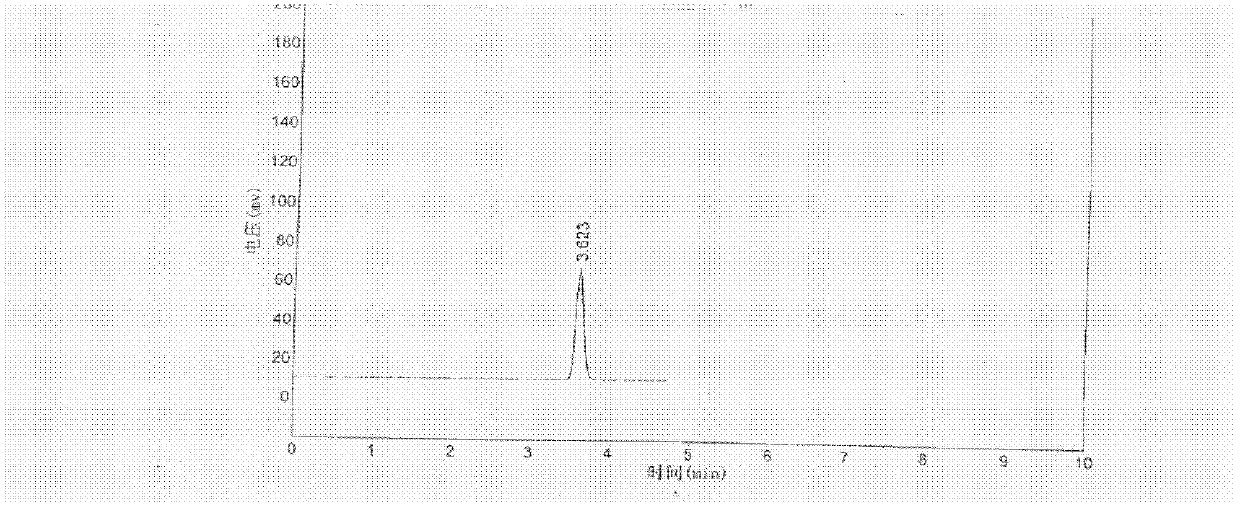
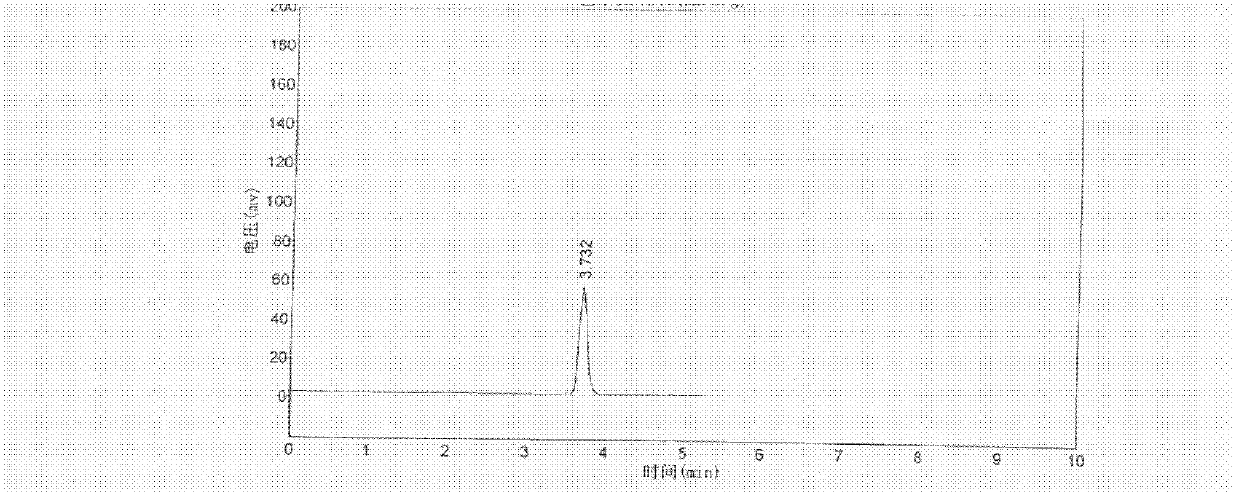
[0043] Experimental Example 1: System Suitability Experiment
[0044] Preparation of the test solution: Take an appropriate amount of the content (approximately equivalent to 100 mg of glucosamine hydrochloride), accurately weigh it, put it in a 100 ml measuring bottle, add water to dissolve, dilute to the mark, shake well, and obtain a solution with a concentration of about 1 mg / ml , The solution was filtered through a 0.45um microporous membrane, and the filtrate was taken as the test solution.
[0045] Preparation of reference substance solution: Take an appropriate amount of glucosamine hydrochloride reference substance, accurately weighed, and prepare solutions with a concentration of about 0.4 mg, 1 mg, and 2 mg in the same way as the test solution preparation method as the reference substance solution. The 2mg / ml reference substance solution was used as a stock solution.
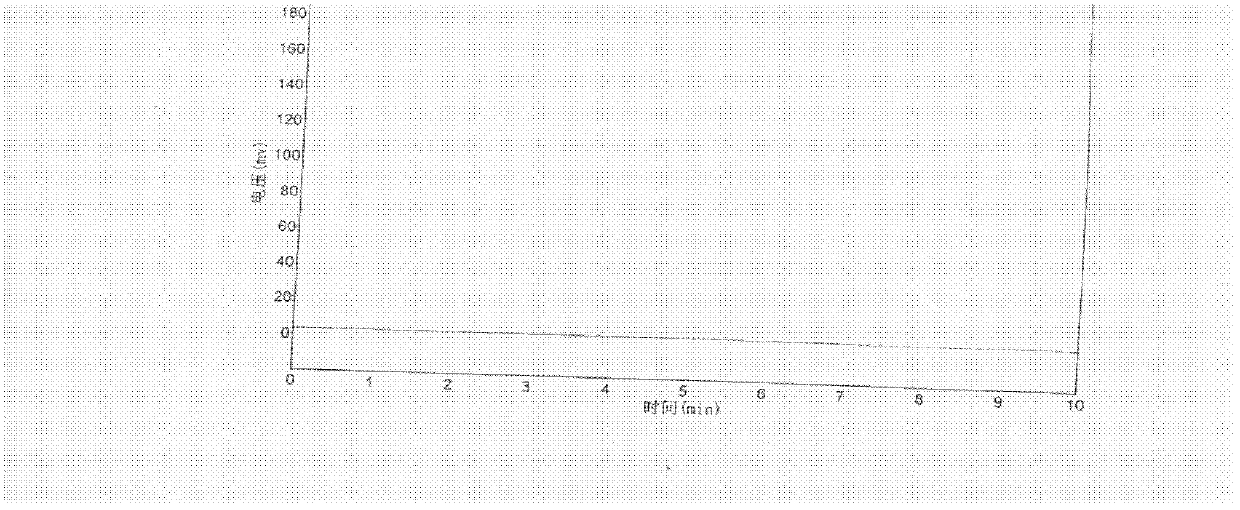
[0046] Preparation of negative excipient solution: weigh about 100 mg of excipient according to t...
experiment example 2
[0049] Experimental example 2: Linear relationship experiment
[0050] Get the reference substance stock solution (2mg / ml), add water and dilute to 0.4mg / ml, 0.8mg / ml, 1.2mg / ml, 1.6mg / ml, 2mg / ml different concentrations of the reference substance solution respectively. Draw 10ul of each reference substance solution respectively and inject into the liquid chromatograph. Calculate the linear equation and regression coefficient of the logarithm value of the sample volume and the logarithm value of the peak area, the results are shown in Table 1, attached Figure 4 .
[0051] Table 1 Linear range
[0052]
[0053] Regression equation: y=1.3842x+9.6798, correlation coefficient R 2 = 0.9989.
[0054] The experimental results show that the logarithmic value of the peak area and the logarithmic value of the injected volume have a good linear relationship when the injected volume is in the range of 4 μg to 20 μg.
experiment example 3
[0055] Experimental Example 3: Precision Experiment
[0056] Precisely draw 10ul of the reference substance stock solution (2mg / ml) and inject it into the liquid chromatograph. The determination was repeated 5 times, and the content of glucosamine hydrochloride was calculated according to the linear equation fitted in Experimental Example 2, and the results are shown in Table 2.
[0057] Table 2 precision experiment results
[0058]
[0059] The experimental results show that the precision of the instrument is good.
PUM
| Property | Measurement | Unit |
|---|---|---|
| concentration | aaaaa | aaaaa |
Abstract
Description
Claims
Application Information
 - R&D
- Intellectual Property
- Life Sciences
- Materials
- Tech Scout
- Unparalleled Data Quality
- Higher Quality Content
- 60% Fewer Hallucinations
Browse by: Latest US Patents, China's latest patents, Technical Efficacy Thesaurus, Application Domain, Technology Topic, Popular Technical Reports.
© 2025 PatSnap. All rights reserved.Legal|Privacy policy|Modern Slavery Act Transparency Statement|Sitemap|About US| Contact US: help@patsnap.com


