Optimal distinguishing method for red tide water body and main algae thereof

A discrimination method and technology with advantages, applied in the fields of marine technology, public safety, and marine ecology, which can solve the problems of high monitoring cost, complex red tide formation mechanism, poor timeliness and spatiality, etc.

Inactive Publication Date: 2012-10-10
TIANJIN UNIVERSITY OF SCIENCE AND TECHNOLOGY
View PDF4 Cites 12 Cited by
  • Summary
  • Abstract
  • Description
  • Claims
  • Application Information

AI Technical Summary

Problems solved by technology

[0003] The formation mechanism of red tides is relatively complicated. At present, there is no very effective way to prevent the occurrence of red tides. The loss caused by red tides can only be reduced through timely monitoring.
The commonly used monitoring tools for red tide are ships and airplanes, but ships an...

Method used


Image

  • Optimal distinguishing method for red tide water body and main algae thereof
  • Optimal distinguishing method for red tide water body and main algae thereof
  • Optimal distinguishing method for red tide water body and main algae thereof

Examples


example 1

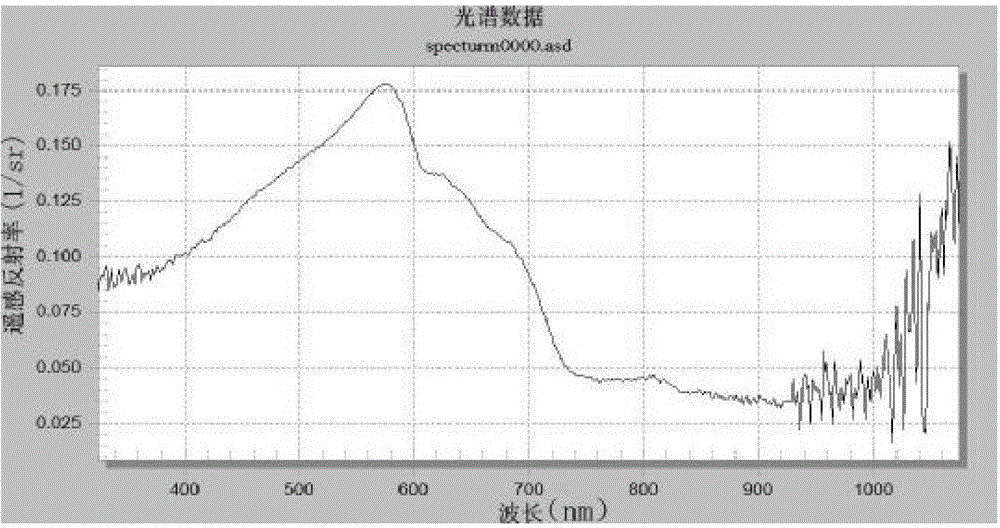
[0185] Example 1: The spectral differential method refers to determining the wavelength position of the maximum and minimum reflectance of the spectral curve by calculating the differential values ​​of different orders of the spectral curve. The spectral differential method is very sensitive to the spectral signal-to-noise ratio. Cloutis' research shows that the low-order differential processing of the spectrum is less sensitive to the influence of noise, so it is more effective in practical applications. In this example, the positions of the absorption and reflection peaks are calculated using the first and second derivatives. Derivative analysis can objectively separate the absorption peaks of algae. According to the analysis, the remote sensing albedo curve of the water body inoculated with red tide dominant algae presents an obvious double-peak and one-valley shape, while the remote sensing albedo curve of the water body not inoculated with dominant algae presents a single...

example 2

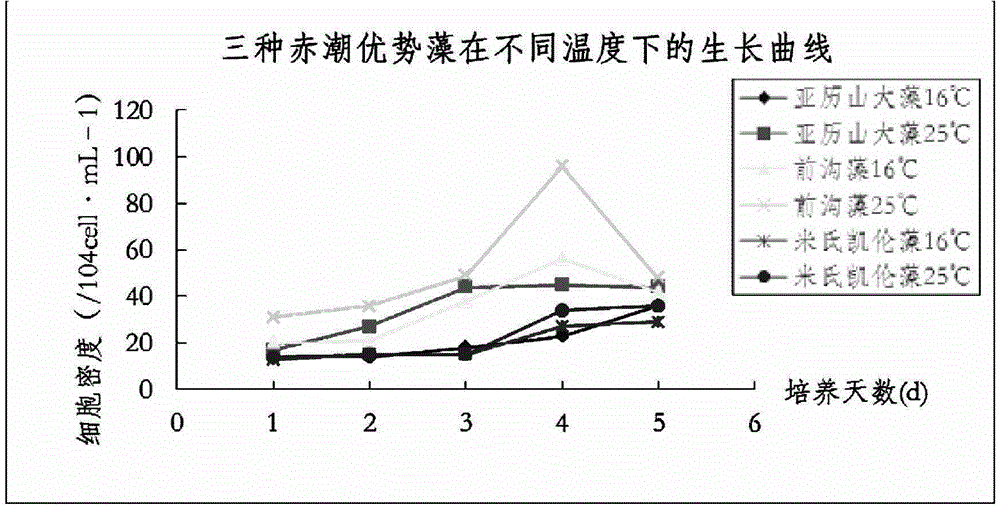
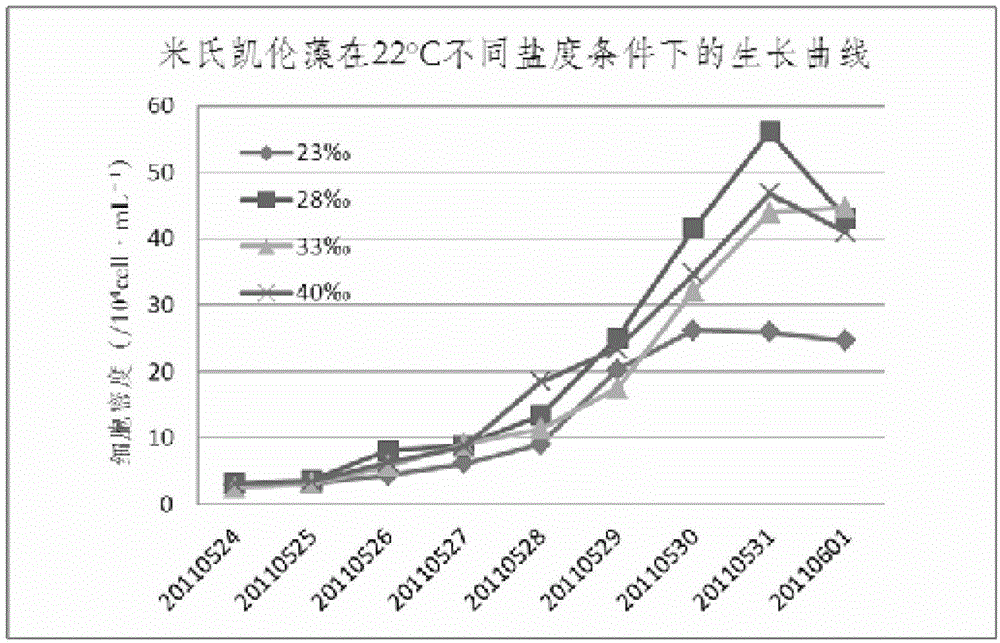
[0186] Example 2: In this example, the algae red tide remote sensing reflectance spectrum is taken as an example. According to the remote sensing reflectance curve and the first-order and second-order derivatives, the maximum and minimum values ​​can be calculated, and the point where the first-order derivative is 0 It is determined as the extreme point, and then through the second derivative, the point greater than 0 is the minimum point, and the point less than 0 is the maximum point, and then the positions of the first reflection peak, absorption peak and second reflection peak are identified. According to such an algorithm, the peak positions of three algae, Karenia militaris, Amphidinium, and Alexandrium, can be calculated. According to the comprehensive analysis, during the production period of dinoflagellates, the positions of absorption peaks and reflection peaks basically do not shift. Under different temperature and salinity conditions, the peak position basically do...

example 3

[0187] Example 3: In general, red tide water is rich in chlorophyll a, but chlorophyll a has strong absorption in the blue band (450-520nm) and red band (625-700nm) of visible light, so it mainly absorbs these two The dominant algae spectrum of each band is used to extract the absorption characteristic parameters. The absorption characteristics of the spectral curve can be expressed by a series of waveform parameters, these parameters specifically include: absorption peak central wavelength (P), absorption peak width (W), absorption depth (H), absorption area (A), symmetry (S) Wait. Clark and Roush proposed to use the continuous spectral removal method to calculate the five parameters of P, H, W, S and A of the spectral curve.

[0188] The data of remote sensing reflectance can be obtained through View Spec Spro, and then the remote sensing reflectance curve can be converted into a ratio reflectance curve by using ENVI software. Absorption parameters of algae under different...


PUM


Abstract

The invention relates to an optimal distinguishing method for a red tide water body and a main algae thereof, which comprises the following steps: (1) acquisition of spectroscopic data, which comprises the processes of laboratory culture of a red tide algae, measurement of the remote sensing reflectance and the post treatment of the spectroscopic data; and (2) analysis of the spectroscopic data, i.e. Carrying out comparison of spectral absorption characteristic parameters by a spectral absorption characteristic parameter extraction method through utilizing ENVI (The Environment for Visualizing Images) software, extracting wavelengths of a reflection peak and an absorption peak by a spectral differential method and carrying out comparison analysis on the water bodies before and after the red tide main algae is inoculated. According to the invention, by the spectroscopic data of different red tide main algae, which is obtained in a laboratory and the spectroscopic data flow processing, an abnormal value is removed to obtain a remote sensing spectral curve of Karenia mikimotoi, alexandrium tamarense and AmPhidinium; and the foundation is laid for the extraction of the absorption characteristic parameters and the spectral differential method.

Description

technical field [0001] The invention belongs to the fields of marine ecology, marine technology and public safety, and relates to marine environmental ecological protection, in particular to an optical discrimination method for red tide water body and its dominant algae. Background technique [0002] Red tide (Red tide) is an ecological anomaly in which some phytoplankton, protozoa or bacteria in seawater suddenly proliferate or highly gather in a short period of time under certain environmental conditions, causing the seawater to change color. Existing studies have shown that red tides not only cause significant economic losses to tourism, fishery resources and production, but also endanger the ecological environment of water bodies, destroy the circulatory system, and bring harm to human beings. According to incomplete statistics, the occurrence of harmful red tides is on the rise in my country. From 1998 to 2005, extremely large toxic red tides with an area of ​​several t...

Claims


Application Information

Patent Timeline
IPC IPC(8): G01N21/31
Inventor 李伟曹春晖陈双玲黄莉刘文岭殷为
Owner TIANJIN UNIVERSITY OF SCIENCE AND TECHNOLOGY
Why Eureka
Try Eureka